APPENDIX. Analysis. Main Slides. Supply chain
|
|
|
- Ashlyn Chapman
- 5 years ago
- Views:
Transcription


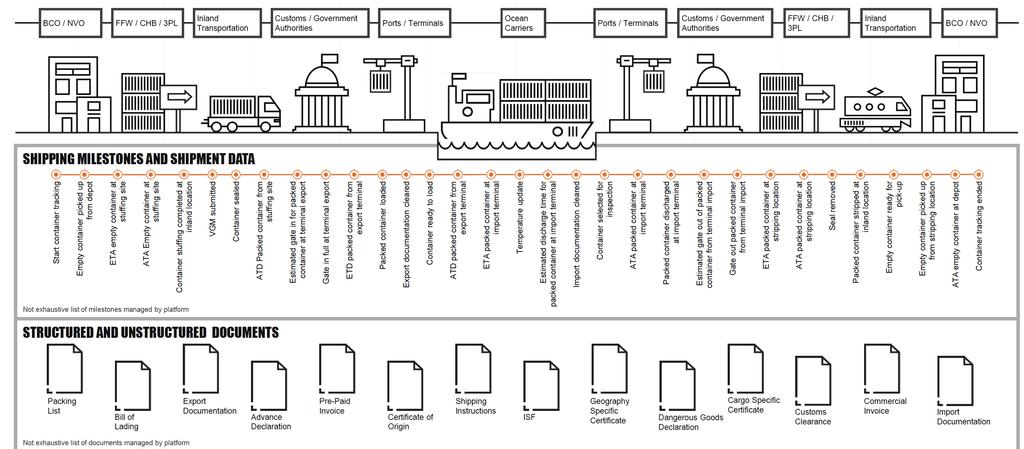
1 APPENDIX Main Slides Analysis OVERVIEW Analysis solution Supply chain risks/mitigation impact q&a 1


2 OVERVIEW Analysis solution risks/mitigation impact q&a 2
3 NWSA is considering what solution to implement in the digital supply chain / blockchain space 3

4 Blockchain technology can potentially revolutionize the container shipping industry Low Transparency Poor Security Inefficient 4


5 Blockchain technology can potentially revolutionize the container shipping industry Increase Transparency Improve Security Boost Efficiency 5

6 As a port authority, NWSA values healthy tenants and has the obligation to boost Washington economy NWSA is a port authority. We are basically landlords that lease out land to port operators (tenants) Dustin Stoker, COO NWSA 6
7 As a port authority, NWSA values healthy tenants and has the obligation to boost Washington economy NWSA is a port authority. We are basically landlords that lease out land to port operators (tenants) 1) Ensure our tenants are financially healthy 2) Boost Washington Economy Dustin Stoker, COO NWAS 7
8 As a port authority, NWSA values healthy tenants and has the obligation to boost Washington economy NWSA is a port authority. We are basically landlords that lease out land to port operators (tenants) 1) Ensure our tenants are financially healthy 2) Boost Washington Economy Dustin Stoker, COO NWAS Tenants are using their own proprietary systems that does not communicate with each other. There is room for improvement 8
9 A Decision matrix demonstrates which digital platform options are the most favorable 9
10 A Decision matrix demonstrates which digital platform options are the most favorable 10
11 A Decision matrix demonstrates which digital platform options are the most favorable Tradelens and CargoSmart are the most relevant market solutions for NWSA. 11


12 TradeLens has a purpose to be an open and neutral blockchain platform for the shipping industry 12


13 TradeLens has a purpose to be an open and neutral blockchain platform for the shipping industry 13


14 TradeLens has a purpose to be an open and neutral blockchain platform for the shipping industry 14
15 A SWOT framework shows TradeLens Key Attributes s w Expertise in Freighting & tech Strong Internal Financial Backing Momentum & Traction at Launch First Mover Advantage Independence Issues from Carrier Competitors High Resistance on Carrier Adoption Proprietary IP Gives Users No Rights o Push for Wide Adoption with Multiple Stakeholders Increase World GDP Rapid Innovation of New Services Rejection from Carriers Jeopardize Value of Platform Cyber & Data Security Breaches Rising Competition T 15


16 The blockchain platform from CargoSmart & Oracle can rival TradeLens 16
17 The blockchain platform from CargoSmart & Oracle can rival TradeLens 17
18 The blockchain platform from CargoSmart & Oracle can rival TradeLens 18


19 s w o OVERVIEW Analysis T solution risks/mitigation impact q&a 19


20 CargoSmart offers key attributes to progress NWSA s goals Trade Partners IP Independence Existing Connection 20
 Hutchinson Ports (Hong Kong) PSA International (Singapore)")
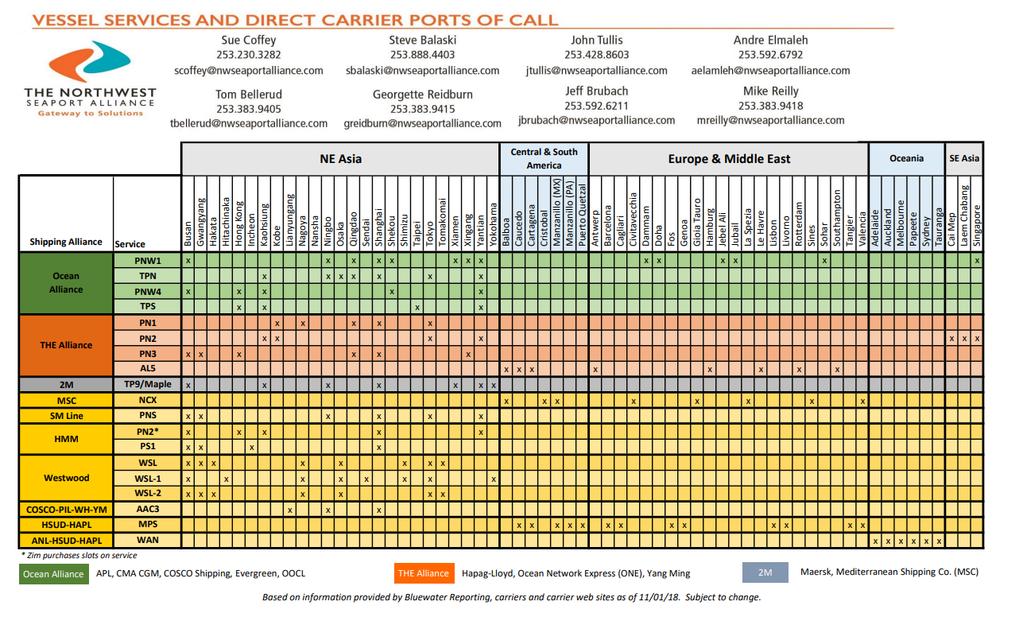
21 NWSA s main carriers and port partners are on CargoSmart Export/Import Ports 3 Main Asian Ports on CargoSmart SIP (Shanghai, China) Hutchinson Ports (Hong Kong) PSA International (Singapore) 21

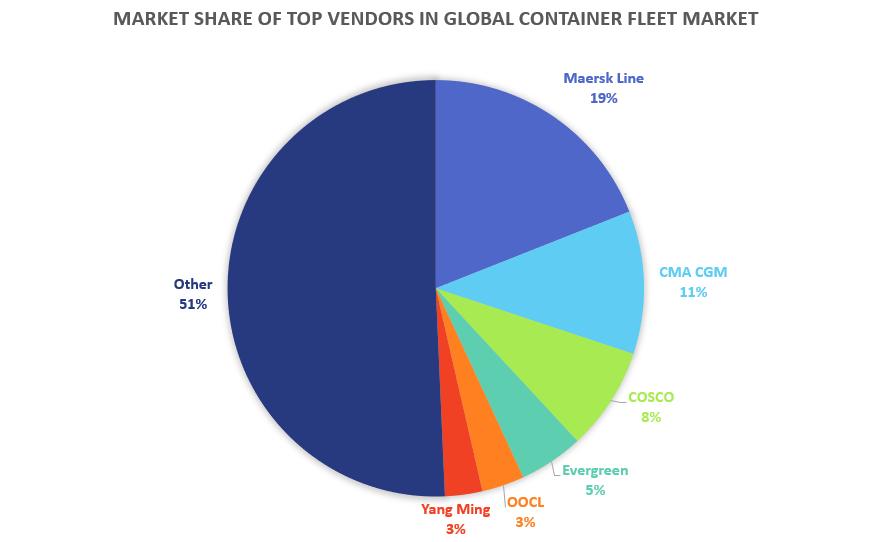
22 NWSA s main carriers and port partners are on CargoSmart Carriers/ Shippers 4 of 8 Main Carriers are on CargoSmart COSCO - China Evergreen - Taiwan Yang Ming - Taiwan OOCL - Hong Kong 22

23 CargoSmart is free of conflict of interest IP Independence Maersk s competing carriers refuse to onboard TradeLens due to conflict of interest CargoSmart, as a software solution provider, is independent and free of conflict of interest CargoSmart s user value centric model is appealing to newcomers 23


24 CargoSmart has a tie with NWSA Existing Connection Ex Director of Business Development and PNW Regional Sales Manager at CargoSmart NWSA has an existing tie with CargoSmart Utilize existing tie to join early adopter program Don is independent of CargoSmart 24
25 Our team has developed a few mitigation measures to potential risks Use a redundant system during the implementation phase 25
26 Our team has developed a few mitigation measures to potential risks Use a redundant system during the implementation phase Have benchmarks using KPIs and performance evaluations to correct early 26
27 Our team has developed a few mitigation measures to potential risks Use a redundant system during the implementation phase Have benchmarks using KPIs and performance evaluations to correct early Draft implementation plans to help ease transition and concerns 27


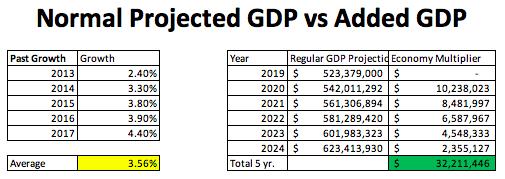
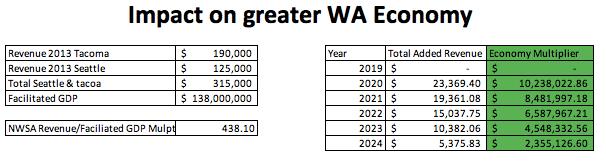
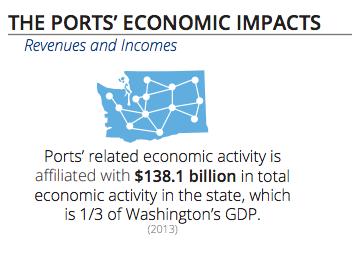
28 NWSA s Influence in Washington State Economy is important 28
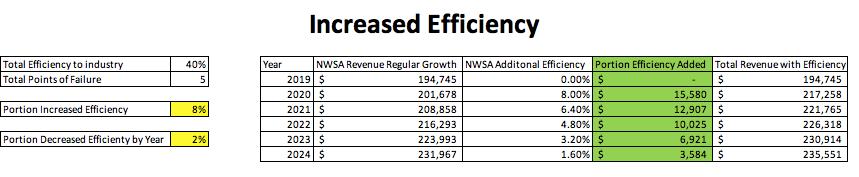
29 After onboarding, a positive stream of Financial & efficiency benefits are expected 4% 8% +$32B 29
30 30


31 31
32 APPENDIX Main Slides Extras 32

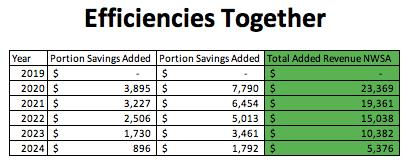
33 The following sensitivity analysis further indicates high expected savings and growth 33
34 34
35 35
36 36
37 37
38 38
39 39

40 40
41 41
42 42
43 43
44 44
45 45
46 46
47 47
48 48

49 49


50 Northwest Seaport Alliance s operations program manager 50

51 51

52 52
53 53
54 54
55 55


56 56


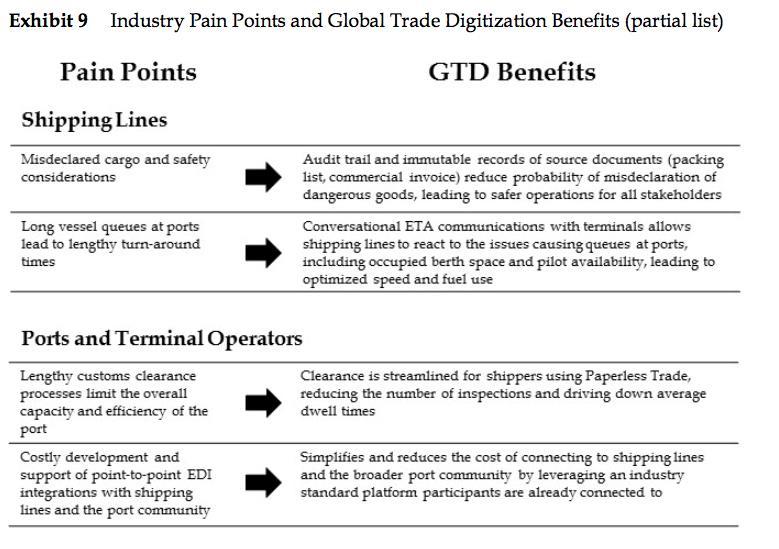
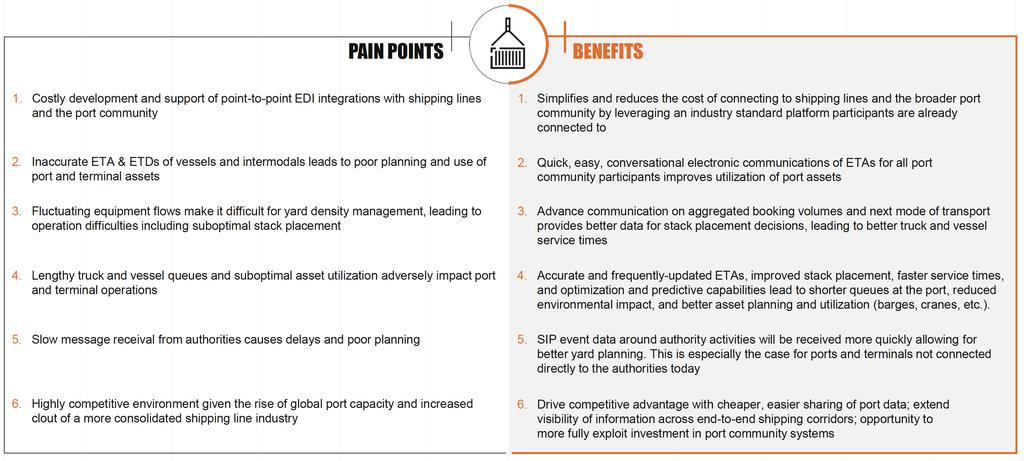
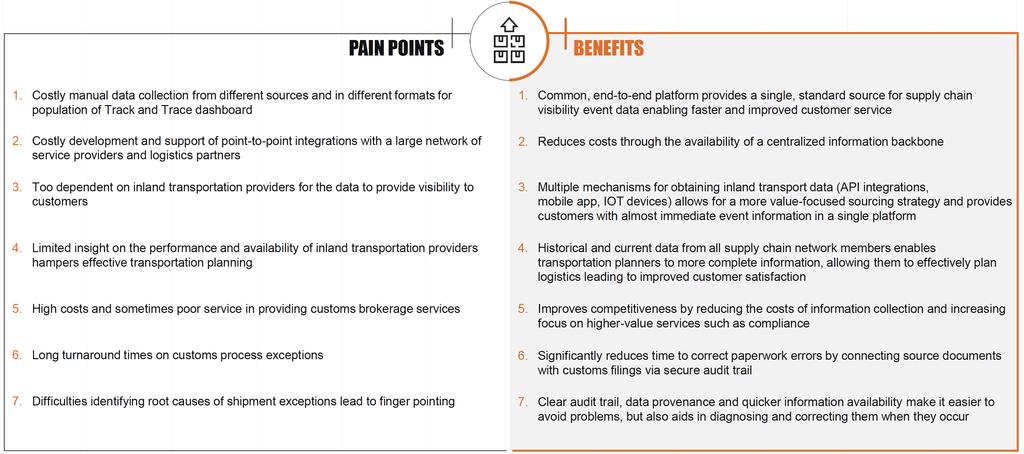
57 As a port authority, NWSA has unique needs as a participant in a digital trade platform for the shipping container industry Costly development and support Of point-to-point EDI integrations with Shipping lines and the port community. Inaccurate ETA & ETDs Leads to poor planning and use Of resources and port space. Reduces costs of connection By leveraging an industry standard platform Participants are already connected to. Quick and accurate ETA & ETDs For all port community participants Leads to improved utilization of port assets. Fluctuating Equipment Use Makes it difficult for port yard management Leading to operational difficulties. Advanced Communication Provides better data for decision-making Leading to better truck and vessel service times. 57
58 58
59 59
60 Stage 1 Stage 2 Stage 3 Stage 4 Go - Live Pitch platform to Seattle and Tacoma commissioners Identify in-scope facilities Map port shipping milestones to the platform Perform integration and conduct integration testing Authorize port systems to communicate on the platform Identify benefits to the greater Washington economy Secure participation of logistics partners Develop integration specifications (onboarding roadmap) Set up and train users Provide feedback on enhancements Get approval from the commissioners On-board CargoSmart team Assess impact to business Test workflow Monitor platform KPIs and value drivers Define user and security requirements Institute business process/org changes 60
61 Cargo Losses Activity Delays Reduction in Personal Cost Reduction in Operating Overhead Improvement on Inventory Turnover Rate Platform Downtime and Recovery Rate Other Supply Chain Participant Adoption Rate 61
62 62
63 63
64 64

65 65
66 66

67 67
68 68

69 69
70 70

71 71

72 72
73 Location Market share (2016) Los Angeles, CA 21.6% Long Beach, CA 16.4% New York / Newark 15.1% Savannah, GA 8% Norfolk, VA 5.5% Tacoma, WA 4.5% Charleston, SC 4.2% Houston, TX 4.2% Oakland, CA 4.1% Seattle, WA 2.5% 73
74 Location Million TEU (2016) Shanghai, China Singapore Shenzhen, China Ningbo- Zhoushan, China Busan, South Korea Hong Kong, China Guangzhou Harbor, China Qingdao, China Dubai, UAE Tianjin, China
75 APL, AB InBev, Accenture, Keuhne + Nagel Hyundai Merchant Marine and Samsung SDS Startups: Blockshipping CargoX ShipChain 300Cubits 75
76 The sole distinction between public and private blockchain is related to who is allowed to participate in the network, execute the consensus protocol and maintain the shared ledger. A public blockchain network is completely open and anyone can join and participate in the network. A private blockchain network requires an invitation and must be validated by either the network starter or by a set of rules put in place by the network starter. This places restrictions on who is allowed to participate in the network, and only in certain transactions. The access control mechanism could vary: existing participants could decide future entrants; a regulatory authority could issue licenses for participation; or a consortium could make the decisions instead. 76
77 The value of freight moved is forecasted to increase faster than the weight, rising from $1,044 per ton in 2012 to $1,461 per ton in 2045, when controlling for inflation. This increase is due to high value, low-weight commodities growing at a faster rate than low-value, high-weight commodities. Exports at $1,772 per ton and imports at $1,941 per ton were higher than domestic shipments of $934 per ton in Exports and imports accounted for 11.8 percent of the tons and 21.1 percent of the value in 2012 and are projected to make up an even greater share of freight moving throughout the United States, reaching 17.5 percent of the tonnage and 39.3 percent of the value by