Measuring Freight Fluidity Performance Briefing on Work of DOC Advisory Committee on Supply Chain Competitiveness & FHWA/I-95 Pilot
|
|
|
- Elfreda May
- 5 years ago
- Views:
Transcription
1 Measuring Freight Fluidity Performance Briefing on Work of DOC Advisory Committee on Supply Chain Competitiveness & FHWA/I-95 Pilot ITTS Freight in the Southeast Conference Tampa, FL March, 2014 Joseph Bryan Parsons Brinckerhoff Transportation leadership you can trust.
2 Advisory Committee on Supply Chain Competitiveness Charge: to advise the Secretary of Commerce on the necessary elements of a comprehensive, holistic national freight infrastructure and a national freight policy designed to support U.S. export growth and competitiveness, foster national economic competitiveness, and improve U.S. supply chain competitiveness in the domestic and global economy. 40 members representing supply chain firms, associations, stakeholders, community organizations and academia Working group: BNSF, Menlo Logistics, Cambridge Systematics, Parsons Brinckerhoff, Dept. of Commerce Context: National Freight Strategic Plan and Conditions & Performance Report Canadian Fluidity Measures 2
3 Committee Adopted Recommendations Recommendation 1: In preparing the MAP-21 freight transportation conditions and performance report, the Secretary of Transportation must consider supply chain competitiveness. Recommendation 2: Supply chain competitiveness must address the end-to-end performance of the supply chain, from the shippers perspective. 3
4 Working Group Assignment What performance measures have the greatest value in assessing supply chain performance?» Most useful measures?» Data available to support the measures?» Cost to provide them?» Substitutes available? 4
5 Scope Address performance of supply chains» not performance of modes, networks, environmental impacts, etc., as such Address performance of public and quasi-public links and nodes» include ports, highways, rail lines, airports, etc., but not manufacturing, warehousing, distribution nodes Use measures that are common across supply chains and drill down Focus on high-level performance of representative supply chains to inform national policy 5» key industries, national coverage, major trade lanes, but do not duplicate firm-, carrier- and agency-level analysis
6 Approach 1. Define a common supply chain architecture» Links and nodes ( lanes and transfer points ) 2. Identify the supply chain links and nodes whose performance should be measured and tracked» Key pain points 3. Recommend performance measures and metrics 4. Suggest data sources for metrics 6
7 7 1. Common Supply Chain Architecture Key Links and Nodes

8 8 2. Supply Chain Pain Points Links and Nodes to be Measured
9 3. Performance Measures and Metrics Measure Metric Example Transit time Travel time in days 3.2 days Reliability Travel time reliability +/- 0.5 days Safety OSHA DART rate 4.1 Cost Dollars $2,250 Risk* Cargo loss and damage (accidents, poor handling, theft ) Disruption (storms, labor, political forces ) Capacity expansion delays (physical, regulatory limitations and delays ) 0.5% ** ** * Environmental and regulatory factors can influence all of the above ** Metrics of supply chain risk to be developed 9


10 Big Box Retail Supply Chain (highly simplified example) Links and Nodes to be Measured RR IMX Hub 10
11 Big Box Retail Supply Chain (highly simplified example) Supply Chain Performance (hypothetical data) Supply Chain Links and Nodes Transit Time/ Dwell Time (Days) Reliability Safety (OSHA DART Score) Transport Cost West Coast Port % 4.4 $000 Dray Move % 5.7 $000 Transload or Consolidation Center n/a n/a n/a n/a Dray Move % 5.7 $000 West Coast Rail Intermodal Terminal % 2.7 $000 Rail Move 3 15% 3.0 $000 Midwest Rail Intermodal Interchange % 2.9 $000 Rail Move 2 15% 3.0 $000 East Coast Rail Intermodal Terminal % 2.5 $000 Dray Move % 5.7 $000 East Coast Regional Distribution Center n/a n/a n/a n/a Truck P&D Move % 6.4 $000 Retail Store n/a n/a n/a n/a Totals Sum Weighted Value Weighted Value Sum 11
12 Big Box Retail Supply Chain Performance Trend (hypothetical data) 30.0 Transit/Dwell Time (Days)
13 Partial listing 4. Data Sources and Availability Mode Link or Node Performance Measure Metric Example Data Sources Data Availability Truck Line-Haul Move Transit time Transit time reliability Safety Cost Travel time in days Travel time variability DART rate Dollars 3.2 +/ $2,250 FHWA/ATRI, HERE, INRIX Calculated OSHA DART, FARS Industry Commercial Truck Pick-up and Delivery Move Transit time Transit time reliability Safety Cost Travel time in days Travel time variability DART rate Dollars 0.1 +/ $250 TTI data (INRIX-based) Calculated OSHA DART Industry Commercial US Border Road Crossing/Customs Clearance Dwell time Dwell time in days Dwell time variability Dwell time variability Safety DART rate Cost Dollars / $200 DHS, FHWA Calculated OSHA DART Industry Commercial or 3.2 +/ $1,000 RSI, Railinc, Transcore Calculated OSHA DART Freight BOL sources Commercial or TRUCK RAIL Rail Linehaul Transit time Transit time reliability Safety Cost 13 Travel time in days Travel time variability DART rate Dollars
14 Pilot Objectives Demonstrate though case studies the supply chain performance measurement approach outlined for the Advisory Committee on Supply Chain Competitiveness Vet the approach with multistate coalitions, states and MPOs Recommend methods and data sources for the measurement of freight transportation performance across multiple states Private end-to-end flows, public measures 14
15 Supply Chain Case Studies Retail Target consumer goods» From Ports of Los Angles/Long Beach to Chicago and NYC Food Perdue feed and processed chicken» From DelMarVa to Mid-Atlantic markets and ports Autos General Motors auto parts» From suppliers to auto assembly plant in Tennessee Agriculture Soybean exports» From Iowa farms through Louisiana ports Electronics Panasonic/Sony electronics» Between manufacturing and assembly facilities in San Diego and Mexico Status: Cases established, measures to come 15


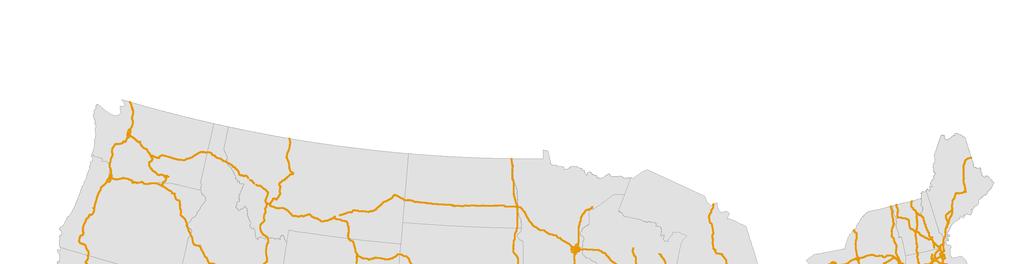
16 BIG BOX RETAIL SUPPLY CHAIN Rail Truck

")
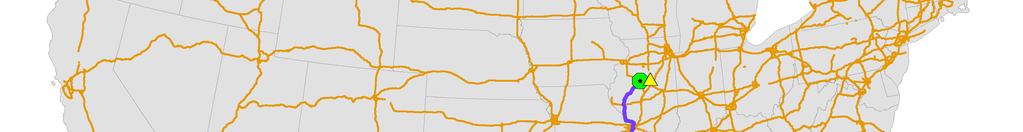
17 BIG BOX RETAIL SUPPLY CHAIN (detail) Rail Truck Dray
 (Trucks 1 and 2) Cincinnati Louisville Rail Truck")
18 CANADA AUTOMOTIVE SUPPLY CHAIN: Direct Truck (Truck 1) (2nd truck starts from different origin) (Trucks 1 and 2) Cincinnati Louisville Rail Truck
19 AUTOMOTIVE SUPPLY CHAIN: Direct Truck (detail) CANADA Truck 2 originates from U.S. supplier Truck 1 originates from Canadian supplier Rail Truck


20 AGRICULTURE SUPPLY CHAIN, SOYBEAN EXPORT Marine Terminal Grower Water Truck

21 AGRICULTURE SUPPLY CHAIN, SOYBEAN EXPORT Grower Truck originates from grower Marine Terminal Water Truck


22 Water Truck AGRICULTURE SUPPLY CHAIN, SOYBEAN EXPORT
23 Key Issues Representative market basket of supply chains Data availability, access and cost: national, nationwide Urban freight stages: transfers, deliveries, pick-ups Risk measure(s) Continuous or periodic or seasonal Definitions and time series consistency and private sector applications Conditions & Performance Report 23