RESULTS PRESENTATION. For the year ended 31 May August 2014
|
|
|
- Geraldine Small
- 5 years ago
- Views:
Transcription


1 RESULTS PRESENTATION For the year ended 31 May August 2014
2 Presentation overview Group overview and financial highlights Environment and industry trends Financial performance Prospects 2

3 GROUP OVERVIEW
4 Group overview Specialist logistics service provider Individual thinking, collective success 4

5 Group overview Specialised Logistics 5


6 Group overview Retail Other Logistics Services 6

7 Evolution of OneLogix 7
8 African Footprint 8
9 The OneLogix Way Well established niche logistics provider Footprint across South Africa and neighbouring countries Strong market position Customer service focused / good staff relations Cash generative Company structure (empowering, entrepreneurial) Structured to assimilate acquisitions Management capabilities Management shareholding 9
10 FINANCIAL HIGHLIGHTS
11 Financial highlights Revenue 25% to R1.3 bn Operating profit 44% to R132.9 m Core HEPS (cps) 30% to 33.3 HEPS (cps) 24% to 31.2 Net cash (generated from operating activities) 37% to R133.4 m Uninterrupted growth trajectory United Bulk and DriveRisk included for the full year Madison and new start-up OneLogix Linehaul contributed to earnings 11
12 Year under review Continued strong organic growth Strong customer retention / new customers gained Margin squeeze experienced Ability to successfully integrate companies (United Bulk, Madison and OneLogix Linehaul) Focus on Specialised Logistics segment Share buy back Izingwe Holdings (Pty) Ltd Andre Niemand acquisition 12
13 Year under review (cont) Looking to increase revenue from southern Africa Rail issue closely monitored Continued evaluation of acquisition opportunities Corporate actions Repurchase of shares Single biggest transaction in OneLogix history (Umlaas Road property) 13

14 Umlaas Road transaction Key: OneLogix vehicle storage hub Rust belt Umlaas Road 14 ha R130 million with financing in place Completion due first two weeks in December 2014 Will be used by VDS, CVDS, OneLogix Projex, OneLogix Linehaul and United Bulk Infrastructure bays, workshops, driver facilities, rail line and siding, 180,000l fuel tank storage PPP with Transnet possible with rail line and siding 14

15 Umlaas Road development 15
16 Ratios Ratio May 2014 May 2013 Return on equity (ROE) (%) Headline return on equity (%) Core headline return on equity (%) Gearing ratio (excl cash) (%) Interest cover (times)
17 Rm Segmental contribution from operations Revenue Specialised Logistics 31.9 Retail 88.8 Other (Logistics Services) Total 17

18 ENVIRONMENT AND INDUSTRY TRENDS
19 Units Units Car and truck sales Total Sales (Jan-Jul) Vehicle market contracting With exception of extraheavy duty trucks In line with expectations Extra Heavy Duty Vehicles (Jan-Jul) Source: NAAMSA 19
20 Africa Africa s time is now Government s are committed to end conflicts, invest in infrastructure and make finance for developing businesses and assets (such as vehicles) more accessible Mining, telecommunications, banking, retail and construction sectors are flourishing Rely on logistics Africa was the world s fastest-growing continent in 2013, at 5.6% GDP in Africa is expected to rise by an average of over 6% a year, World Bank expects GDP for sub-saharan African to increase more than 7% pa 20
21 Africa GDP (US$ bn) GDP Growth (y/y '10-'12) GDP Growth (y/y '12-'17) Angola % 5.7% DRC % 8.6% Kenya % 6.2% Mozambique % 8.0% Tanzania % 7.0% OneLogix footprint Nigeria % 6.8% Ghana % 5.9% Algeria % 3.6% Egypt % 3.4% South Africa % 3.0% Source: PWC Transport Report,
22 Africa Ford plans to launch 25 new vehicle model upgrades into Africa and the Middle East African market for new vehicle sales remains very small New vehicle sales - Africa Algeria, Egypt, Nigeria, SA Sub-Saharan Africa 22
23 Transnet update Permit issue resolved Inefficiencies persist (beneficial to OneLogix) Transnet set to invest R312bn over next seven years through their Market Demand Strategy Rapid loading facilities Additional rail links Standardise on four kinds of locomotives 1,400 new locomotives in next four years Aim to become one of world s top five railways by 2020 Committed to Public Private Partnerships 23
24 Durban harbour Durban harbour continues to be extremely congested R250bn expansion planned in line with NDP Port can accommodate 2.9m containers capacity will increase to more than 20m Ties in with Transnet focus to reduce road and increase rail transportation Aims to align South Africa's shipping logistics costs Currently at an average of 15.9% (India 6.7% and the USA 7.7%) Long-term project to
25 Units SME market Employers (SME s) Absa SME Index is at highest level in four years SBP s SME Growth Index Aggregate annual increase in turnover of SME s in 2013 was 13% 48% of SME s interviewed indicated that their staff numbers have remained constant in Source: ABSA SME Index Older firms have a greater propensity to take on new staff in larger numbers Red tape remains a concern with 71% of the panel indicating that it is becoming harder to do business Study finds firm growth is happening in spite of a difficult business climate 25
26 Logistics and transport Logistics costs (Rbn) E End-to-end integration of supply chain functions is next major shift Customer centric and competitive Enablers are key OneLogix is committed to PPP with Transnet Source: 10 th Annual State of Logistics Survey for South Africa,
27 Logistics and transport - Enablers Road infrastructure Rail infrastructure Port infrastructure Public Private Partnerships Pipeline infrastructure Airports 27
28 FINANCIAL PERFORMANCE
29 Income statement R m May 2014 May 2013 Change (%) Revenue Trading profit Trading profit margin Profit before taxation Profit for the year from continuing operations
30 Income statement (cont) (continuing operations) Revenue (Rm) Trading profit (Rm) and margin (%) st half 2 nd half 1 st half 2 nd half Margin 30
31 HEPS HEPS (cents) HEPS Core HEPS 31
32 Cash flow Operating profit Cash flows from operations 140 R m Cash flow Operating Profit
33 Cash utilisation No full year dividend declared Prudent cash management due to cash settlement to BEE partner and purchase of Umlaas Road property Cash conversion still remains attractive and at levels acceptable to management Capex Fleet Replacement Expansion Property Development IT Other Total R127.0m R38.7m R88.3m R1.1m R4.0m R4.9m R137.0m 33
34 Statement of financial position - assets R m May 2014 May 2013 Change (%) Non-current assets Property, plant and equipment Intangible assets Investment in associate Loans and receivables >100 Deferred taxation Current assets Inventories Trade and other receivables Taxation (85) Cash resources Total assets
35 Statement of financial position equity and liabilities R m May 2014 May 2013 Change (%) Total equity Interest bearing borrowings (non-current) Deferred tax Trade and other payables Interest-bearing borrowing (current) Vendor liability Non-controlling interest put option <100 Taxation (9) Bank overdrafts >100 Total equities and liabilities
36 Segmental breakdown Revenue Trading profit 2% 7% 9% 5% 91% 86% Specialised Logistics Retail Other Specialised Logistics Retail Other 36
37 R m % R m Specialised Logistics Constituents: Vehicle Delivery Services Commercial Vehicle Delivery Services OneLogix Projex Madison Onelogix Linehaul United Bulk OneLogix Projex Cargo Solutions Revenue Trading Profit % % 15.0% 13.0% 10.6% 11.2% 11.0% 9.0%
38 Logistics supply chain Strategic positioning Strive to strategically interact through the entire supply chain 1 2 Strategic Supply chain design and optimisation Opportunity 3 Tactical Advanced planning and scheduling Operational Execution VDS CVDS OLP Madison OLH UBulk OPCS 38
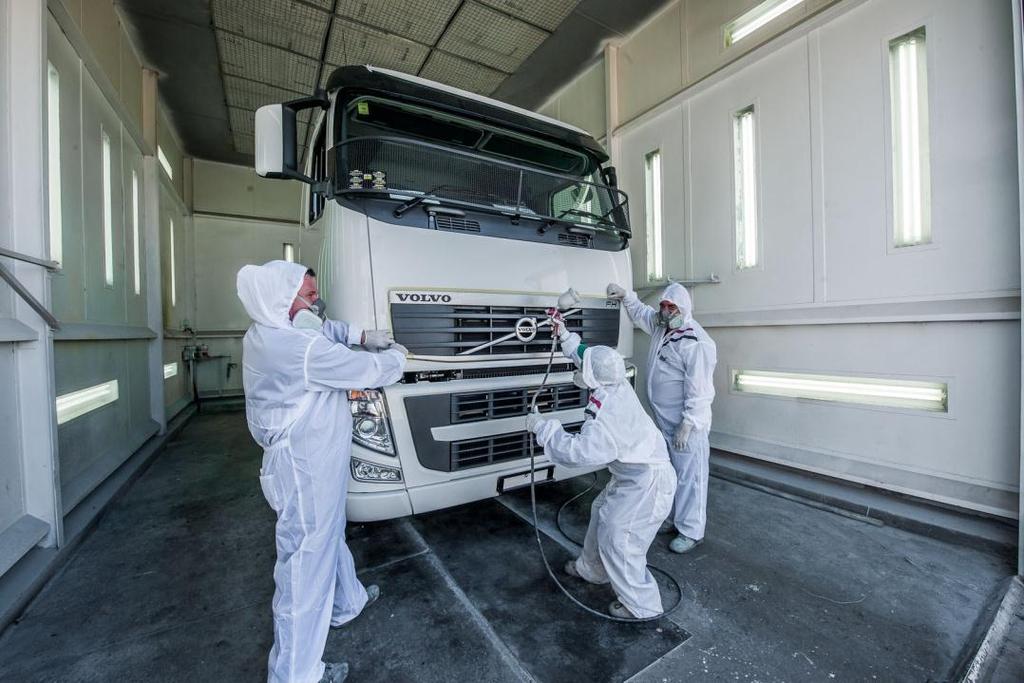
39 VDS 39

40 VDS - customers 40
41 VDS fleet information Age Number % of total Trucks 0 2 yrs yrs > 4 yrs Total Age Number % of total Trailers 3-4 car carriers car carriers car carriers car carriers Total

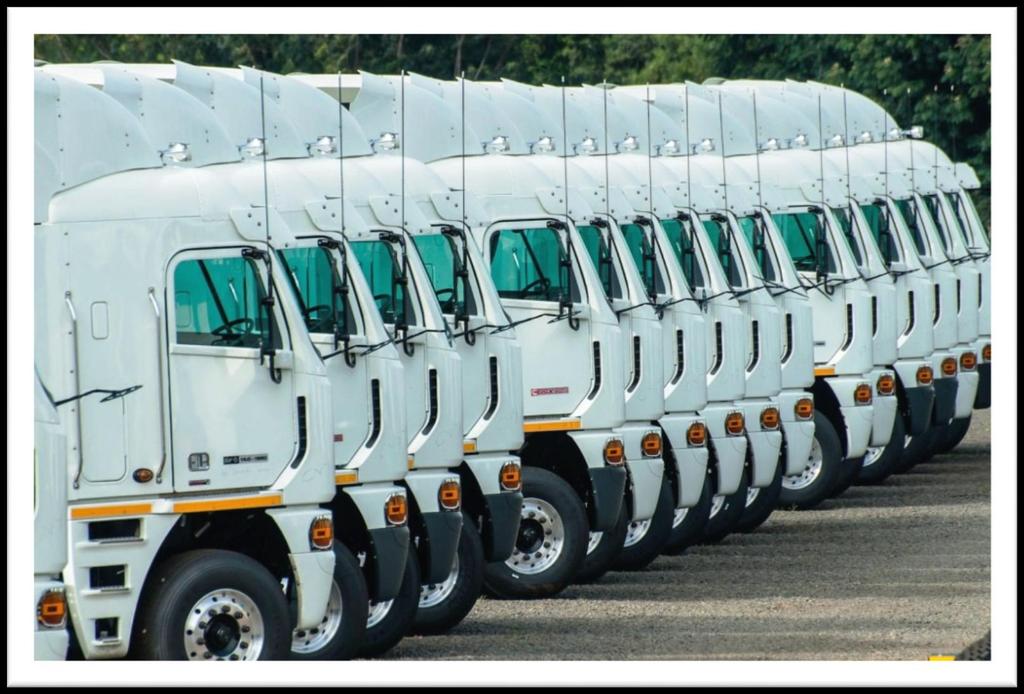
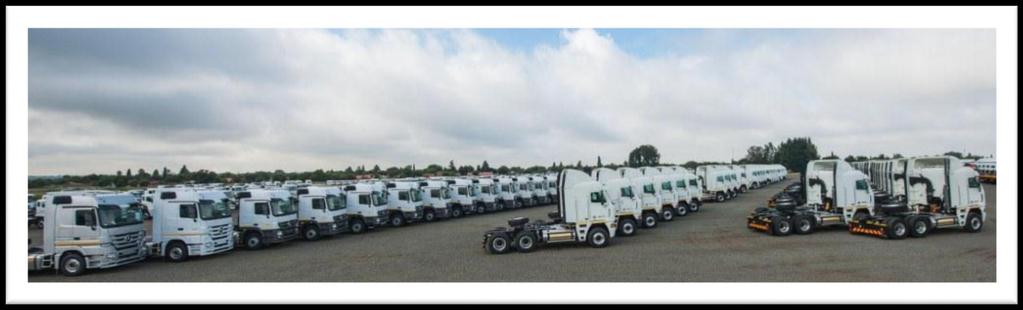
42 VDS Storage 42

43 VDS Storage 43
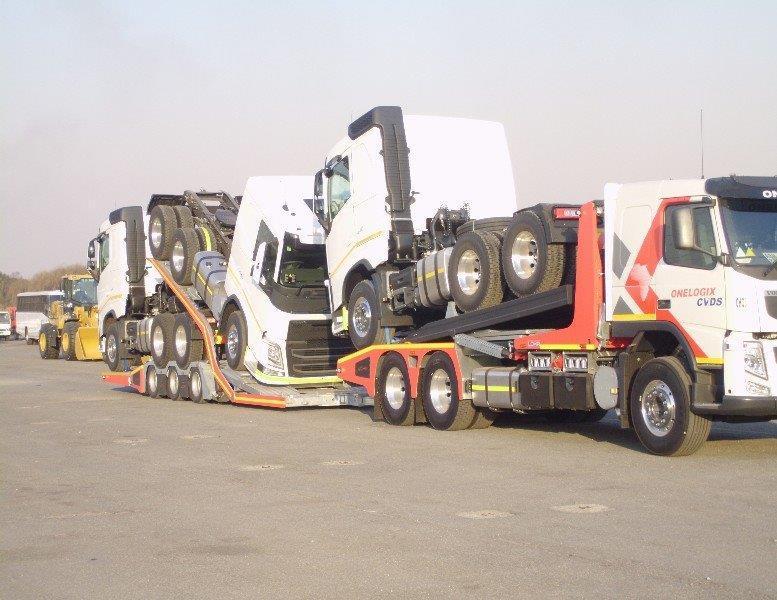
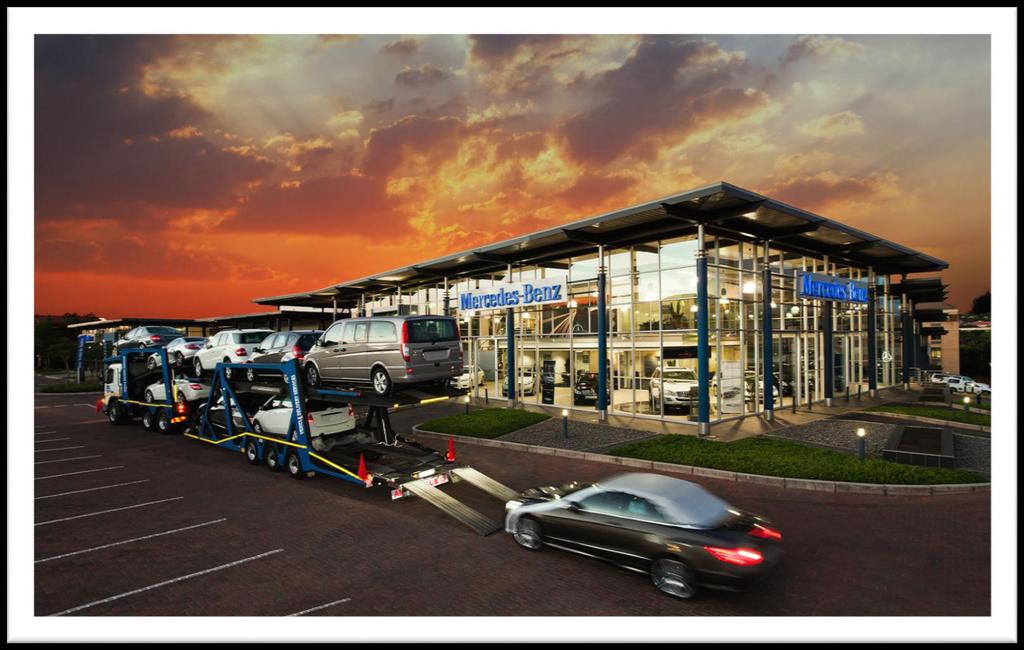
44 CVDS 44
45 CVDS 45

46 CVDS - customers 46

47 OneLogix Projex 47


48 OneLogix Projex - customers 48

49 OneLogix Projex - fleet Trailers 0 2 yrs 3 4 yrs > 4 yrs Extendable 5 Flatdeck 5 6 Lowbed 3 2 Skeltel 4 Stepdeck Superdeck 2 2 Superlink 4 Total Trucks No % 0-2 years years > 4 years Total

50 United Bulk 50
51 United Bulk fleet information Age Trucks % of total Tankers % of total 0 2 yrs yrs > 4 yrs Total

52 Madison 52
53 Madison fleet information Fleet < 4 yrs > 4 yrs Trucks * 1 32 * Four with winches; two with cranes Fleet - Trailers < 4 yrs > 4 yrs Lowbed 1 5 Semi with crane 0 1 Stepdecks 0 3 Triaxels 1 8 Superlinks 0 15 Rigid crane trucks 0 7 Extendables 0 3 Total

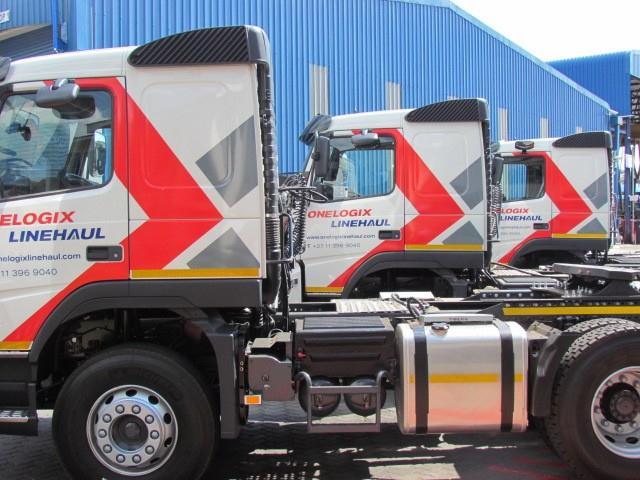
54 OneLogix Linehaul Transportation of general freight into southern Africa as well as intra southern African logistics 35 trucks plus 30 flat deck Inter-Links and 5 flat Triaxels 54


55 OneLogix Projex Cargo Solutions 55
56 R m % R m Retail Constituent PostNet Revenue Trading Profit 46.0% 44.8% 44.0% % 40.1% 40.0% 38.0% % 34.0%

57 PostNet 57
58 PostNet - customers 58
59 R m % R m Other Logistics Services Revenue Constituents: Atlas 360 Commercial Vehicle Services QSA DriveRisk (equity accounted) Trading Profit % % 8.5% 7.5% 6.3% 6.5% 5.5%

60 Atlas

61 Atlas customers 61


62 DriveRisk 62

63 DriveRisk 63
64 QSA 64
65 PROSPECTS
66 Prospects Continued organic growth Focus on regional growth (opportunity for all group companies) Continue to investigate acquisitions Risks Rail Margin squeeze Dependency on vehicle market Labour relations Normal operational risks 66
67 THANK YOU QUESTIONS & ANSWERS