Optimization-Based Simulation of Container Terminal. Productivity using Yard Truck Double Cycling. Essmeil Ahmed
|
|
|
- Myra Sherman
- 5 years ago
- Views:
Transcription
1 Optimization-Based Simulation of Container Terminal Productivity using Yard Truck Double Cycling Essmeil Ahmed A Thesis in The Department of Building, Civil and Environmental Engineering Presented in Partial Fulfillment of the Requirements for the Degree of Doctor of Philosophy (Building Engineering) at Concordia University Montreal, Quebec, Canada June 2015 Essmeil Ahmed, 2015
2 CONCORDIA UNIVERSITY SCHOOL OF GRADUATE STUDIES This is to certify that the thesis prepared By: Entitled: Essmeil Ali Ahmed Optimization-Based Simulation of Container Terminal Productivity using Yard Truck Double Cycling and submitted in partial fulfillment of the requirement for the degree of DOCTOR OF PHILOSOPHY (Building Engineering) Complies with the regulations of the University and meets with the accepted standards with respect to originality and quality. Signed by the final examining committee: Chair Dr. S. Bergler External Examiner Dr. Y. Mohamed External to Program Dr. A. Hammad Examiner Dr. O. Moselhi Examiner Dr. L. Amador Co-Supervisor Dr. T. Zayed Co-Supervisor Dr. S. Alkass Approved by Dr. F. Haghighat, Graduate Program Director June 3, 1015 Dr. C. Trueman, Dean Faculty of Engineering & Computer Science
3 ABSTRACT Optimization-Simulation of Container Terminal Productivity using Yard Truck Double Cycling Essmeil Ahmed, Ph.D. Concordia University, 2015 The growth of global trade transiting over the ocean has been continually increasing. A new generation of large vessels has recently been introduced to the transhipment system. These large vessels can carry more than twenty-foot equivalent container units (TEUs), maximizing shipping productivity. Container terminals must improve their productivity to meet the rapid increases in trade demand and to keep pace with developments in the shipbuilding industry. Reducing vessel turnaround time in container terminals increases the capacity for world trade. This time reduction can be achieved by improving one or more container terminal major resources or factors. The objective of this research is to maximize container terminal productivity by minimizing vessel turnaround time within reasonable hourly and unit costs. A new strategy is introduced, employing double cycling to reduce the empty travel of yard trucks. This double-cycling strategy still requires the use a single-cycle strategy before the trucks can be incorporated into doublecycle scheduling. The single-cycle start-up is necessary in order to create enough space to begin loading a vessel if there is no other space. The strategy is based on combining the efforts of two quay cranes (Unloading and Loading quay cranes) to work as a unit. The technique optimizes the number of trucks in terms of time and cost, minimizing yard truck cycles by minimizing single cycle routes and maximizing double iii
4 cycle trips. This requires five steps. First, a good knowledge base of a container terminal s operation and of the behaviours of the Quay cranes (QCs), Yard trucks, and Yard cranes needs to be constructed. Second, analysis of the collected data is required to simulate the container terminal operation and to implement the Genetic algorithm. Third, the double cycling truck strategy is simulated, tested and verified. Fourth, sensitivity analysis is performed to rank and select the best alternatives. Optimization of the selected alternatives in terms of productivity and cost as well as verifying the results using real case studies comprises the fifth step. Genetic Algorithm is used to optimize the results. Some selection approaches are implemented on the set of the nearest optimum solutions to rank and select the best alternative. The research offers immediate value by improving container terminal productivity using existing facilities and resources. Simulating the yard truck double cycling strategy provides container terminal mangers and decision makers with a clear overview of their handling container operations. Optimizing fleet size is a key factor in minimizing container handling costs and time. The simulation model reveals a productivity improvement of about 19% per QC. A reasonable cost savings in terms of the cost index in unit cost was achieved using yard truck double cycling operation. The genetic algorithm corroborates the achievements thus gained and determines the optimal fleet size that will result in the maximum terminal productivity (quickest vessel turnaround time) with the minimal cost. A time reduction of more than 26% was achieved in most cases, compared to previous research efforts. iv
5 ACKNOWLEDGEMENT First and foremost, I thank the Almighty God to grants me his tender and support on my way to achieve my goal so that I can receive my doctorate degree. Next, I pray for mercy to the spirit of my mother may Allah accept her with his merciful and forgiveness, and I grateful to my dear father Ali Ahmed for his moral and material support and for his prayers for me. I do not forget to thank my brother, Muhammad Ahmed and my nephew Mohy-Addin Ahmed who made impossible efforts to help me financially and morally. I would like to extend my thanks and gratitude to the administrators, Dr. Tarek Zayed and Dr. Sabah Alkass for their advice and guidance during my research. I want to express my sincere appreciation of the patience and kindness shown by supervisor Dr. Tarek Zayed in his heuristic professional ways to solve the research problems which did not end from the beginning of the research until the end. Dr. Tarek s guidelines were as a light that illuminated the way to reach the end of my research. I also wish to extend my thanks to the APM Terminals Tangier SA Port Tangier Med, Morocco especially, Hartmut Goeritz; Managing Director, Ms. Amal Eddouieb; Management Assistant and the professional engineers, Abdelaziz Izmoul; Continuous Improvement Leader and MastafaTouzani; Process improvement Manager, for all their efforts in expanding my knowledge and understanding of container ports and to obtain the necessary data to finalize my research. In advance, I never ever forget to thank and express my gratitude towards my faithful wife Nuria Baraik for her strength and her support for the duration of the study. She is the source of my strength and has had the patience to assume the pressures when I was busy during my study as she was the helpful wife to carry the burden of the house and take care of our four children. Finally, I dedicate this to my family, especially my parents and my children and all who wish me the good. v
6 TABLE OF CONTENTS LIST OF FIGURES... xi LIST OF TABLES... xv LIST OF ABBREVIATIONS... xviii CHAPTER 1: INTRODUCTION PROBLEM STATEMENT AND RESEARCH MOTIVATION OBJECTIVES SUMMARY OF THE DEVELOPED METHODOLOGY RESEARCH ORGANIZATION... 4 CHAPTER 2: LITERATURE REVIEW INTRODUCTION STORAGE YARD: STORAGE YARD SIZE: STORAGE YARD LAYOUT: YARD CRANE YARD TRUCKS BERTH SIDE BERTH ALLOCATION QUAY CRANES QUAY CRANE DOUBLE CYCLING vi
7 2.7 CONTAINER TERMINAL PROCESS SIMULATION: CONTAINER TERMINAL PRODUCTIVITY OPTIMIZATION GENETIC ALGORITHM GA IMPLEMENTATION STEPS SELECTION OF OPTIMUM SOLUTION AND RANKING ALTERNATIVES SELECTION APPROACHES LIMITATIONS OF EXISTING LITERATURE CHAPTER 3: RESEARCH METHODOLOGY CHAPTER OVERVIEW: FACTORS THAT AFFECT CONTAINER TERMINAL PRODUCTIVITY QUAY CRANE CYCLE TIMES: YARD CRANE CYCLE TIME YARD CRANE CYCLE TIME PROCEDURE IMPACT OF STORAGE YARD LAYOUT ON CONTAINER TERMINAL PRODUCTIVITY YARD TRUCK CYCLE TIME YARD TRUCK SINGLE CYCLE UNLOADING YARD TRUCK SINGLE CYCLE LOADING YARD TRUCK DOUBLE CYCLING YARD TRUCK CYCLE TIMES DERIVATION vii
8 3.6 SIMULATION OF CONTAINER TERMINAL OPERATION SINGLE CYCLE SIMULATION MODEL DOUBLE CYCLE SIMULATION MODEL MODELING AND OPTIMIZATION VESSEL TURNAROUND TIME MODELING OVERVIEW MODELING VESSEL TURNAROUND TIME USING THE SINGLE-CYCLING TECHNIQUE MODELING VESSEL TURNAROUND TIME USING THE DOUBLE CYCLING TECHNIQUE MODELING OF POSSIBLE DOUBLE CYCLING SCENARIOS OPTIMIZATION CHAPTER 4: DATA COLLECTION AND CASE STUDY OVERVIEW CASE STUDY DESCRIPTION CASE STUDY CYCLE TIME DATA COLLECTION QC CYCLE TIMES YC CYCLE TIMES YT CYCLE TIMES CASE STUDY RESOURCES PRODUCTIVITIES COST DATA COLLECTIONS SUMMARY viii
9 CHAPTER 5: MODELS IMPLEMENTATION AND VERIFICATION OVERVIEW SIMULATION MODEL IMPLEMENTATION SINGLE CYCLE SIMULATION INPUTS CASE OF STUDY SINGLE CYCLE OUTPUTS DOUBLE CYCLE SIMULATION INPUTS CASE STUDY OF DOUBLE CYCLING OUTPUTS SENSITIVITY ANALYSIS SENSITIVITY ANALYSIS RESULT CASE STUDY OPTIMIZATION MODEL IMPLEMENTATION OVERVIEW GA OPTIMIZATION GA VARIABLES AND PARAMETERS OBJECTIVE FUNCTIONS GA CONSTRAINTS CONFIGURATION OF GA USING GANETXL GA EXCEL SHEET LINKING GA RESULTS BEST ALTERNATIVE SELECTION PARETO FRONTIER TOPSIS ix
10 5.6.3 COST AND DECISION INDEX EZSTROBE SIMULATION TOOL ALTERNATIVE RANKING AND FINAL DECISION SELECTION GA USING STOCHASTIC PRODUCTIVITY VALUES GA VISUAL BASIC FOR APPLICATIONS VBA EXCEL CODING SUMMARY CHAPTER 6: BENEFITS, VERIFICATION AND CALIBRATION BENEFITS OF USING YT DOUBLE CYCLING STRATEGY MODEL VERIFICATION AND CALIBRATION COUNTING VESSEL TURNAROUND TIME EXAMPLE VESSEL TURNAROUND TIME VERIFICATION AND CALIBRATION SUMMARY CHAPTER 7: CONCLUSION AND FUTURE WORK SUMMARY CONCLUSION RESEARCH LIMITATIONS RESEARCH CONTRIBUTION RECOMMENDATION FOR FUTURE WORK x
11 REFERENCES APPENDIX A APPENDIX B APPENDIX C xi
12 LIST OF FIGURES FIGURE 1-1: CONTAINER VESSEL CAPACITY DEVELOPMENT (LANE ET AL. 2014)... 1 FIGURE 2-1: PROCESS OF UNLOADING AND LOADING A SHIP (VIS, 2003)... 8 FIGURE 2-2: ORIGINAL CT LAYOUT (CHIN, 2002) FIGURE 2-3: MODIFIED CT LAYOUT (CHIN, 2002) FIGURE 2-4: AN RTGC WITH WIDTH OF 7 LANES; 6 FOR CONTAINERS AND THE 7TH FIGURE 2-5: TRUCKS ARRIVE IN A QUEUE TO DISCHARGED OR LOADED BY QCS (LINN, 2003) FIGURE 2-6: (A) SINGLE CYCLE UNLOADING, (B) LOADING AND UNLOADING, DOUBLE CYCLING FIGURE 2-7: CHARACTERISTIC RIVER CONTAINER TERMINAL (PAP ET AL, 2011) FIGURE 2-8: ONE POINT CROSSOVER FIGURE 2-9: MULTI POINT CROSSOVER FIGURE 3-1: RESEARCH METHODOLOGY FIGURE 3-2: QC UNLOADING CYCLE TIME FIGURE 3-3: QC LOADING CYCLE FIGURE 3-4: QC POSSIBLE FORWARD AND BACKWARD TROLLEY MOVEMENTS FIGURE 3-5: ROW CONTAINER DISTRIBUTION ON THE VESSEL FIGURE 3-6: YC UNLOADING CYCLE FIGURE 3-7: YC LOADING CYCLE FLOW CHART FIGURE 3-8: YARD CRANE MOTIONS IN A STORAGE YARD FIGURE 3-9: STORAGE YARD STACKS FIGURE 3-10 POSSIBLE SY LAYOUTS FIGURE 3-11 YT SINGLE CYCLE UNLOADING FLOW CHART FIGURE 3-12 YT SINGLE CYCLE LOADING FLOW CHART FIGURE 3-13 YT DOUBLE CYCLING FLOW CHART FIGURE 3-14 YT SINGLE CYCLE UNLOADING JOURNEY FIGURE 3-15 YT SINGLE CYCLE LOADING JOURNEY FIGURE 3-16 YT DOUBLE CYCLE JOURNEY FIGURE 3-17 SINGLE AND DOUBLE CYCLING SIMULATION PROCEDURES FIGURE 3-18 SINGLE CYCLE SIMULATION STEPS APPLICATION FIGURE 3-19: SINGLE CYCLE SIMULATION MODEL FIGURE 3-20: SINGLE CYCLE SIMULATION PARAMETERS xii
13 FIGURE 3-21: DOUBLE CYCLING SIMULATION STEPS APPLICATION FIGURE 3-22: DOUBLE CYCLING SIMULATION MODEL FIGURE 3-23 DOUBLE CYCLE SIMULATION PARAMETERS FIGURE 3-24: SINGLE CYCLE CONTAINER HANDLING PROCEDURE FIGURE 3-25: SINGLE CYCLE CONTAINER HANDLING TIMELINE FIGURE 3-26: LOADING AND UNLOADING A VESSEL USING DOUBLE CYCLING FIGURE 3-27 DOUBLE CYCLING TIMELINE FIGURE 3-28 DOUBLE CYCLING TIMELINE WHERE THE NUMBER OF UNLOADED CONTAINERS > THE NUMBER OF LOADED CONTAINERS FIGURE 3-29 DOUBLE CYCLING TIMELINE WHERE THE NUMBER OF LOADED CONTAINERS > UNLOADED CONTAINERS, CASE FIGURE 3-30: DOUBLE CYCLING TIMELINE WHERE THE NUMBER OF UNLOADED CONTAINERS < THE NUMBER OF LOADED CONTAINERS, CASE FIGURE 4-1: CASE STUDY LOCATION ON THE STRAIT OF GIBRALTAR FIGURE 4-2: APM TERMINALS TANGIER TRAFFIC FLOW (APM TERMINALS TANGIER INDOOR DATA 2014) FIGURE 4-3: APM TERMINAL TANGIER LAYOUT (APM TERMINALS TANGIER INDOOR DATA 2014) FIGURE 4-4: QC EMPTY FORWARD MOVE TRAVEL STAGE FIGURE 4-5: QC LIFT CONTAINER FROM THE VESSEL STAGE FIGURE 4-6: QC UNLOADING PRODUCTIVITY HISTOGRAM FIGURE 4-7: QC LOADING PRODUCTIVITY PROBABILITY DENSITY FUNCTION HISTOGRAM FIGURE 5-1: SINGLE CYCLE SIMULATION MODEL IMPLEMENTATION FIGURE 5-2: SINGLE CYCLE SIMULATION PARAMETERS FIGURE 5-3: SINGLE CYCLE SIMULATION RESULTS FIGURE 5-4: DOUBLE CYCLING SIMULATION MODEL FIGURE 5-5: DOUBLE CYCLING SIMULATION PARAMETERS FIGURE 5-6: DOUBLE CYCLING SIMULATION RESULTS FIGURE 5-7: (A, B, C, AND D) SENSITIVITY ANALYSIS OUTPUT COMPARISONS FIGURE 5-8: GA CONFIGURATION (STEPS 1 AND 2) FIGURE 5-9: GA CONFIGURATION (STEPS 3 AND 4) FIGURE 5-10: GA CONFIGURATION, EXCEL SHEET LINKING FIGURE 5-11: GA CONFIGURATION, OPTIONS xiii
14 FIGURE 5-12: PARETO FRONTIER SAMPLE RESULTS (16000 TEUS VESSEL) FIGURE 5-13: PARETO FRONTIER SIMPLE RESULTS (12000 TEUS VESSEL) FIGURE 5-14: VBA OPTIMIZATION SCREEN SHOT FIGURE A- 1: QC LOADING DISCHARGE THE YT FIGURE A- 2: QC LOADING FORWARD LOADED MOVE FIGURE A- 3: QC LOADING LOAD THE CONTAINER ON VESSEL FIGURE A- 4: QC LOADING, EMPTY BACK MOVE FIGURE A- 5: QC LOADING PRODUCTIVITY FIGURE A- 6: QC DISCHARGING EMPTY FORWARD MOVE FIGURE A- 7: QC DISCHARGING LIFT CONTAINER FROM VESSEL FIGURE A- 8: QC DISCHARGING LOADED BACK MOVE FIGURE A- 9: QC DISCHARGING LOAD CONTAINER ON YT FIGURE A- 10: QC DISCHARGING PRODUCTIVITY FIGURE A- 11: QC DOUBLY CYCLE PRODUCTIVITY FIGURE A- 12: YC LOADING EMPTY FORWARD MOVE FIGURE A- 13: YC LOADING LIFT CONTAINER FROM SY FIGURE A- 14: YC LOADING LOADED BACK WARD MOVE FIGURE A- 15: YC LOADING LOAD THE CONTAINER ON THE YT FIGURE A- 16: YC LOADING PRODUCTIVITY FIGURE A- 17: YC DISCHARGING, LIFT CONTAINER FROM YT FIGURE A- 18: YC DISCHARGING, LOADED FORWARD MOVE FIGURE A- 19: YC DISCHARGING, LOAD THE CONTAINER ON SY FIGURE A- 20: YC DISCHARGING, EMPTY BACK WARD FIGURE A- 21: YC UNLOADING PRODUCTIVITY FIGURE A- 22: YC DOUBLE CYCLE PRODUCTIVITY FIGURE A- 23: YT UNLOADING, EMPTY MOVE FROM SY TO QC FIGURE A- 24: YT SINGLE CYCLE UNLOADING, LOADED MOVE FROM QC TO SY FIGURE A- 25: YT LOADING, LOADED MOVE FROM SY TO QC FIGURE A- 26: YT LOADING, EMPTY MOVE FROM QC TO SY FIGURE A- 27: YT DOUBLE CYCLE, LOADED MOVE FROM QC TO SY FIGURE A- 28: YT DOUBLE CYCLE, LOADED MOVE FROM SY TO QC FIGURE A- 29: YT SINGLE CYCLE, UNLOADING PRODUCTIVITY FIGURE A- 30: YT SINGLE CYCLE, LOADING PRODUCTIVITY FIGURE A-31: YT DOUBLE CYCLE PRODUCTIVITY xiv
15 LIST OF TABLES TABLE 4-1: CASE STUDY QC UNLOADING MOVES SAMPLE TABLE 4-2: CASE STUDY QC UNLOADING CYCLE TIME PROBABILITY DISTRIBUTION RESULTS TABLE 4-3: CASE STUDY QC LOADING MOVES SAMPLE TABLE 4-4: CASE STUDY QC LOADING CYCLE TIME PROBABILITY DISTRIBUTION RESULTS TABLE 4-5: CASE STUDY YC UNLOADING CYCLE TIME PROBABILITY DISTRIBUTION RESULTS TABLE 4-6: CASE STUDY YC LOADING CYCLE TIME PROBABILITY DISTRIBUTION RESULTS TABLE 4-8: CASE STUDY YT TRAVELS PROBABILITY DISTRIBUTION RESULTS TABLE 4-9: CASE STUDY OF QC SINGLE CYCLE UNLOADING PRODUCTIVITY AND DOUBLE CYCLING BASED ON TABLE 4-11: STATISTIC ANALYSIS OF RESOURCES PRODUCTIVITY RESULT SUMMARY TABLE 5-1: SENSITIVITY ANALYSIS COMPARISONS BETWEEN SINGLE AND DOUBLE CYCLING STRATEGIES TABLE 5-3: GA PARAMETERS TABLE 5-4: GA VARIABLES AND OBJECTIVES TABLE 5-5: 1600 TEU VESSEL GA RESULT SAMPLE ORDERED HIGHER PRODUCTIVITY FIRST (16000 TEUS VESSEL) TABLE 5-6: TEU VESSEL GA SET OF TWENTY BEST ALTERNATIVES SELECTED (16000 TEUS VESSEL) TABLE 5-7: TOPSIS FIRST SCENARIO RESULTS (16000 TEUS VESSEL) TABLE 5-8: TOPSIS SECOND SCENARIO RESULTS (16000 TEUS VESSEL) TABLE 5-9: COST INDEX RESULTS TABLE 5-10: EZSTROBE SIMULATION RESULTS (16000 TEUS VESSEL) TABLE 5-11: SELECTED APPROACHES: COMPARATIVE AND RANKING (FOR A TEU VESSEL) TABLE 5-12: GA BEST ALTERNATIVE SOLUTIONS ACCORDING TO QC AVAILABILITY AND DETERMINISTIC PRODUCTIVITY VALUES (16000 TEU VESSEL) TABLE 5-13: GA RESULTS USING STOCHASTIC PRODUCTIVITY VALUES FOR 6 QCS AVAILABILITY AND TEUS VESSEL CAPACITY TABLE 5-14: GA RESULT SAMPLE ORDERED HIGHER PRODUCTIVITY FIRST (12000 TEU VESSEL) TABLE 5-15: GA SET OF TWENTY BEST ALTERNATIVE SELECTED (12000 TEU VESSEL) xv
16 TABLE 5-16 : TOPSIS FIRST SCENARIO RESULTS (12000 TEU VESSEL) TABLE 5-17: TOPSIS SECOND SCENARIO RESULTS (12000 TEU VESSEL) TABLE 5-18: COST INDEX RESULTS (12000 TEU VESSEL) TABLE 5-19: EZSTROBE SIMULATION RESULTS (12000 TEU VESSEL) TABLE 5-20: SELECTING APPROACHES COMPARISON AND RANKING (12000 TEU VESSEL) TABLE 5-21: GA BEST ALTERNATIVE SOLUTIONS ACCORDING TO QCS AVAILABILITY AND DETERMINISTIC PRODUCTIVITY VALUES (12000 TEU VESSEL) TABLE 5-22: GA-DESIGNED PROBLEM USING VBA EXCEL SOFTWARE FOR 6 QCS AVAILABILITY AND TEUS VESSEL CAPACITY TABLE 5-23: GA SAMPLE RESULTS USING VBA EXCEL SOFTWARE FOR 6 QCS AVAILABILITY AND TEUS VESSEL CAPACITY TABLE 6-1: YT DOUBLE CYCLING IMPROVEMENTS COMPARED TO SINGLE CYCLING TABLE 6-2: COMPARISON OF QUAY CRANE PRODUCTIVITY (BARTOŠEK & MAREK, 2013) TABLE 6-3: VESSEL TURNAROUND TIME VS- LIFTS PER HOUR (JORDAN, 2002) TABLE 6-4: CALCULATED VESSEL TURNAROUND TIMES BASED ON BARTOŠEK 2013 AND JORDAN TABLE 6-5: MODEL VERIFICATION AND CALIBRATION (QC LIFTS LIMIT TO ITS UNLOADING LIFTS/HR) TABLE 6-6: MODEL VERIFICATION AND CALIBRATION (QC LIFTS LIMIT TO ITS LOADING LIFTS/HR) TABLE A- 1: YC DISCHARGING CYCLE AND PRODUCTIVITY TABLE A- 2: YC CYCLE TIMES AND PRODUCTIVITY TABLE A- 3: YT UNLOADING CYCLE TIME AND PRODUCTIVITY TABLE A- 4: YT LOADING CYCLE TIME AND PRODUCTIVITY TABLE A- 5: YT DOUBLE CYCLE, CYCLE TIMES AND PRODUCTIVITIES TABLE C- 1: TEU VESSEL GA SET OF TWENTY BEST ALTERNATIVES SELECTED (16000 TEUS VESSEL) TABLE C- 2: SET OF RANKED BEST 20 ALTERNATIVES MATRIX CRAITERIA TABLE C- 3: DECISION MATRIX NORMALIZATION TABLE C- 4: DIVIDE EACH COLUMN BY (SUMX^2)^ TABLE C-5: MULTIPLY EACH COLUMN BY WJ TO GET A* AND A` TABLE C- 6: DEFINE THE POS SEPARATION MEASURES FOR EACH ALTERNATIVE, S* TABLE C-7: DEFINE THE NOI SEPARATION MEASURES FOR EACH ALTERNATIVE, S` xvi
17 TABLE C- 8: CALCULATE THE RELATIVE CLOSENESS TO THE IDEAL SOLUTION CI* = S'I / (SI* +S'I ) AND RANK THE ALTERNATIVES, THE FARTHEST FROM THE NOS IS THE BEST xvii
18 LIST OF ABBREVIATIONS CT QC YC YT SY TEU AGV RTGC RMGC GA P/D BAP DBAP QCSNIP TOPSIS PIS NIS MODMP VBA Container Terminal Quay Crane Yard Crane Yard Truck Storage Yard Twenty-foot Equivalent container Unit Automated Guided Vehicle Rubber-Tired Gantry Crane Rail Mounted Gantry Crane Genetic Algorithm Pick-up and Delivery Berth Allocation Problem Dynamic Berth Allocation Problem Quay Crane Scheduling with the Non-Interference constrain Problem Technique of Order Preference by Similarity to Ideal Solution Positive Ideal Solution Negative Ideal Solution Multi Objective Decision- Making Problems Visual Basic for Applications code xviii

19 Chapter 1: Introduction 1.1 Problem Statement and Research Motivation Each container terminal is an important port facility linking international trade. Unexpected increases in demand for global trade require quick and efficient solutions. The annual average increases in container trade volume between 1990 and 2010 were not less than 8.2%, qualifying this type of trade as the fastest growing global sector (Carlo et al. 2014b). For example, in Shenzhen s port, container handlings had jumped 223 times in 2010 compared to its 18,000 TEU in 1990, reaching 4 million TEUs (Yap & Lam 2013). This growth has forced shipping and port companies to search for ways to keep up with this development. Among these alternatives, increasing container vessel capacity was one of the winning choices. Recent-generation container vessels now have a capacity for 18,000 TEUs rather than the 2,400 TEUs container vessels carried in the 1970s, and their capacity is expected to reach 24,000 in the future (see Figure 1-1) (Lane et al. 2014). Figure 1-1: Container vessel capacity development (Lane et al. 2014) 1
20 This situation means that container terminals must improve their capacity and raise productivity to keep up with these developments. Since the infrastructure for container port development requires a big timeframe and a large capital investment, it imperative to find adequate solutions to achieve optimum utilization of the available resources and possibilities. Minimizing vessel turnaround time (the time it takes for a vessel to be unloaded and loaded at its berth) accelerates shipping time and reduces delay in delivering trade goods. Improving the productivity of existing container terminals without introducing new major equipment and thereby expanding and/or developing the infrastructure of a facility is the primary objective of this research. Containers are delivered by vessels to container terminals. Quay cranes (QCs), which are huge and costly machines are used to unload and load containers from and onto sea-going vessels. Horizontal transporters, Yard trucks (YTs), automated guided vehicles (AGVs) and strudel carriers are used to transport containers between the berth and a storage yard (SY). Gantry cranes, both Rubber-Tired Gantry Cranes (RTGCs) and Rail Mounted Gantry Cranes (RMGCs), are yard cranes (YCs) that unload and load containers from and onto vehicles at a SY. A storage yard is an organized space divided into lanes and stakes where containers are stored temporarily before they are submitted to customers (shipping companies, railway or trucks). Any delays in the availability of one of these resources directly leads to a proportional delay for the other resources, and ultimately on the container terminal productivity in general. On the other hand, improving any of these resources will improve container terminal productivity. Traditionally, vessels are unloaded and then loaded (single cycle) at transhipment container terminals. Recently, a new technique has been proposed by Goodchild (2005), Quay Crane double cycling. The aim of that technique is to improve container terminal productivity by minimizing the empty travel of QCs. Goodchild s technique only produces a slight improvement 2
21 because it can only be applied to a single hatch. This research instead is focussed on implementing the double cycling of YTs based on the QC double cycling technique, thereby minimizing empty YT journeys. Some of the limitations of QC double cycling are to be solved over the course of this research. Because of its complexity, container terminal productivity is commonly tested by using simulation. The effectiveness of this developed strategy has been verified via a simulation model. An optimization of the results was produced and utilized to varify the developed strategy. This optimization aimed to optimize the handling containers YT fleet size to deliver best productivity in order to achieve the minimum vessel turnaround time associated with reasonable costs. 1.2 Objectives The overall objective of this research is to minimize vessel turnaround time and optimize container fleet size and hourly costs by implementing the yard truck double cycling technique to minimize empty truck journeys. Developing a simulation model is a part of this research and will test the technique. An optimization of the simulation outcome s group solutions is used as an input of the multi-objective Optimization model to optimize fleet size and the associated hourly costs. Several sub-objectives need to be achieved in order to satisfy the main objective: Identify and study the various factors that affect container terminal productivity; Build a productivity model to improve container terminal operation; and Optimize the fleet size that handles containers at a terminal. 1.3 Summary of the Developed Methodology The research methodology consists of seven phases, as follows: 3
22 1. A literature review to assess the research to date in the container terminal field to improve and maximize container terminal productivity, minimize vessel turnaround time, resolve QC allocation problems and promote QC, YC, YT and SY efficiency, as well as to present the state of the art in relevant simulation and optimization models; 2. Introduction of the new strategy of YT double cycling; 3. Formulation of improved vessel turnaround times, along with QC, YC and YT cycle times; 4. Building a simulation model of container handling operations; 5. Building an optimization model that can be implemented using an optimization tool to minimize vessel turnaround time and to optimize the fleet size for handling containers so as to meet the objective function of maximizing productivity and minimizing costs; 6. Data generation, including appropriate case studies to run, verify, and verify the developed simulation and optimization models; and 7. Summarising the conclusions, specific contributions and recommendations for future work. 1.4 Research Organization This research consists of seven chapters: chapter one is an introduction where the problem statement and research motivations are presented. Chapter two contains the literature review, including the latest work in the container terminal field. It describes the strategies, techniques, models and methodologies currently in use. Chapter three details the thesis methodology, and is where a simulation model for both single and double cycling of handling containers operations is developed. Optimization models then indicate how to apply the optimization using a Genetic Algorithm optimization tool. Data collection from both theoretical and real case studies that 4
23 produce the generated and estimated data that must be simulated in order to implement the optimization model is organised in chapter four. Chapter five contains the implementation of the simulation model, a sensitivity analysis and a genetic algorithm (GA) multi-objective optimization on both theoretical and real cases studies. Several approaches are utilised so that the near optimum solution can be found. Chapter six is where the developed strategy, simulation and optimization models are verified by comparing the results to previous published results, and finally, chapter seven summarizes the achievements, limitations and contributions of the research, and suggests future work. 5
24 Chapter 2: Literature Review 2.1 Introduction The trade volume through container terminals (CTs) has undergone rapid increases since its start in the late 1950s. Large transhipment container terminals now operate 24 hours a day with no stops, all year long, to meet the demand of the worldwide container trade. These operations employ a huge number of YTs, QCs and YCs and require very large SYs to satisfy container terminal customers. Not less than 100,000 containers are transferred weekly between berth side and temporary SYs (Petering and Murty, 2009). CTs need to improve their capacity to meet the increasing demands. Physically expanding existing CTs is not the only way to solve this problem, especially due to the high cost of expansion (and sometimes the physical limits) and time involved. Researchers have been investigating how CT performance can be developed using existing resources. SY, YCs, YTs and QCs are the most common elements of a CT s resources. Any improvement in one of those elements will affect the other elements productivity, as well as that of the CT operation overall. Scheduling problems have been a major focus of research efforts. Minimizing vessel berth time (turnaround time) is achieved in part by implementing the solutions developed by researchers and is reflected in the improvement of CT performance and accompanying customer satisfaction. Vis and De Koster, (2003) stated that the capacity of vessels will be increased by up to 8000 TEU (twenty-foot equivalent unit containers). Vessels today have been upgraded to carry more than TEUs as one way to minimize container cost shipment. Vessel turnaround time is thus increased by default. Large vessels are usually used to transfer containers through large container terminals to be transhipped by smaller vessels called feeders between medium or small 6
25 terminals. This process is called container transhipment. Because of the capital expenses and berthing affects, mega-ships need to be served as fast as possible with little or no delay upon arrival (Imai et al. 2013). This expansion has added more pressure on container terminal mangers to reduce vessel turnaround time and to expand berth lengths to accommodate larger vessels. To assess the effectiveness of container terminals, Vis et al, classified the planning and control functions into three levels: strategic, tactical and operational. For an overview of a transhipment container terminal, Figure 2-1 shows the container terminal process, a sequence that starts with the arrival of a vessel and ends with its departure (Vis and De Koster, 2003). Container terminals are classified into five areas; two are on the seaside (Bert and Quay crane), two on the landside (Storage yard and Gate), and the remaining area is the transportation, the connection between the two sides (Carlo, 2014a). Container terminal quay cranes (QCs) capture the researchers attention because of their high capital outlay and operational costs. Furthermore, new generations of QCs are able to make 40 moves per hour; the average number of movements per hour had been limited to around 25 (Murty, 2007; Petering and Murty, 2009). Accelerating QC capacity has been fuelled by the other CT elements increased efficiency. Double cycling is a recently-introduced technique to improve CT productivity. 2.2 Storage yard: Imported and exported containers are stored on the ground at SYs. A SY is a storage space where imported and exported containers are stored temporarily before being moved to their destination. SYs are divided into lanes, each lane is served by YCs that load and unload containers. Another type of machine, a strudel carrier, self-transports and loads or unloads containers from/to the ground. A storage yard s size, layout, its stacking levels and distance from the berth side are measures of its effectiveness. 7
26 Figure 2-1: Process of unloading and loading a ship (Vis et al. 2003) Storage yard size: There is no doubt that a larger SY provides more flexibility of movement and organization, resulting in a more effective CT. Nevertheless, unnecessary spaces will lead to extra direct and indirect costs. The optimization of SY size within the other CT elements is crucial. 8
27 2.2.2 Storage yard layout: SY layout includes container stacking, the lanes and the road network within the terminal. Effective storage yard layout can accommodate the accelerated flow of increasing container traffic. Yard layout problems have been evaluated in multiple studies. One conclusion is that, while YCs can stack containers above each other in stacks of up to seven, the optimal stacking height has been determined to be 5 levels (Duinkerken et al. 2001). Another aspect of SYs that was studied is their layout. Two possible layouts are traditionally designed to temporarily store containers before they are moved to their final destinations, known as SY layouts A and B. Layout A has containers stacked horizontally along the berth, while layout B has containers stacked vertically or perpendicular to the berth stacking yards, as illustrated in Figure 2-2. Simulations have shown that yard layout B is more effective than layout A in terms of QC moves per hour. As a part of their research, Liu et al. (2002) modified the original design of the SY shown in Figure 2-3 by adding Pick-up and Delivery (P/D) buffers on both the gate and the berth sides while keeping the gate buffer, as shown in Figure 2-3. Their simulation demonstrates that cost reduction was achieved with these additional buffers. Dividing an SY into small-size blocks of 6-level stacks can simplify the organization of export, import and empty containers. A similar problem was solved by Zhang et al. (2003). Their goal was to minimize the distance between the storage space and the vessel berth, and they formulated a mathematical model of the problem s planning horizon. Based on those results, Liu et al.(2004) developed a simulation model to evaluate the impact of layout on CT performance. Lee et al.(2007)worked at solving the yard space allocation problem in transhipment terminals by minimizing the traffic congestion caused by the exporting and importing trucks, using a CPLEX method to solve their model. It is not only YT congestion that needs to be solved; YC clashing can occur when more than one 9
28 crane work in the same lane. Murty (2007) studied both YT and YC problems. Murty improved the layout design with buffering to eliminate YT congestion and YC clashing. To solve for the effects of the length of storage blocks and of a system deploying a yard crane among blocks on long-term container terminal performance, Petering and Murty (2009) constructed a discrete event simulation model of terminal operation designed to reproduce a multi-objective, stochastic, real-time environment at a multiple-berth facility. Storage yard allocation problems are also common at container terminals. Assigning adequate storage yards for import, export and empty containers is very important before vessel arrival. It is more effective if the storage allocation is pre-defined so that the target vessel can be berthed at the optimum distance from the SY. Several research studies have been done on storage yard optimization. Some have introduced algorithms and others have proposed a heuristic or taboo search to achieve optimization. For instance; Bazzazi et al. (2009) solved the problem of yard space allocation using efficient Genetic algorithm optimization. Bazzazi verified the proposed algorithm by means of numerical examples which showed the feasible solutions of yard space allocation. 2.3 Yard Crane A yard crane is a crane that loads and unloads containers from or onto trucks going to or from the storage yard stacks. A YC is designed to move horizontally along the storage lanes, and its trolley moves perpendicular to the lane. They are designed to reach up to 7 stacks of containers from the ground level. Two types of YCs are traditionally used; the Rubber-Tired Gantry (RTGCS) and the Rail-Mounted Gantry (RMCs). RTGCs move on rubber tires and can make 360-degree turns, while RMGCs move along the blocks of a single row on a fixed rail. RTGCs crane can move from one block to another even if they are not in the same row. 10


29 Figure 2-2: Original CT layout (Chin, 2002) Figure 2-3: Modified CT layout (Chin, 2002) The RTG has a width of 7 lanes, which are each equivalent to the container width; 6 lanes are used to store the containers and the 7 th lane is customisable for the yard trucks (Linn et al. 2003). Figure 2-4is a photo that shows the width of an RTG and the lane distribution at a storage block. Other types of equipment are also used, but not as widely, for example, forklift and straddle 11
 Petering")
30 carriers. YCs can make 25 moves per hour. This amount of movements is about the half of a QC s productivity. If the QC works at its highest productivity level, its YC will most likely be overloaded Figure 2-4: An RTGC with width of 7 lanes; 6 for containers and the 7th for the trucks (Linn, 2003) Petering and Murty (2006) stated that the only way to avoid YC overloading is to choose a good storage location for containers immediately upon arrival at the terminal. Petering et al, proposed a simulation analysis model of algorithms to solve YC scheduling problems. Researchers have introduced another maxim to keep the QC working at its upper capacity: each QC should be serviced by two or more YCs (Murty, 2007). Murty suggested a policy of YC operation that operates all YCs in a zone as a shared pool of YCs. The author believes this will reduce the YC/QC ratio to less than Yard trucks Yard trucks (YTs) as a category include strudel carriers, truck vehicles and automated guided vehicles (AGVs). YTs transport containers between berth- or QC-side and the SY. Strudel 12
31 carriers can load containers (2 twenty-foot or one forty-foot) from the ground at quay side, transport them and then self-stack or have their container unloaded by a YC at the SY stacks. Truck vehicles are operated by drivers and are unloaded and loaded by QCs and YCs, while AGVs are automatically operated and controlled. Even though strudel carriers can eliminate the need for YCs, they are still costly because of their slow motion and high energy consumption, especially when loading or unloading containers, since the cycle times are longer when they are included in the loading and unloading cycle. Strudel carriers are generally used at CTs where hourly manpower costs are high compared to the hourly costs of strudel carriers. These costs and longer cycles can be eliminated when using YTs or AGVs. In most locations, there is no requirement for CT operators to own a large YT fleet, as they can be hired when needed. In contrast, strudel carriers work exclusively at container terminals. AGVs have certain advantages, such as in terms of environmental/air quality issues, since they are electrical machines, and because no drivers are needed as they are guided electronically, but they are not yet widely used because of their unique infrastructure and initial capital cost. Another disadvantage of AGVs is that a limited number of vehicles can be operated at one time at a terminal. Duinkerken et al. (2001) integrated a simulation model of quay transport and stacking polices at Automated Container terminals. They conclude that there is no improvement accrued when more than 42 AGVs serve at one time. Guenther et al. (2005) introduced having AGVs online and off-line, dispatching then in a simulation study to evaluate the dispatching performance. They discovered that the performance suffered when the system sent notice of a deadlock occurrence. They decided to develop a comprehensive plan to address the dilemmas that occur in the operation of the AGV system. Homayouni (2011) proposed a simulation annealing algorithm (SA) with the goal of optimizing an Integrated Scheduling of QCs and AGVs. Their model is 13
32 structured to minimize the journeys of AGVs and thereby reduce the make span, or the time required to finish their tasks. This minimization obtained a feasible QC cycle time reduction. Their result indicates that the SA can solve the problem accurately and precisely using a reasonable amount of CPU time. Wang et. al (2015) proposed a hybrid GA to solve the YT Scheduling and storage allocation. The aim of their research is to minimize the delay of YTs in total summation weighted. Their methodology based on how to schedule The YTs fleet to load or discharge the containers in the meanwhile of discharged container storage allocation. Chordeau et. al. (2015) introduced a simulation-based Optimization for the container housekeeping at transhipment container terminals. The Containers housekeeping saves YT cycle times and eliminates the YTs congestion. Chordeau et. al. research objectives includes minimizing YTs travel times. A feasible improvement range has been achieved by implementing their tabu search procedure. 2.5 Berth side The berth side is the most attractive element for researchers - because it has a direct relation to the customers (vessels), it is the most expensive structure in a port facility, and it is the location of the most important piece of equipment, the QC. The berth allocation problem (BAP), QC cycling and berth scheduling continually draw the attention of researchers. The overall objective is to minimize vessel dwell time and to maximize the QCs productivity Berth Allocation Berth allocation is important as it assigns the optimal location of each vessel before a vessel has arrived. Many factors have to be considered to allocate a vessel to a berth, including: (1) Vessel length; 14
33 (2) Berth length; (3) Expected vessel arrival time; (4) Expected vessel unloading and loading time; (5) Expected vessel departure time; (6) The number of containers to be unloaded and loaded; (7) The location of the storage yard for the containers to be unloaded and loaded; and (8) The number of QCs to be assigned for the vessel. Berth allocation is a pivotal decision that can minimize vessel turnaround time and handling container costs. The optimum location should be compatible with the availability of resources, shorter YT cycles and the berth length. The preceding and the succeeding vessels assigned to the same location should also be considered. Static and dynamic berth allocation problems form the basis of berth scheduling algorithms. The dynamic allocation problem is more complex than the static one because of the dynamic changes before and after berthing. Arrival vessel delay, delays in the handling of other vessels containers at the berth and weather changes are some examples of dynamic changes. Chen, et al. (2008) and Petering et al. (2009) developed a genetic heuristicbased algorithm to solve dynamic berth allocation problems (DBAP) with limited QCs at container terminals. Similarly, Liang et al. (2009) introduced a formulation for berth and quay crane scheduling problems that combine genetic and heuristic algorithms to minimize the handling, waiting and delay times for every ship. Another solution can be found in algorithms to optimize the berth allocation within QC on-time scheduling, proposed by Lee et al. (2008) and Imai et al. (2008). They extend the optimization to a heuristic to produce an approximate solution to the problem. Even though the results of those optimizations are somewhat complex, the authors concur that it is important to solve the QC 15
34 scheduling and berth allocation problem on time. Similar solutions to berth and quay crane scheduling problems have been modeled by Aykagan (2008). One of the best references is the survey of berth allocation and QC scheduling problems introduced by Bierwirth and Meisel (2010). Their survey encompasses a good comprehension of several situations and cases of QC scheduling and vessel arrivals, including dynamic and static scheduling Quay cranes QCs load and unload containers into and from vessels. A QC is the most expensive component for handling containers at container terminals. A QC discharges containers from a vessel and loads them onto trucks or to the ground for access by strudel carriers and it discharges containers from trucks or from the ground to load them into vessels. Trucks arrive at berth side in a queue to be loaded or discharged by the QCs, see Figure 2-5. A QC can lift two 20-foot containers or one 40-foot container. In other words, it can lift two TEUs at a time. It is designed to make 40 movements an hour on average. Vessel turnaround times is measured by the summation of the total QC moving times for unloading and loading a vessel; see the equation below: (Equation 2.1) For the above reasons and because of its high capital and operational costs, the QC is considered to be a bottleneck of container terminal operations (Moccia et al. 2006). The QC schedule should be planned before a vessel s arrival to ensure the minimum vessel turnaround time and avoid any delays in handling containers. A QC moves along the berth on a railway. It moves from one row to another in the same way. Vessels have been upgraded to carry 22 rows along their length. Each row can be occupied by 20 stacks and each stack can take containers, one atop the 16
 It has been proven that a vessel can be serviced by more than one QC to minimize the vessel turnaround time")
35 other. In large vessels, stacks are divided into two hatches, above and below the vessel deck to ensure stability. where: Figure 2-5: Trucks arrive in a queue to be discharged or loaded by QCs (Linn, 2003) It has been proven that a vessel can be serviced by more than one QC to minimize the vessel turnaround time (Daganzo, 1989). Each QC should serve its own truck fleet to avoid conflicts and to keep the QC busy continuously. There is an exception to this condition at automated container terminals. At automated terminals, the online ATGV s dispatching is based on the principle of first come, first serve (Daganzo 1989). The number of QCs assigned to a vessel depends on the vessel length, the berth location and the safety policy of how much distance 17
36 should be allocated between each QC. The number of QCs also depends on a container terminal s handling equipment availability and its internal road capacity. The more trucks that move within the same time, the more likely it is that traffic congestion could arise, which would cause delays in the truck cycle time. When more than one QC is assigned to a vessel, solving the quay crane scheduling with the non-interference constraint problem (QCSNIP) algorithm should be considered. Managers usually divide a vessel into bays, and each bay is assigned its own QC. QC scheduling problems should be examined before deciding how many QCs should be assigned. Daganzo (1989) examined the static and dynamic quay crane scheduling problem with the assumption of dividing a vessel into holds. Each hold can be serviced with only one crane at a time, and the crane can move freely between holds with the condition that the vessel never departs until all the work in its holds has been finished. An efficient algorithm for solving QC scheduling problems was developed to solve QC scheduling and assignment to vessels (Tavakkoli-Moghaddam et al. 2009). When using multiple QCs to service one vessel, the turnaround time is equal to the maximum time one of the QCs must spend to unload and load its assigned hold. The following equation explains how to calculate the turnaround time using multiple QCs: m x. (Equation 2.2) where: are the numbers of containers per row of the assigned hold to be unloaded; g, d, z are the number of containers per row per assigned holds to be loaded;. are the number of rows per assigned hold to be unloaded are the number of rows per assigned hold to be loaded; are the unloading times for multiple QCs; 18
37 are the loading times for multiple QCs; and 1, 2,...n are the number of holds per vessel. To assign more than two quay cranes to a single vessel to work separately on two holds at the same time, some factors have to be taken in consideration. For instance: 1- QCs cannot conflict with each other, as they use the same railway; 2- The QCs at the middle holds must stay there until the vessel has been completely loaded; and 3- QCs should be allocated at an appropriate and safe distance from each other to avoid conflict, forced stops and accidents. Optimizing the QC schedule problem is necessary in order to keep the middle-hold QCs continuously occupied until the work has been completed. QC scheduling and berth allocation problems are usually coincident to each other. The number of QCs assigned to a vessel controls the vessel berth location. Container terminals with limited QCs must focus on QC scheduling, and often have to choose the more flexible vessel berthing location to allow QCs to move freely as soon as any QC finishes its assigned work on a vessel s hold (Park & Kim 2003). Lee and Wang (2010) proposed an algorithm for QC scheduling to assign handling priority to solve this problem. A tabu search algorithm was developed by Sammarra et al. (2007) to optimize QC scheduling and minimize vessel turnaround time. Goodchild (2005) and Goodchild and Daganzo(2005) introduced a new technique to optimize QC productivity and minimize vessel dwell time. This technique is called QC double cycling. Goodchild and Daganzo improved their work to cover the impaction of QC double cycling (Goodchild and Daganzo, 2006; 2007). Zhang and Kim (2009) expanded QC double cycling to implement not only under hatch, but so 19
38 that it works over hatch eventually. The QC double cycling and the authors work have been explained widely in the next section. 2.6 Quay crane double cycling Before delving into the double cycling technique, it is worthwhile to review single cycling. Traditionally, single cycling is the most commonly-used technique in most container terminals. Before the introduction of double cycling, the only way to unload containers was the single cycling technique. Single cycling means that the imported containers from a vessel must be unloaded first, and then the exported containers can be loaded. In contrast, double cycling means that the loading and unloading of containers is carried out at the same time, under the unloading conditions. QC double cycling is a technique that can be used to improve the efficiency of quay cranes by eliminating some empty crane moves Goodchild, (2005). Goodchild shows the difference between the single cycle and double cycle techniques. A scheduling problem that can be solved by double cycling is presumed by Goodchild and Deganzo (2005). (a) Single (b) Double Unload containers Return without container Unload containers Load containers Figure 2-6: (a) Single cycle unloading, (b) loading and unloading, double cycling (Goodchild 2005) 20
39 With the aim of reducing the turnaround time of a group of vessels, they proposed a simple formula and algorithm of quay crane double cycling. The formula was then optimally solved by using Johnson's rule. They further extended their analysis to hatched vessels. A 20% reduction of total QC cycles and an operation time reduction of 10% were achieved by using double cycling. Goodchild and Deganzo (2007) suggested additional planning and modification of the CT operation strategy to optimize it with the double cycling technique. Their suggestion also includes SY utilization. Thanks to their research, terminal planners can benefit from a clear preview of the resource and management requirements when implementing the double cycling technique. Zhang and Kim (2009) extended Goodchild and Deganzo s (2005) research so that it would no longer be limited to the stacks under a hatch, but would also work for above-hatch stacks. Based on the most common arrangement, where a hatch usually covers three stacks under it, the authors suggest a strategy to work above hatches. Their approach is to unload the first three stacks above a hatch, then remove the hatch and unload the first stack under the hatch in single cycle, and then return to double cycling. At the end of a row, the QC backs up to load the remaining stacks under the hatch, re-installs the hatch and loads the three stacks above the hatch in single-cycle mode. A heuristic algorithm to apply this strategy has been formulated and tested. Even though Zhang and Kim have eliminated the limitations of working above a hatch, other limitations have not yet been resolved. In general, the results show that the approach has a good potential to be applied successfully. To reduce empty YT trips, Nguyen and Kim (2010) introduced a heuristic algorithm and tested it via simulation for various scenarios with different QC operation types (single cycle, double cycling and a combination of two QCs -- one loading and the other unloading) in different locations. One of their conclusions is that YT efficiency is affected by the QC operation type. 21
40 Pap et al. (2011) support the advantages of the double cycling technique as a service method for improving container terminal productivity. They enhanced the conception that double cycling is a cost reduction method which does not require any improvement of existing infrastructure or introduce new technology. The authors optimized the QC double cycling in both sea and river container terminals. They state that using QC double cycling is more efficient in river terminals than it is in sea terminals. They attributed this difference to the fact that the only handling machine in a river terminal is the QC (see Figure 2-7). This supports the conclusion that QC performance is influenced by the performance of other container terminal elements. A greedy randomised adaptive search procedure was introduced to solve scheduling problems considering QC double cycling by Meisel & Wichmann (2010); they re-positioned the reshuffled containers on the bay rather than unloading them to accelerate the vessel turnaround time. Zhang et. al (2015) suggested a mixed of two programming integrated model of QC and YC. The model does not cover the YT scheduling and allocation. The integrated model of QC and YC double cycling model concludes as it is easy implemented approach and efficient method of handling containers. 2.7 Container terminal process simulation: Container terminal operation analysis is a complex process. These complexity forces container terminal decision makers to be forward-looking and to search for support tools to help them continually optimize container terminal operation. Simulation modeling is one of the tools that are widely used to solve container terminal operation problems, including the operation starting from the arrival of a vessel and ending with the land handling of the containers or the reloading and departure of said vessel. 22

41 Figure 2-7: Characteristic river container terminal (Pap et al, 2011) Nam et al. (2002) proposed a simulation model to solve the berth allocation and Quay crane scheduling problem. This problem is based on berth length shortage and QC limitations. They consider a berth as being divided into four berths, each operated by an individual company and each company owning 3 QCs. The number of QCs assigned to a vessel depends on the vessel size. The authors suggest four scenarios to solve the problem:(1) each company operates individually, (2) each two neighbouring companies share their QCs, (3) three companies share their QCs and the fourth one works individually, and (4) the four companies share their QCs as one owner. The idea is that if a QC is idle, it is more beneficial to use it even if that involves hiring or borrowing. As a result, the authors conclude that The more berths per operator, the higher the productivity achieved (Nam et al. 2002). They also show that optimal use of the available resources can improve performance by up to 25%. Since the aim is to increase container terminal productivity, CT operation simulation is similar to that of any other operation, such as in construction and manufacturing. Lee et al. (2003) used the ARENA version 4 to simulate the logistics of a container port supply chain. As a result of their simulation they stated The deeper the partnership between the ship operator and the terminal operator, the shorter 23
42 time will be taken for container handling and strategy. The more information the operator has the more vessels that can be handled efficiently (Lee et al. 2003).This statement points to the use of some of the simulation models designed for construction work, such as Micro cyclone or EZStrobe. Another example of a simulation model for the planning stage to examine container terminal productivity is proposed by Beškovnik and Twrdy, (2010). Their simulation contains six parts. They recommend using a simulation model to determine container terminal research solutions to provide feasible solutions and a sensible overview, even if it is a simple one. Beškovnik and Twrdy agree that most of the simulations to date have focused on the sea- or river-side areas that contain the berths and the QCs, while fewer studies have focussed on the other areas such as SYs, YTs and YCs, even though container terminal productivity is influenced by all of those areas. The developed simulation will compensate for the lack of YT simulation to date. This approach adds a YT double cycling strategy to improve container terminal productivity (Ahmed et al. 2014a). The YT double cycling strategy needs to be tested and evaluated. A simulation of the strategy will indicate its efficiency and a sensitivity analysis were employed to optimize the number of YTs when using YT double cycling (Ahmed et al. 2014b). 2.8 Container terminal productivity optimization Optimizing container terminal productivity using only existing resources is very attractive to container terminal operators. Researchers are continually working to optimize terminal productivity in different terminal areas and in accordance with different factors. Some of these are mentioned in the previous sections of this chapter and others will be discussed later. For example, optimizing the stack levels at a storage yard has been addressed and the optimum stack level determined to be five stacks (Duinkerken et al. 2001). Vessel turnaround time can be 24
43 optimized by minimizing container handling and vessel waiting time. A multi-objective optimization to solve scheduling problem is introduced by (Cheong et al. 2010). The optimal number of AGVs working at one time has also been determined, with the conclusion that more than 24 vehicles are not beneficial to work at the same time(duinkerken et al. 2001). Homayouni (2011) optimized an integrated scheduling of QCs and AGVs. Other resource optimizations such as berth allocation and QC scheduling have also been presented. Since the optimization of fleet size to maximize productivity and minimize costs is a part of this research, the optimization literature that will be deeply extended in this future work is the work on delays. 2.9 Genetic algorithm The use of genetic algorithms (GA) is a method developed by John Holland in GA mimics the biological process of natural selection. To produce optimal solutions, GA generates better solutions by developing improved new generations (children).the parents with the best characteristics (genes) are the ones used to produce each successive generation. This operation continues for a pre-determined number of generations or until further improvement is no longer possible, resulting in winning solution GA implementation steps (Haupt et al. 2004) ordered the GA implementation steps as follows: 1- Initialise or generate the first population; 2- Evaluate the fitness function; 3- If the fitness function is satisfied, go to step 8; 4- Select the new parents; 5- Crossover; 25
44 6- Mutate; 7- Back to step 2; 8- Select the best solution (winner); Brief clarifications of the previous steps are given below: 1- Initialisation is the processes of generating the initial or the first population, also called the parents. Each parent is a set of solutions (chromosomes) which are used in selection, crossover and mutation. A good definition of population size can optimize the time the algorithm will need to run. Put another way, a higher population size takes more time to finish the algorithm and find the solution, but it must be large enough to achieve the desired solution and satisfy the fitness function. 2- The fitness function is also known as the objective function. A fitness function is the function by which the desired solution (optimum solution) will be achieved. 3- Crossover is the mixing of two parents chromosomes to generate a new generation. Normally, the operation shares the better chromosomes between two parents to generate a better solution, but that does not mean a worse solution will not be generated occasionally. In general, there are three types of crossover. a- One point crossover. In this type of crossover a child will keep the genes of parent A before the point of cross between parents A and B, and the genes of parent B after the point of cross. The other child will do the same but with the opposite genes of parents A and B, see Figure
45 Parent A Genotype Parent B Genotype Crossover Child A Genotype Child B Genotype Figure 2-8: One point crossover b- Multiple point crossover. The same procedure is followed as in one point crossover, but with more than one cross over point. Figure 2-9 shows an example of multiple point crossover in detail. Parent A Genotype Parent B Genotype Child A Genotype Child B Genotype Figure 2-9: Multi point crossover c- Uniform random crossover. This type of the crossover is ultimate case of multi point crossover. The parent genes get distributed uniformly and randomly in child A and child B; this step acts as a redistribution of the gene positions in the chromosome. 4- Mutation is the process of considering unexplored genes in the population. It is used to avoid the selection of non-optimum solutions. Based on the user s desire for using the mutation step, the rate of the mutation can be specified. A higher rate of mutation leads to 27
46 a higher number of mutated chromosomes, which is not recommended, as one wants to avoid the devolution of an optimization search to a random search Selection of optimum solution and ranking In single-objective optimization, there is only one solution to be selected and so no conflict can be countered. On the other hand, with multiple-objective optimization (more than one objective function), two or more solutions could be ranked as near-optimum solutions. For instance, if we have two objective functions (to maximise productivity and minimize costs), one solution might satisfy the maximum productivity and the other one the minimum cost. In this case or in similar ones, a ranking tool is needed to help the decision makers select the optimum solution. Many approaches can be used to solve this problem; four methods are used in the present research Alternatives selection approaches 1- Pareto frontier approach 2- Technique of Order Preference by Similarity to Ideal Solution (TOPSIS) 3- Cost index and decision index approach 4- Simulate the best ranked solutions using EZStrobe simulation a- Pareto front approach The Pareto front approach helps the operator or decision makers to evaluate the set of solutions in terms of their multi-objective criteria. b- TOPSIS TOPSIS is used to select the solution that is geometrically nearest to the best solution and farthest from the worst solution. First developed by Hwang et al. (1993), TOPSIS 28
47 takes into consideration all the criteria of each alternative. The principle of TOPSIS is to select the alternative that has the shortest distance from the positive ideal solution (PIS) and the farthest distance from the negative ideal solution (NIS), which is equivalent to minimising the distance from the PSI and maximizing the distance from the NIS (Hwang et al. 1993). This means that an alternative that has one or more negative ideal criterion could be selected as a winner according to the other nearest criteria to the ideal solution. This method compares the alternatives by identifying the weights of the criteria according to the priorities set by the decision makers and normalizes these standards to identify the best solutions with the shortest geometrical distance from the best solution. This approach is widely used in multiobjective decision making problems (MODMP) to solve conflicts in alternative selection. For instance, Roshandel et al. (2013) used hierarchical fuzzy TOPSIS in evaluating and selecting the suppliers in the detergent production industry, Yong (2006) optimized plant location selection based on fuzzy TOPSIS, Zhang and Qi (2012)induced interval-valued intuitionistic fuzzy hybrid aggregation operators with TOPSIS order-inducing variables, Katalinic (2011) prioritized the selection of AS/RSS by using a fuzzy TOPSIS method, and Iason (2014) used TOPSIS to assess subway network performance. TOPSIS principle concept The principle of TOPSIS is to select the variable that leads to the farthest from negative optimal solution (NOS) and is the nearest to the positive optimal solution (POS). These alternatives must be evaluated with respect to the values of the criteria. The procedure for implementing TOPSIS is as follows: 29
48 1- Assume we have multiple solutions or alternatives (m) and that these alternatives have different criteria (n). 2- Make a matrix (m*n) of Z= (Zij) where i represents the alternatives and j represents the criteria. 3- Assume represents the set of positive criteria, where a higher value is better, and represents the negative criteria, where a lower value is better. 4- Define decision matrix R= rij by normalizing Z where rij = zij/ ( z 2 ij for i m nd j n 5- Assume weight associated by each criterion; wj for criteria j 6- Multiply the columns in the decision matrix by their associated wjvalues; 7- The new matrix elements are yij= wj * rij 8- The PIS is then A a = {y1 a, yn a }, where: yj a is {max (yij) if j ; min (yij) if j 9- The NOS is then A b = {y1 b, yn b }, Where yj b is {min (yij) if j ; max (yij) if j 10- Define the POI and the NOI separation measures for each alternative, where: Si a is the separation measures from POI, Si a yij- yij a ) 2 ] 1/2 ; Si b is the separation measures from PNI, Si b yij- yij b ) 2 ] 1/2 11- The last step is to find Ci a = [Si b /( Si b +Si a )] The largest value of Ci a is thus the best option to be selected where 0 < Ci a < 1. c- Cost index and decision index The cost index approach developed by Zayed & Halpin (2001) supports the conclusion in multiple-objective solutions; the minimum cost alternative is not usually the best solution. The authors suggest evaluating the other alternatives in the ideal solution zone. They propose an approach that divides the cost by the productivity of each alternative, as they are the two objectives in their case, called the cost index. The lowest cost index is the best solution alternative. To identify the decision index, they went further to be more specific by dividing the cost index of 30
49 each alternative by the cost index corresponding to the lowest alternative cost. This make the decision index of the lowest cost alternative equal to one, as it is dividing by itself. The other decision indexes will vary more and/or less than one. The lowest decision index will reflect the best solution alternative Limitations of Existing Literature According to the literature review, to keep pace with the rapid growth of the container trade without resorting to the expansion of existing terminals, optimal solutions for raising the productivity of container terminal elements must be found. Any improvement measures for any element of the operation chain result in an improvement of the other elements and of the terminal efficiency as a whole. Reducing vessel berthing time and realizing operation cost savings using the available resources are the main concerns of researchers in CT efficiency. These limitations will be addressed and container terminal productivity improved by introducing this new strategy and by applying double cycling only in yard trucks. The limitations of the literature are defined and summarised as follows: Despite the many research efforts that have been done to solve the problem of handling containers delays and increasing the productivity or minimizing vessels turnaround times, there is still a delay in container handling operations and the lack of access to productive best to cover this deficit. In literature, fewer studies have focussed on the other areas such as SYs, YTs and YCs comparing to berth side and QCs which precisely improves the container terminal productivity and effect on the QC productivity. The quay crane double cycling technique proposed recently by Goodchild (2005) is a new technique to improve terminal efficiency, and it has been proven theoretically. 31
50 However, some technical deficiencies and limitations can affect the efficacy of this technique. 1- The technique may be not being effective if the loading and unloading container lanes are far apart. 2- For vessels with deck hatches, applying quay crane double cycling is not useful for the containers above a hatch, as all the containers above a hatch must be unloaded before applying double cycling. 3- In each row, one or more stacks need to be unloaded in single-cycle mode, as well as ending with single cycling, which may confuse the QC and YT operators and reduce the fluctuation of the learning frequency for repetitive work. In addition, double cycling requires more trucks than single cycling because of its longer cycle, which means that some yard trucks are not utilized during the use of single cycling in each row. 4- For each cycle, the YT has to wait for the QC to be loaded before it departs, as the discharge time is considered to be a time lost. 5- This technique works with 100% efficiency when a vessel does not have hatch decks, but for those that have a hatch deck, the single-cycle technique must be applied to unload and load the containers above the hatch. 6- Even though Zhang and Kim (2009) solved the above-hatch problem with a modified use of single and double cycling, still other limitations remain to be solved. 32
51 Chapter 3: Research Methodology 3.1 Chapter Overview: This research is composed of three main phases as detailed in Figure 3-1. Each phase is divided into its sub-phases according to the priority order. The first phase addresses the understanding of container terminals, and starts with a comprehensive literature review organized and detailed as in the previous chapter. This phase includes a state of the art review of yard crane scheduling, container transporting between storage yard and berth, temporary container storage yards, quay crane and berth allocation problems and quay crane double cycling. This phase also focuses on the factors that affect container terminal operation in terms of productivity and costs. The second phase is the simulation phase. It starts with the collection of the data needed to run the simulation, followed by simulation modeling of both single and double cycling, simulation implementation and sensitivity analysis. The last phase is called the optimization phase. It consist of time and cost modeling to optimize the fleet size so as to select the best combination of maximum productivity and minimum cost. The chapter ends with a conclusion and recommendation based on the results from the previous phases. The methodology is based on introducing a new strategy of container handling, called the YT double cycling technique. The new strategy depends on being able to combine two QCs to work as a single unit with one crane discharging the vessel while the other loads it. Both QCs will serve the same truck; unloading a container from the truck to be loaded into the vessel and loading it with the discharged container from the vessel. Each truck will transport containers from the storage yard to the vessel and from the vessel to the storage yard in the same cycle. Just as with the QCs, two YCs will load and discharge the trucks at the storage yard. 33
52 QCs must be located more than two rows of forty feet apart. In the interest of safety and to prevent conflicts, the QCs in this system will be three rows of forty feet apart. The yard cranes will be allocated according to the layout of the storage yard. They could be in the same lane, in two neighboring lanes or even further apart. Shorter distances produce better results. Before implementing the new strategy, some factors that affect container terminal productivity must be addressed: the particular qualities of the QCs, YCs, YTs and SYs. The first three factors are machines that are considered as a fleet for handling containers, while the fourth is the yard where the containers are stored temporarily before or after shipping. These factors are will be investigated and formulated in the next chapter. An EZStrobe simulation will be used to simulate the operation in order to calculate the cycle time, the productivity rate and the hourly cost of container handling. 3.2 Factors that affect container terminal productivity Quay crane cycle times: Quay crane cycle times procedure: The quay crane cycle time starts from the movement of the trolley (empty or loaded) from the truck lane to the (discharged or loaded) container position in the bay indicated in (Figure 3-2 and Figure 3-3). The trolley makes different forward and backward moves. The trolley s vertical speed is purposely different between its loaded and empty movements. In addition, in some locations, the operators resort to combining horizontal and vertical movements at the same time, in what are known as diagonal movements. To assess diagonal movement, the longest time of the two is the one recorded. For more details about movement, see Figure
53 Container transport between berth and storage yard Storage yard layout and Yard crane scheduling Literature review Berth allocation and quay crane problems Quay crane Double cycling Yard truck movements Yard truck movements formulation Storage yard Organizatio Storage yard layout and levelling Phase I: Understanding container terminal Factors effect container terminal productivity Quay crane movements formulation Yard Crane movement formulation Quay crane movements Yard crane movements Yard truck cycle time and hourly cost Data Collection Quay crane cycle time and hourly cost Overhead hourly cost Simulation modeling Yard crane cycle time and hourly cost Phase II: Simulation Model validation Phase III: Optimization Time modeling Container terminal modeling Cost Modeling Container terminal productivity optimization Conclusion and future work Figure 3-1: Research Methodology 35
54 start Empty vertical up and horizontal forward movement from the truck lane to the bay Empty horizontal movement to the target container on the vessel Empty vertical down and adjust to lift the container from the vessel Lift the container Above the hatch? No Loaded vertical up movement to pass the hatch Yes Loaded vertical up and horizontal backward movement toward the truck lane Horizontal loaded backward movement toward the truck lane Is the truck available? NO Wait for the truck Yes Loaded vertical down and horizontal back ward movement to adjust the container on the truck Load the container on the truck Figure 3-2: QC unloading cycle time 36
55 start Lift the container from the truck Loaded vertical up and horizontal forward movement toward the bay Loaded horizontal forward movement toard the bay Vertical down and horizontal forward movement to load adjust the container on the vessel Load the container on the vessel NO Above the hatch? Empty vertical up movement to pass the hatch Yes Empty vertical up and horizontal backward movement toward the truck lane Horizontal empty backward movement toward the truck lane Is the truck available NO Wait for the truck Yes Empty vertical down and horizontal backward movement to lift the container from the truck Figure 3-3: QC loading cycle 37
56 When discharging containers, the trolley starts empty, moving forward up vertically and horizontally at the same time (diagonally) in order to save time. Next, it moves horizontally to be close to the container location. The trolley again makes a diagonal movement, downward to be able to lift the container. If the container is above the hatch, lifting the container is the next step. If not, the trolley will move the container vertically down and then lift the container. After lifting the container, loaded backward moves will be applied. The same steps of moving forward, but in the opposite direction, begin from where the bay ends to the truck lane. If the truck is available, the QC will load the container on the truck. If it is not available, the QC will wait until a truck arrives. This delay will add to the cycle time and be counted as a late time. To load the vessel, the trolley makes the same moves, only replacing the empty with loaded and the loaded with empty moves. Figure 3-4: QC possible forward and backward trolley movements 38
57 The handling time varies from one container to another depending on its position in the cell of the row matrix. Because of the large number of containers, and neglecting the difference in time between neighboring stacks, the horizontal distribution of 40-ft containers (2TEUs) are divided into segments of two containers (4 TEUs) to simplify the calculations. Figure 3-5, shows the segment distribution. 8f16f 4ft 8ft 8 ft 8.6 ft 8.6 ft 8.6ft 2.78ft Figure 3-5: row container distribution on the vessel Quay crane unloading cycle time formulation Let represent the QC unloaded cycle time, and considering that all distances are in feet and times are in minutes, where: = Quay crane cycle time= [ forw rd im wh n mp y +t lift + kw rd im wh n lo d d ]+ t load +. ]. (Equation 3.1) 39
58 ]+ ]+ +t5+( + l, (Equation 3.2) where: = Time to make an up-forward diagonal movement, in minutes; = ]. (Equation 3.3) = Time to pass a horizontal distance forward along the vessel width; =. (Equation 3.4) = Time to make a downward diagonal movement; = ]. (Equation 3.5) = Time to make a vertical movement under the hatch; =. (Equation 3.6) Time (in minutes) to lift a container from the vessel; = Time (in minutes) to make an upward vertical movement to pass the hatch; =. (Equation 3.7) = Time to make an upwards backward diagonal movement; = ]. (Equation 3.8) = Time to pass a horizontal distance backward along the vessel width; =. (Equation 3.9) = Time to make a downwards backward diagonal movement; and = ]. (Equation 3.10) The time required to load the container on the truck. Parameter definitions: isthe time that the QC has to wait for the truck; isthe vertical upward distance from the top of the container on the truck to the maximum height distance the trolley can reach, in ft; 40
59 is the horizontal distance from the truck lane to the closest side of the bay; is the horizontal distance from the lane closest to the bay to the target container, before applying diagonal movement; The lower bound of 8 ft is the width of the first lane, which is assigned for emergency vehicles; b Represents the horizontal distance from the truck lanes to the edge of the bay (vessel wall on the lane side); is the horizontal movement that will occur when using empty downward diagonal movement; is vertical downward distance from the maximum height distance the trolley can reach in the hatch; is vertical downward distance from the hatch to the top of the lowest container; and represents the vessel width. The trolley s speeds are designated as follows: Maximum horizontal speed =240 m/min= ft/min; Vertical speed when empty = 170 m/min= ft/min; and Vertical speed when loaded = 70 m/min= ft/min. The variables v1 v3 for the trolley speeds can thus be expressed as: The trolley horizontal speed in ft/min so that The trolley vertical speed when it is empty, ; and The trolley vertical down speed when it is loaded, Quay crane loading cycle time formulation The same moves for unloading apply to loading, except that the empty moves are replaced by loaded ones, and vice versa. Let represent the QC unloaded cycle time, where: = Quay crane cycle time =[ forw rd im wh n lo d d + kw rd im wh n mp y ]+. ]. (Equation 3.11) 41
60 = { ]+ ]+ +t5 +( + ]+ + ])+t10 + }. (Equation 3.12) represents the time to lift the container from the truck and the time to load the container on the vessel, respectively. 3.3 Yard crane cycle time Yard crane cycle time procedure As with the quay crane, the yard crane cycle time starts from the movement of the trolley (empty or loaded) from the truck lane to the (discharged or loaded) container position in the pre-assigned storage yard (see Figure 3-6 and Figure 3-7). The trolley makes the same set of forward and backward moves. YC trolleys also have different vertical speeds when they are loaded than when empty. As with QCs, diagonal movements are applied to save time. For more movement details see Figure 3-8. Almost all of the QC s forward and backward movement procedures can be implemented by YCs (except those for the hatch, as storage yards do not have hatches). The truck delay will lead to YC delay time. This delay is added to the cycle time and counted as late time Yard crane unloading cycle time derivation Let represent the QC unloaded cycle time, where: = Quay crane cycle time= [ forw rd im wh n lo d d + kw rd im wh n mp y ] +.. (Equation 3.13) = { ]+ ]) +( ]+ + ]) + }. (Equation 3.14) Note: all times are in minutes, distances are in feet and speeds are in min/ft. 42
61 Start Lift the container from the truck Vertical up and forward move from the truck lane to the assigned space. Horizontal forward move to the target storage space Loaded vertical down movement to discharge the container Discharge the container on the stack Empty vertical up and horizontal movement Empty horizontal backward movement from the storage space to the truck lane NO Is the truck available Wait for the truck Vertical down and horizontal movement and adjust to lift the container from the truck Figure 3-6: YC unloading cycle 43
62 Start Empty vertical up and forward horizontal movement from the truck lane to storage space Horizontal forward move to the target container on the space Empty vertical downward movement to discharge the container Lift the container from the stack Loaded vertical upward and horizontal movement Loaded horizontal backward movement from the storage space to the truck lane Is the truck available No Wait for the truck Yes Loaded vertical downward and horizontal backward to adjust the container on the truck Load the container on the truck Figure 3-7: YC Loading cycle flow chart 44
63 L R X S H P h Figure 3-8: Yard crane motions in a storage yard = the time to lift a container from a truck = the time to make an upward forward diagonal movement. = ]. (Equation 3.15) = the time to pass the horizontal distance forward along the vessel width. =. (Equation 3.16) = the time to make the downward diagonal movement. = ]. (Equation 3.17) = the time to unload the container in the stack. = the time to make an upwards backward diagonal movement. = ]. (Equation 3.18) 45
64 = the time to pass the horizontal distance backwards along the vessel width. =. (Equation 3.19) = the time to make a downwards-backward diagonal movement. = ]. (Equation 3.20) = the time that the YC must wait for the truck. -- is the vertical upward distance from the top of the container on the truck to the maximum height distance the trolley can reach, in ft; -- is the horizontal distance from the truck lane to the closest side of the container stacks; - the horizontal distance from the side of the container stacks closest to the target container before applying diagonal movement, in ft; the horizontal distance using loaded downwards diagonal movement; and the vertical downwards distance from the maximum height the trolley can reach to the top of the lowest container, in ft. The trolley s speeds are designed to be as follows: Horizontal speed = 70 m/min= ft/min; Vertical speed when loaded = 20 m/min= ft/min; and Vertical speed when empty = 40 m/min= ft/min. Thus, the trolley s speed ranges can be expressed as: -- is the trolley s horizontal speed in ; is the trolley s vertical speed when loaded ; and -- is the trolley s vertical downward speed when empty. 46
65 Yard crane loading cycle time formulation For loading a vessel, the same moves will apply, but the empty moves will be replaced by loaded ones, and vice versa. Let represent the YC unloaded cycle time, where: = YC crane cycle time = [ forw rd im wh n mp y + kw rd im wh n lo d d ]+. (Equation 3.21). (Equation 3.22) = { ] + ] +t5) + ] + + ] +t1) + }. (Equation 3.23) 3.4 Impact of storage yard layout on container terminal productivity At the storage yard, the containers are loaded in stacks of five containers with more than five stacks per row, as shown in Figure 3-9. The number of rows varies, depending on the size and layout of the storage yard. The yard crane cycle time is directly influenced by the SY size and layout. A well-designed and organized layout results in effective and efficient YC productivity. Different layouts for import and export storage yards are commonly used, according to each storage yard s area, berth length and the location of the land gates. Some of the most commonly used layouts are side-by-side, back-to-front, column-by-column, row-by-row and diamond. These layouts are represented in Figure ft 4` 8ft 2.78ft Figure 3-9: Storage yard stacks 47
66 (a) Side by side layout (b) front back layout (C) Column by column layout (d) row by row layout (e) Diamond layout Figure 3-10 Possible SY layouts 3.5 Yard truck cycle time Yard truck single cycle unloading YT single-cycle unloading starts with a YT moving from the truck pool or storage yard to the berth side. At the truck lane on the berth side, the truck will be loaded by the QC if it is ready. Otherwise, the truck waits for the QC to be ready. After being loaded, the YT returns to the storage yard to a pre-assigned lane, where a YC discharges the truck when it is available. A waiting time will be added if the YC is not ready. The YT will repeat the process until the last imported container is fully unloaded from the vessel. A specific number of YTs is needed to do the job in order to keep the cranes busy. Figure 3-11 shows the detailed movement and actions of yard truck single-cycle unloading. 48
67 3.5.2 Yard truck single cycle loading Yard truck single cycle loading starts at the same place as YT single cycle unloading, in the storage yard. The only difference is that the YT has to be loaded with the exported container before it departs the storage yard. A YC loads the container on the truck. The loaded YT then moves to the berth side to be discharged by the QC when it is ready. Just as with YT single cycle unloading, if the QC is not ready, a late time will be added to the cycle time. After being unloaded by the QC, YT will move back empty to the storage yard. At the SY, the YC should be ready to reload the truck. If it is not ready, a late time will be added to the cycle time. Figure 3-12 represents the detailed moves and actions. A reasonable number of trucks should be assigned to assure that the cranes are kept busy Yard truck double cycling In double cycling, the first YC starts the cycle by loading the YT. The loaded YT then moves to the berth side to be discharged by the first QC. After discharging, the YT moves empty to the second QC to be loaded. Next, it returns to the storage yard to unload the container at an import lane. The second YC should be ready to discharge the truck, which then departs empty to the export lane to be loaded by the first YC, thus starting a new cycle. Any delay or waiting time for a crane will be added to the cycle time as late time. A fleet of YTs will continue the work until reverting back to single cycle loading to load the remaining containers. For more details, see Figure Yard truck cycle times derivation The YT cycle time varies, as it is dependent upon the storage yard distance from the berth and the berth allocation, the maximum speed policy, the external road conditions, the YT operator s skills, and especially, the storage yard layout. 49
68 Start Empty truck travel from storage yard to the berth side Is QC available No Wait for the QC Yes Load the container on the truck Loaded truck travel from the berth side to the storage yard Is the YC available NO Wait for the YC Yes Discharge the container from the truck Figure 3-11 YT single cycle unloading flow chart 50
69 Start Load the truck at export storage yard Loaded truck travel from storage yard to the berth side No Is QC available Wait for the QC Yes Discharge the truck Yes Empty truck travel from the berth side to the storage yard Is the YC available No Wait for the YC Figure 3-12 YT single cycle loading flow chart 51
70 Start Load the truck at export storage yard Loaded truck travel from storage yard to the berth side Is QC1 available NO Wait for QC1 Yes Discharge the truck Empty truck travel from QC1 to QC2 Is QC2 Available NO Wait for QC2 Yes Yes Load the truck Loaded truck travel from QC2 to YC2 Is YC2 available NO Wait for YC2 Yes Empty truck travel from YC2 to YC1 Is YC1 available NO Wait for YC1 Figure 3-13 YT Double cycling flow chart 52
71 Yard truck single cycle unloading formulation Since the unloading formulation varies between single cycle unloading and loading and double cycle unloading and loading, the formulation of single cycle loading is expected to begin as shown in Figure Where: Figure 3-14 YT single cycle unloading journey Vessel to be discharged of imported containers and loaded with exported containers. Unload quay crane. Lanes to be loaded by imported containers. Lanes to be unloaded of exported containers. Shoreline Loaded truck`s travel path from the storage yard to the bay (X 1 ). Empty truck`s travel path from the bay to the exported container lanes (X 2 ). ( ) ( ). (Equation 3.24) where: Represents the yard truck unloading cycle time; is the container unloading time by QC at the bay; is the unloading time at the storage yard using an YC; 53
72 Represents the empty trucks travel path between the storage yard and bay side; is the loaded truck s travel path from the bay to the storage yard; represents the truck s speed when empty, ; Represents the truck s speed when loaded, ; Represents the truck waiting time at the yard zone; and Represents the truck waiting time at the bay or berth side; Yard truck single cycle loading formulation The YT single cycle loading formulation is the same as for single cycle unloading, except that moving empty YTs are replaced by loaded YTs moving from the berth to the storage yard. The calculation is based on the representation in Figure 3-15 YT single cycle loading journey where: Vessel to be discharged of imported containers and loaded with exported containers. Load quay crane. Lanes to be unloaded of exported containers. Shoreline Loaded truck`s travel path from the storage yard to the bay (X 1 ). Empty truck`s travel path from the bay to the exported container lanes (X 2 ). 54
73 ( ) ( ). (Equation 3.25) where: Represents the yard truck unloading cycle time; is the container loading time at the storage yard using a YC); is the container loading time using a QC at the bay; i h lo d d ru k r v l p h from h or g y rd o h y i h mp y ru k r v l p h from h y id o h or g y rd is the speed of an empty truck ft/min. ft/min; is the speed of a loaded truck ft/min. ft/min; is the truck waiting time at the yard zone in minutes; and is the truck waiting time at the bay or berth side in minutes Yard truck double cycling formulation YT double cycling is different than single cycling. There a partial compensation for the two loading and unloading single cycles by replacing the paths between the SY and the Berth side with loaded travels exclusively. The only empty travels are the short distances between the two QCs and between the two YCs. Figure 3-16 indicates the empty and the loaded travel paths. ( ) ( ) ( ) ( ). (Equation 3.26) ( ) ( ) (Equation 3.27) It is assumed that, and. ( ) ( ). (Equation 3.28) 55
74 Figure 3-16 YT double cycle journey where: Vessel to be discharged of imported containers and loaded with exported containers. Unloading quay crane unloaded imported containers loading quay crane loaded lanes of exported containers Shoreline. Loaded trucks travel path from the bay to the storage yard (X 1 ) Empty trucks travel path between export and import lanes (X 2 ) Loaded trucks travel path from the export container lanes to the bay (X 3 ) Empty trucks travel path between export and import lanes (X 4 ) Note: times are in minutes, distances are in feet and speeds are in ft/min; where: = yard truck unloading and loading (double) cycle time; = container unloading time by QC1 at the bay; = unloading time at the storage yard, using a Yard crane (YC1); = loading time at the storage yard, using a Yard crane (YC2); 56
75 = container loading time by QC2 at the bay; lo d d ru k r v l p h from h y o h or g y rd =empty trucks r v l p h w n xpor nd impor l n lo d d ru k r v l p h from h xpor d on in r l n o h y mp y ru k r v l h w n h xpor nd impor l n = the speed of loaded trucks, in ft/min. = the speed of empty trucks, ; = summation of the late/waiting time at the yard zone; and = summation of the late/waiting times at the bay or berth side, in minutes. 3.6 Simulation of Container terminal operation Simulating the container terminal operation makes it possible to: 1- Test the developed strategy s workability, effectiveness and efficiency; 2- Monitor the resource flow and determine where any bottlenecks may occur; 3- Define the improvements when replacing YT single cycling with double cycling, in terms of productivity, time and cost savings by comparing the two strategies using the same conditions and parameters; and 4- Know how many other resources are needed to keep the QC busy, as it is the most important, most expensive machine in the handling container fleet. Simulation could determine how many YTs are needed to optimize the QC s productivity by employing the sensitivity analysis method. The simulation steps for both the single-cycle and the developed double-cycle strategies are presented in the flow charts in Figure The EZStrobe simulation system is used for modeling the container terminal operation due to its simplicity and power. To apply the EZStrobe simulation system, some steps must be followed as shown in the simulation flow chart 57
76 mentioned above. The data collection stage will be clarified in depth in the next chapter, followed by a case study to test and verify the simulation models Single cycle simulation model A single cycle simulation model is designed according to the steps indicated in the single cycle problem detailed in Figure Since the unloading process precedes the loading, the truck cycle will start moving empty from the storage yard or truck pool toward the berth side. At the same time, the QC starts its cycle by its empty movement towards the target container to be unloaded from the vessel. Once a truck arrives at the berth, the QC loads the container onto the truck. Next, the truck moves loaded to the SY to be discharged by the YC, and then it travels back to the berth side (empty) to make another cycle. Meanwhile, the YC moves the container into the lane at the storage yard. The other trucks repeat this process until the last container is unloaded. Next, the loading process starts by loading containers on the trucks at the export storage yard, to be transported to the berth, where the QCs load the containers onto the vessel. Figure 3-19shows the single cycle model and Figure 3-20 shows the simulation parameters and resources Double cycle simulation model The double cycle simulation model is designed as a form of integration between single and double cycling. This integration begins with unloading three or more rows before starting double cycling as a pre-condition, in order to minimize the fleet size and maximize crane use. The steps of this double cycling strategy are implemented as shown in Figure They start with the unloading of three rows in single cycle unloading mode. Next, the unloading QC 1 will change from unloading to loading the containers on the vessel. Another QC, QC 2, is introduced to to 58
77 continue unloading the containers from the fourth row to the end. QC 1 starts loading the containers from the first to the last row. The trucks, loaded by YC 1 at the export storage yard, Start Collect the data needed to run the simulation model Double cycle Single cycle Build the simulation model Build the simulation model No NO Run the simulation process Run the simulation process No No Test the simolation Test the simolation Yes Yes verify the model result verify the model result Yes Yes Implement Sensitivity analysis Compare the feasible solutions and select the best group to be used in the optimization End Figure 3-17 Single and double cycling simulation procedures 59
78 Start Empty truck travel from storage yard to the berth side Is QC available? No Wait for the QC* Yes Load the container on the truck Loaded truck travel from the berth side to the storage yard No Is the YC available? NO Wait for the YC** Yes Discharge the container from the truck Unloading finished? Yes Return to export storage yard to begin loading the vessel A 60
79 A Load the truck at export storage yard Loaded truck travel from storage yard to the berth side Is QC available No Wait for the QC *** Yes Discharge the truck Empty truck travel from the berth side to the storage yard Is the YC available No Wait for the YC **** Yes Load the truck at the export storage yard NO Vessel loading finished Yes End * See figure 3-2 for QC unloading cycle ** See figuer3-6 for YC unloading Cycle *** see figure 3-3 for QC loading cycle **** See figure 3-7 for YC loading cycle Figure 3-18 Single cycle simulation steps application 61
80 . EmptyQC2Trvl UnloadVessel LoadedQC2Trvl 1 LoadYtAtQc2 >0, 1 QCBusy >=1, 1 1 ContAtVess el >0, 1 YtReturn YtTrvlToSY 1 YTWaitAtQ C2 1 YtBusyAtSY >0, 1 1 DischargYtAtSY >0, 1 YC2LoadedTrvl SpaceAtSY YCWait 1 YC2EmptyTrvl UnloadContAtSY SpaceAtVe 1 DischargYtAtQc1 Qc1LoadedTrvel ssel >0, 1 YtTrvelToYC1 >0, 1 YtBusyAt Qc1 QcWait LoadVessel 1 1 SpaceAtS Y 1 YtWait YtloadedTrvltoQ Qc1EmptyTrvl >=, 2 reroutloading ContAtSY >0, 1 >0, 1 1 LoadYt Yc1EmptyTrvl >=, RerouSign al YcBusy >0, 1 1 Yc1LoadedTrvl LeftContAtSy Figure 3-19: Single cycle simulation model 62
81 nyts yard truck n nqc QC loading cranes n nyc YC Loading yard crane n QCCst Loading Quay cranel cost ($/hr) $ YCCst Loading Yard crane cost ($/hr) $ YTCst Yard Truc cost ($/hr) $ OHCst Overhead cost ($/hr) $ Hrs Hrs needed to load and unload ` containers (3200 TEUs) SimTime/60 ProdRate Productivity rate (TEU)/hr) (4*SpaceAtVessel.CurCount/Hrs) HourlyCst Hourly Cost OHCst+nQC*QCCst+nYC*YCCst+nYTs*YTCst UnitCst Unit Cost ($/ETU) HourlyCst/ProdRate Figure 3-20: Single cycle simulation parameters arrive at the berth side to be discharged by QC 1. After being discharged, each truck will precede empty to QC 2,to be loaded with a container unloaded from the vessel. QC 1 simultaneously starts its cycle to load its container on the vessel. The loaded truck will move back to the (import) storage yard to be discharged by YC 2, which should be ready for this discharge. 63
82 Start Empty truck travel from storage yard to the berth side Is QC available? No Wait for the QC* Yes Load the container on the truck by unloading the first 3 rows Loaded Truck travel from the berth side to the storage yard No Is the YC available? NO Wait for the YC** Yes Discharge the container from the truck Unloading the firs 3 rows finished? Yes Retrieve to double cycling A 64
83 A Load the truck at export storage yard Loaded truck travel from storage yard to the berth side Is QC1 available NO Wait for QC1*** Yes Discharge the truck Truck empty travel from QC1 to QC2 Is QC2 Available NO Wait for QC2 * Yes Load the truck Loaded truck travel from QC2 to YC2 Is YC2 available NO Wait for YC2** Yes Empty truck tavel from YC2 to YC1 Is YC1 available NO Wait for YC1**** Yes B C 65
84 C B Load the truck at export storage yard NO Double cycling finished Yes Retrieve to Single Cycle Loading Loaded truck travel from storage yard to the berth side Is QC available No Wait for the QC *** Yes Discharge the truck Empty truck travel from the berth side to the storage yard Is the YC available No Wait for the YC **** Yes Load the truck at the export storage yard NO Vessel loading finished Yes End * See figure 3-2 for QC unloading cycle ** See figure 3-6 for YC unloading Cycle *** see figure 3-3 for QC loading cycle **** See figure 3-7 for YC loading cycle Figure 3-21: Double cycling simulation steps application 66
85 After being discharged by YC 2, the truck will proceed to the export SY to be loaded by YC 1 and start a new cycle. YC 2 starts its cycle as soon as it lifts a container from a truck. The YTs, QCs and YCs continue repeating their cycles until the last container has been fully unloaded. The fleet will then be reduced to one QC and one YC and fewer trucks to complete loading the vessel as a single cycle, as described earlier in the single-cycling simulation. Figure 3-22 shows the designed model and Figure 3-23 presents the parameters and resources. 3.7 Modeling and Optimization Vessel turnaround time modeling overview Vessel turnaround time is the total time for the unloading and loading operation. The turnaround time can also be determined as the summation of the QC cycle times required to load and unload the containers, which indicates that the QCs are the bottleneck of vessel turnaround time. So, keeping the QC busy is a logical target for improving container terminal productivity. Container terminals usually contain two servers to load/unload the trucks, one at the berth, the (QC) and the other at the yard, the (YC). Even though they are considered as two servers, it is still the QC that is considered to be the main server due to its complexity, expense and its direct relation to the vessel. Vessel turnaround time starts with the unloading of the first imported container and ends with the loading of the last exported container. This can be done by only one QC or multiple QCs, by means of the single cycling technique or by double cycling (or a combination thereof). Logically, the turnaround time is less when using double cycling than single cycling because some of the unloading and loading times overlap. Shorter vessel turnaround time attracts and satisfies costumers (shipping companies), even though it involves larger fleets (trucks, YCs, QCs). 67
86 EmptyQC2Trvl UnloadVessel LoadedQC2Trvl 1 >0, 1 QC2Busy ContAtVessel >=1, 1 LoadYtAtQc2 >0, 1 YtIdelAtQc2 1 YtReturn SpaceAtSY YtTrvlToSY 1 1 >0, 1 DischargYtAtSY YC2LoadedTrvl >0, 1 YtBusyAtSY YC2Wait 1 YC2EmptyTrvl UnloadContAtSY SpceAtVes seldbl 0 1 DschrgYtAtQc1Db Qc1LoddTrvelDbl LoadVesselDbl YtTrvelToQC2 >0, 1 >0, 1 Qc1Wait Dbl 1 Qc1EmptyTrvlDbl 1 YtIdelAtQc 2Dbl YtBusyAt Qc1 1 YtloddTrvlDbl YtWaitDbl 0 >0, 1 SpaceAtSY >=, ReruteToDblCycl ContAtS YDbl >=1, 1 1 LoadYtDbl Yc1EmptyTrvlDbl >=, >0, 1 SgnlRerut Dble Yc1Busy Dbl Yc1LodedTrvlDbl LeftContAtSyDbl 1 68
87 UnloadVesselDbl LodedQC2TrvlDbl EmptyQC2TrvlDbl 3 >0, 1 QC2Busy Dbl 1 LoadYtAtQc2Dbl >=1, 1 SpceAtVess eldbl >0, 1 0 YtTrvlToSYDbl YtIdelAtQc2 Dbl YtReturnDbl 1 YtWaitDbl 0 1 YtBusyAt SYDbl >0, 1 4 DschrgYtAtSYDbl YC2LoddTrvlDbl UnlodContAtSYDl 1 SpaceAtS YDbl >0, 1 YC2WaitDbl 1 YC2EmptyTrvlDbl SpceAtVes sellst 1 Qc1LoadedTrvel LoadVessel DischargYtAtQc1 YtTrvlToQC2Last >0, 1 >0, 1 Qc1Waitl ast 1 Qc1EmptyTrvl 1 YtBsyAt Qc1Last YtloadedTrvltoQ gnlrerutsi nglld >=, YtWait 5 >0, 1 RerutToSinglLod 1 LoadYt 1 Yc1EmptyTrvl LeftContAtSy SpaceAtS YDbl >=, >0, 1 >0, 1 Yc1Busy Yc1LoadedTrvl ContAtSY 1 Figure 3-22: Double cycling simulation model 69
88 UnloddContan Containers to be Unloaded n r LoddContaine Contaners to be Loaded n r nyts yard truck n nqc1 QC1 loading cranes n nqc2 QC2 unloading crane n nyc1 YC1 Loading yard crane n nyc2 YC2 Unloading Yard crane n QC1Cst Loading Quay cranel cost ($/hr) $ QC2Cst Unloading Quay crane cost ($/hr) $ YC1Cst Loading Yard crane cost ($/hr) $ YC2Cst Unloading Yard crane cost ($/hr) $ YTCst Yard Truck cost ($/hr) $ OHCst Overhead cost ($/hr) $ Hrs Hrs needed to load and unload ` containers (32000 TEUs) SimTime/60 ProdRate Productivity rate (TEU)/hr) (((24*SpceAtVesselLst.CurCount)+(3200))/Hrs) HourlyCst Hourly Cost OHCst+nQC1*QC1Cst+nQC2*QC2Cst+nYC1*YC1Cst+nYC2*YC2C st+nyts*ytcst UnitCst Unit Cost ($/ETU) HourlyCst/ProdRate Figure 3-23 Double cycle simulation parameters Modeling Vessel turnaround time using the single-cycling technique Vessel turnaround time starts with the unloading of the first imported container when using the single cycling technique. Unloading continues until the imported containers have been fully discharged. Only then will the QC(s) change to loading the vessel. The vessel departs after the last exported container has been loaded. The total unloading and loading time is then counted as the vessel turnaround time. Figure 3-24 describes the procedure. 70
89 U c J=m U c i= n (a) discharge the vessel first (turnaround time starts) ( b) start loading after discharging Lc J=m Lci= n (c) Vessel depart after loading the last container (turnaround time is complete) Figure 3-24: Single cycle container handling procedure Single-cycle modeling optimizes T s as the objective function to be minimized, where: Ts= Vessel turnaround time when using single cycling technique; = time to unload imported containers + time to load exported containers; = average QC unloading cycle time= average time to unload (2TEUs) containers; = average QC loading cycle time= average time to load (2TEUs) containers; Assume = = average QC cycle time; = containers to be unloaded; and = containers to be loaded. The objective function to minimize the vessel turnaround time using single cycling (T s ) is: Ts= ]. (Equation 3.29) This function is subject to the following constraints: Total number of unloading containers per row= ; (Equation 3.30) = number of containers to be unloaded per row, where 1 ; Total number of rows to be unloaded on the vessel= ; (Equation 3.31) = number of rows on the vessel, where 1 ; Total numbers of containers to be unloaded = ; (Equation 3.32) 71
90 Total number of loaded containers = ; (Equation 3.33) = number of containers to be loaded per row, ; Total number of rows to be loaded on the vessel= ; (Equation 3.34) = number of rows to be loaded, ; and Total number of containers to be loaded=. (Equation 3.35) Equation (3.29) is the objective function and the number of rows varies according to the number of holds that a vessel is divided into. For each hold there is only one QC to unload and load the containers in that hold. The number of holds depends on the three conditions mentioned in section (2.5.2). Equation (3.32) verifies that unloading has been completed before loading begins. Equation (3.35) insures that a vessel will not depart until the last container has been loaded. The operation can be described as in the bar chart in Figure 3-25, where the unloading activity precedes the loading activity. The total time T s is the summation of the unloading and loading times. Unloading Activity Loading Time Figure 3-25: Single cycle container handling timeline 72
91 3.7.2 Modeling vessel turnaround time using the double cycling technique As with single cycling, vessel turnaround time starts with the unloading of the first imported container and ends with the loading of the last exported container. However, in double cycling, loading exported containers can be started at a certain time, in parallel with the container unloading. This time has specific constraints and conditions which have been discussed earlier in this chapter and will be presented in more detail later. When it is time to convert to double cycling, two QCs will work together as a unit to service YTs with different activities (loading and unloading). The overlapping of some of the QCs cycle time reduces the vessel turnaround time to less than it is in single cycling. This time savings is the main justification for applying the double-cycling technique. A vessel still needs to be loaded with the last exported container before departure. Turnaround time is counted as the sum of the series of single cycle unloading, double cycling and single cycling loading of the imported and exported containers. 1 1 (a) Unloading the first row (turnaround time starts) (b) Unloading the third row (c) Loading the first row and unloading the fourth row(d) Loading last rows (turnaround time is done) Figure 3-26: Loading and unloading a vessel using double cycling 73
92 . Figure 3-26 describes the procedure and Figure 3-27 shows the timeline of the double cycling procedure. The double cycle time modeling optimizes T D as the objective function to be minimized, where: T D = Vessel turnaround time when using the double cycling technique = time to unload the first 3 rows of imported containers + maximum time to unload the remaining containers and to load the exported containers except for the last 3 rows + time to load the last 3 rows. The number of rows assigned to each pair of QCs depends on the number of holds that a vessel is divided into. Each hold can be occupied by two QCs. Not more than 3 holds of a vessel can be divided, so there will be a maximum of six QCs assigned, in three pairs. The maximum unloading time combined with the maximum loading time is the vessel turnaround time. T D = m x (Equation 3.36) = average QC unloading cycle time= average time to unload (2TEUs) containers; = average QC loading cycle time= average time to load (2TEUs) containers; Assume = = average QC cycle time; = containers to be unloaded; and = containers to be loaded. This objective function is subject to the following constraints: Total number of unloading containers per row= ; (Equation 3.37) = Number of containers to be unloaded per row, 1 ; Total number of rows to be unloaded on the vessel = ; (Equation 3.38) = Number of rows on the vessel, 1 ; 74
93 Total number of the first rows to be unloaded using single cycle= ; (Equation 3.39) Number of containers of the first three rows to be unloaded using single cycling ; (Equation 3.40) Number of containers to be unloaded using double cycling = ; (Equation 3.41) Total number of loaded containers = ; (Equation 3.42) Number of containers to be loaded per row, ; Total number of rows to be loaded on the vessel= ; (Equation 3.43) = Number of rows to be loaded, ; Number of rows to be loaded using double cycling =. (Equation 3.44) Number of containers to be loaded using double cycling = ; (Equation 3.45) Number of the last three rows to be loaded using single cycle= ; and (Equation 3.46) Number of containers to be loaded using single cycling =. (Equation 3.47). Single cycle unloading Double cycle unloading Activity Double cycle loading Single cycle loading Time Figure 3-27 Double cycling timeline 75
94 3.7.3 Modeling of possible double cycling scenarios Three scenarios are possible in real life container handling using double cycling: the number of containers to be unloaded and loaded is equal, there are more containers to unload than to load, and there are less containers to unload than to load First scenario Unloading containers U c = loading containers L c In this case the objective function is: T D =. (Equation 3.48) Second scenario The number of unloading containers > the number of loading containers (. The unloading process precedes the loading process. To satisfy this condition, the number of rows that must be unloaded in single-cycling mode to insure the earliest possible start of nonconflict double cycling must be determined. In addition to these three rows, another, or part of another row must be calculated, according to the difference between the containers to be unloaded and loaded. This scenario is represented in Figure These rows are described as ( ) (Equation 3.49) Where: represents the different rows between the unloading and the loading containers; = the total number of containers to be unloaded; = the total number of containers to be loaded; and 76
95 = the number of containers per row. The objective function is then: T D =. (Equation 3.50) Single cycle Activity Double cycle unloading Double cycle loading Single cycle Time Figure 3-28 Double cycling timeline where the number of unloaded containers > the number of loaded containers Third scenario The number of containers to be unloaded the number of containers to be loaded ( In this case, the additional numbers of loading containers are to be added at the end of the procedure to insure the early start of double cycling. This schedule will preclude conflicts (crane use, traffic). Two different cases are implemented to clarify the timeline, presented in Figure 3-29 and Figure 3-30). The extra loading containers can be defined as: ( ) (Equation 3.55) The objective function is then: ( ) T D = 77
96 . (Equation 3.56) Single cycle Activity Double cycle unloading Double cycle loading Single cycle Time Figure 3-29 Double cycling timeline where the number of loaded containers > unloaded containers, case 1 Or: T D =. (Equation 3.57) Single cycle loading Double cycle unloading Activity Double cycle loading Single cycle loading Time Figure 3-30: Double cycling timeline where the number of unloaded containers < the number of loaded containers, case 2 78
97 3.7.4 Optimization Optimization is the most important part of this research. Optimizing the fleet size that delivers the handling container tasks with efficient productivity and reasonable cost is what makes it possible to achieve the main objective of the research. The aim of this optimization is to satisfy the following: 1- Insure the improvement in container terminal productivity when replacing YT single cycling by double cycling. 2- Define the fleet productivity in each activity of the developed strategy (single cycle unloading, double cycle, and single cycle loading) to be able to optimize the fleet size. 3- Define the vessel turnaround time, which is very important for scheduling in both planning and control management. 4- Predict the costs of the operation to help cost managers in building task costs and markup. 5- Select the best fleet size, according to the resources availability, that delivers the job with optimum productivity and reasonable costs. To optimize container terminal fleet size the two objective functions to minimize vessel turnaround time and hourly cost must be satisfied; maximizing container terminal productivity and minimizing the unit cost. Since there are two objective functions, a multi-objective optimization approach is the best way to proceed. Equation (3.22) and equation (3.58) are the two objective functions to be optimized when using the single cycle strategy. In equation (3.22) the turnaround time T s is controlled by the maximum time the QC takes to finish the job. The containers and the QC cycle times are defined according to how many holds a vessel is divided 79
98 into. It is assumed that a vessel can be divided from one hold into six holds, which means that the vessel can be serviced by up to six QCs. Each QC has its required YTs and their YCs to keep it busy. Using the simulation solution groups and the results of the first objective function, it is possible to define the population, the genes and chromosomes of the second objective function. In double cycling, the time objective function will be one of the following equations (3.46, 3.48, 3.50, 3.56, or 3.57), according to which of the three scenarios stated earlier in this chapter reflects the vessel loading conditions. The second objective function is equation (3.61). As in single cycling, the vessel is divided into holds. Since each hold can be serviced by a pair of QCs, the vessel can be divided into not more than three holds for six QCs. The hold with the highest number of containers is the hold that controls the vessel turnaround time. Using these results, the second objective function can be optimized. The optimum solution is the one that best satisfies both objectives. Since the developed strategy of double cycling requires the partial use of single cycling unloading before changing to double cycling, and it normally ends by single cycling loading, the three activities are have to be done in sequence: (a) single cycling unloading, (b) double cycling, and (c) single cycling loading. The turnaround time is the summation of those three activities times, as shown in to Figure To satisfy the two main objectives optimization and thus the vessel turnaround time and total cost, several sub-objectives have to be optimized in each activity: single cycle unloading productivity, single cycle unloading unit cost, double cycling productivity, double cycle unit cost, single cycle loading productivity and single cycle loading unit cost. The objective functions are to: Maximize A1, A2, A3 and Pt, and Minimize B1, B2, B3, Tt, Ct and Uc, 80
99 where: A1 is the productivity of the chain in the first activity (YT single cycle unloading); A1= the minimum resource productivity of the chain in this activity; and A1 =min x y z ; (Equation 3.58) where:. is the QC Productivity and x is the number of QCs; is the YT productivity and y is the number of YTs, is the YC productivity and Z is the number of YCs; A2 is the productivity of the chain in in the second activity (YT Double cycling); A2 = the minimum resource productivity of the chain in this activity; and A2 = min x y z (Equation 3.59) where: is the pair of QCs double cycling productivity and x is the number of pairs of QCs; is the YT double cycling productivity and y is the number of YTs; is the pair of YCs double cycling productivity and Z is the number of pairs of YCs; A3 is the productivity of the chain in the third activity (when single cycle loading); A3= the minimum resource productivity of the chain in this activity; and A3 = min x y z ; (Equation 3.60) where: is the QC loading productivity and x is the number of QCs; is the YT single cycle loading productivity andy is the number of YTs; is the YC loading productivity and Z is the number of YCs. Pt is the average productivity of the chain fleet during the task Pt = number of units to be moved/ the total time of the operation Pt = u i j l g. (Equation 3.61) 81
100 B1 is the unit cost in the first activity; B1= ( of resources hourly costs and overhead hourly cost/ single cycle unloading productivity); B1= [ (QCs, YTs and YCs hourly costs) + (overhead hourly cost)]/a1. (Equation 3.62) B2 is the unit cost in the second activity. B2= ( of resources hourly costs and overhead hourly cost/ double cycling productivity); B2= [ (QCs, YTs and YCs hourly costs) + (overhead hourly cost)]/a2. (Equation 3.63) B3 is the unit cost in the last activity. B3= ( of resources hourly costs and overhead hourly cost/ single cycle unloading productivity); B3= [ (QCs, YTs and YCs hourly costs) + (overhead hourly cost)]/a3. (Equation 3.64) Tt is the vessel turnaround time; Tt= the total time needed to unload and load the vessel; and Tt= of the time required to deliver each the three activities. Adapting equation (3.48) Tt= i j i j l l. (Equation 3.65) Ct is the total cost to finish the task Ct = each the three activities cost. Adapting the above equation: Ct= i j i j l where: l, (Equation 3.66) Uc is the average unit cost using the strategy all over the operation; Uc = total cost / the number of units to be unloaded and loaded; so that 82
101 Uc= i j i j l l. (Equation 3.67) The objective functions are subjected to: A1, A2, A3, Pt, B1, B2, B3, Tt, Ct and Uc> 0 1 X X X Y Y Y nd 1 Z Z Z, when 6 QCs are available; X X X Y Y Y nd Z Z Z when only 4 QCs are available; X1, X2, X3 = 1; Y Y Y nd 1 Z Z Z wh n only Q are available; (X1, X2, X3) QCs; (Y1, Y2, Y3) YTs and (Z1, Z2, Z3) YCs, X, Y and Z are integers. The expected results are a set of the near-optimum feasible solutions. As stated earlier, in multiobjective optimization, selecting only one solution involves a conflict in most cases. In such cases, the support of other methods or approaches is crucial. In this research, three approaches and a simulation tool are implemented. Pareto frontier: utilized to identify if there is a possibility of visualizing a unique solution that dominates all other alternatives. If not, the other two approaches and the simulation are required. TOPSIS: implemented in two scenarios: The first only considers two main criteria: Total average productivity (Pt), where the highest is best, and Average unit cost (Uc), in which the lowest is the best. The second scenario considers 7 criteria; (P1, P2, P3 and Pt); in which all are judged such that the higher values are better, and (B1,B2, B3, Tt and Uc),evaluated such that lower values are better. 83
102 The first scenario is considered more often, as it uses criteria that are usually the preferred comparative criteria in similar problems, while the second scenario is employed because sometimes it provides information that is important for the operation managers to know: a- The time saved by utilizing the first activity could be invested in the other resources in different areas or activities; b- The timing of when to start and finish the second activity is difficult, as it is the more challenging activity, where the productivity of the fleet reaches its maximum and the cost is higher. Also, the time for when the activity is completed is important in order to plan to use the un-needed resource in other activities. Cost and decision index: a very useful approach which is a concept is close to that of the TOPSIS, except that it compares the cost relatively to the productivity. Simulation: here the EZStrobe simulation is used first to verify that the strategy is implementable, beneficial and worthwhile, and second to compare the best-ranked alternatives according to their fleet size. The best fleet size will produce more units in less time and at reasonable cost. Even though the approaches have shown their powerful ability to select the best solution, sometimes there is a contrast in the results from one approach to another. In this case, one more step is needed to be implemented, evaluating the chosen alternatives from each approach in one table. Those that obtain the best ranks overall are selected as the winning alternative. 84
103 Chapter 4: Data collection and case study 4.1 Overview This chapter introduces the data collection process, illustrated with a case study. The case study has a specific method of data collection related to the lifting or loading of containers. The data will be used in the simulation and optimization models. The collected data is focusing on QCs YC and YT cycle times. The cycle times of these resources includes single cycle loading, single cycle unloading and double cycling strategies. In order to know more about the productivity of these resources, their cycle times are translated to a productivity data measurement based on the postulate of a single movement produced on a forty-foot or two twenty-foot containers, for 2 TEUs/ move in total.it is understood that a reasonable amount of random data for all three types of equipment must be collected and then statistically analyzed to obtain the mean time ( and standard deviation of each type of equipment s cycle time. The result data was collected and analysed using an EasyFit distribution to draw the histogram and to calculate the mean and the standard deviation. A simulation of container terminal productivity operation has been carried out in the framework of this research. The simulation requires each activity to be run over its complete duration. A means to bring the system closer to the real data by mimicking reality was developed. Two optimization tools were used in the case study. A sensitivity analysis method was employed on the YTs variable only, in order to compare the traditional strategy of handling containers (YT single cycling) to the developed strategy (the combination of YT single and double cycling). Next, a multi-objective optimization was used by employing GA as an optimization tool using two different software approaches. 85

104 4.2 Case study description This section is devoted to collecting the case study data from a transhipment container terminal to verify and calibration the strategy via both the optimization and the simulation models. The terminal is located in the Strait of Gibraltar at Tangier, Morocco, and is operated by APM Terminals S.A., a world-wide container terminal company based in the Netherlands. APM Terminals operates about 181 container terminals in 61 countries. The location of this terminal is characterized as a gateway linking Europe, Africa and the Americas. It links the Mediterranean to the Pacific, which qualifies the port terminal as appropriate for transhipment operations (see Figure 4-1for its location). This terminal is operated under a 30-year Build Operate Transfer (BOT) contract between the Government of Morocco and the APM Terminals Company that began in July The capacity of the terminal is about1.8 million TEU/annum and it is mainly operated for transhipment. To date, APM Terminals has made capital investments on the order of 140 million in this terminal. The traffic flow and the layout of APM Terminals Tangier, S.A. are presented in Figure 4-2 and Figure 4-3, respectively. Figure 4-1: Case study location on the Strait of Gibraltar 86

105 Figure 4-2: APM Terminals Tangier traffic flow (APM Terminals Tangier indoor data 2014) 87
")
106 Figure 4-3: APM Terminal Tangier layout (APM Terminals Tangier indoor data 2014) 88
107 In April 2014 a site visit was carried out to expand the understanding and awareness of the container terminal mechanism and performance and to collect data from APM Terminals Tangier. The most important data targeted were: QCs cycle times, YCs cycle times, YTs cycle times, hourly costs, overhead costs and any other information that could help in the research. Fortunately, in addition to the data collected by the visitor, the APM Terminals management provided the visitor with indoor data that had recently been collected for their terminal monitoring and records. Unfortunately, the financial department only provided the hourly costs of the machines; they excluded the employee wages or salaries. Overall, these data were still adequate to run the simulation and optimization models after cleaning, purification and statistical analyses. 4.3 Case study cycle time data collection The equipment cycle times were collected from the terminal using both the stopwatch method and from the indoor data furnished by APM Terminals. Fortunately, the company had finished collecting cycle time data for their records and monitoring purposes just one week before the visit. In April, 2014.As specified above, the cost data provided by APM Terminals was only for the hourly costs of their machines. A sample of this raw data can be founded in Table 4-1. The data was then cleaned and re-tabulated to that it could be used and statically analysed for our purposes. The EasyFit distribution was used to analyze the data and the final results of the analysis are summarising at the end of this chapter QC cycle times The QC cycle times (loading and unloading) were divided into four stages starting at the YT lanes, as specified in chapter three. 89
108 a- Unloading cycle time stages 1- Empty forward moving; 2- Lift or lock the container (discharge the container from the vessel); 3- Loaded backward moving; and 4- Release the container (load the container on the truck). The QC unloading cycle time = the summation of the four stages times, see Table 4-1. This is also termed the QC unloading move (for more details, please refer to Figure 3-2). Cycle number Table 4-1: case study QC unloading moves sample empty move forward (minute) lift Con from Vessel (minute) Loaded move backward (minute) Load Con on YT (minute) Total cycle time (minute) sum average
109 The statistical analysis results of each stage are represented and summarised in Table 4-2, where the mean and standard deviations are defined. It is clear that stages with a combination of two resources have a high standard deviation. This reflects the complexity of loading a container to its appropriate position and lifting it from its position onto the other resource. Operator proficiency is very important, as is the readiness of the container to be lifted and the availability of the resource. Two samples of histograms showing QC two-stage statistical analysis are shown in Figure 4-4Figure 4-5. It is remarkable to observe how much difference there is between the shortest to the longest durations in lifting containers from the vessel. This shows how critical sharing between two resources becomes during an activity. Table 4-2: Case study QC unloading cycle time probability distribution results Movement direction Distribution Mean ( SD type µ) Empty forward travel Normal Lift the container from the vessel Normal Loaded backward travel Normal Load the container on the truck Normal b- QC loading cycle time stages As in unloading activity, the cycle time starts at the YT lanes, but here it begins with lifting the container from the YT. The stages are sequenced as: 1- Lift or lock the container (discharge the container from the YT); 2- Loaded forward moving; 3- Release the container (load the container on the vessel); and 4- Empty back word moving. 91
110 f(x) f(x) Probability Density Function x Histogram Normal Figure 4-4: QC Empty forward move travel stage Probability Density Function x Histogram Normal Figure 4-5: QC lift container from the vessel stage 92
111 The QC loading cycle time stages are represented in Table 4-3. It is clear that the QC loading cycle time is less than it is for unloading. The reasons are that the crane operators are more cautious when unloading the vessel, while the space on vessel is more open for operators when loading. Loading is the terminal operator s responsibility and the container loading process is usually carefully planned by the terminal operators. Cycle ID lift discharge the YT (minute) Table 4-3: case study QC loading moves sample loaded move forward (minute) load the vessel (minute) empty back move (minute) Total cycle time (minute) Sum Average
112 The QC loading cycle time = the summation of the four stages times. This is also called the QC loading move. The statistical analysis results of each stage are represented and summarised in Table 4-4, which presents the means and standard deviation. As in QC unloading cycles, the stages that involve the sharing other resources (lifting or loading the containers) have higher standard deviation than the empty QC moves (QC forward and backward moves). For further information, samples of histogram figurers and descriptive statics tables can be found in the Appendixes. Table 4-4: Case study QC loading cycle time probability distribution results Movement direction Distribution type Mean ( µ) Lift container from the YT Normal SD Loaded forward travel Normal Load the container on the Vessel Normal Empty backward travel Normal YC cycle times YC cycles times are not different than QC cycle times except that the vessel is replaced by the storage yard, where the unloading and loading starts. The unloading YC cycle time starts by discharging the container from the YT, and the loading cycle time starts by lifting the container from the SY. The final results after statistical analysis of the YC unloading and loading cycle time s data are represented in Table 4-5 and Table 4-6, respectively YT cycle times The yard truck (YT) cycles are categorised into three different activities: unloading, loading and double cycling. 94
113 a- YT unloading cycle time The YT unloading cycle time is broken-down to four stages: 1- YT travels empty from the SY to the berth side; 2- YT loading by the QC; 3- Loaded YT travels from the berth to the SY; and 4- Discharging of the YT by the YC. The YT cycle time is equal to the summation of the four stages times. Table 4-5: Case study YC unloading cycle time probability distribution results Movement direction Distribution Mean SD type ( µ) Lift container from the YT Normal Loaded forward travel Normal Load the container on SY Normal Empty backward travel Normal Table 4-6: Case study YC loading cycle time probability distribution results Movement direction Distribution type Mean ( µ) Empty forward travel Normal Lift the container from SY Normal Loaded backward travel Normal Load the container on the Normal SD b- YT loading cycle time As in YT unloading, the cycle time is divided into four stages, replacing the unloading by loading. 1- YT loading by the YC at the storage yard; 95
114 2- Loaded YT travel from the SY to the berth side; 3- YT discharged by the QC; and 4- Empty YT travels from the berth side to the SY. c- YT double cycle Since the case study terminal does not employ YT double cycling, the author has modified the cycle times to mimic the process as follows: 1- Keep loaded YT travels in both single cycle unloading and single cycle loading; 2- Keep YT discharging and loading by QCs in both unloading and loading single cycling; 3- Keep YT discharging and loading by YCs as in QCs; 4- Add YT empty travel from QC unloading and QC loading; and 5- Add empty travel from YC unloading and YC loading. This will produce YT double cycling divided into six stages: YT loading at the SY, YT loaded travel from the SY to the berth side, YT discharging at berth side, YT empty travel from the unloading QC to the loading QC, YT loading at berth side, YT loaded travel from berth side to the SY, YT discharging at the SY and YT empty travel from the unloading YC to the loading YC. The operators that load and discharge the trucks at QCs and YCs need to consider the cranes loading and the truck s discharging times. These times were previously represented in the cranes cycle times. The YT double cycling time is equal to the summation of the six stages. The final results of the YT cycle times in the three activities are summarised in Table
115 Table 4-7: case study YT travels probability distribution results Activity description Single cycle unloading Single cycle loading Double cycle (Loading and unloading) Movement direction Distribution type Mean ( µ) SD Empty travel From SY to QC Normal Loaded travel from QC to SY Normal Loaded travel from SY to QC Normal Empty travel from QC to SY Normal Loaded travel from YC1 to QC1 Normal Empty travel from QC1 to QC2 Deterministic Loaded travel from QC2 to YC2 Normal Empty travel from YC2 to YC1 Deterministic Case study resources productivities To determine the resources productivities, the times were recalculated, based on the assumption that each machine single cycle produces 2TEUs. For example, if the QC makes 27 moves per hour in single cycling, it produces (27). (2)= 54 TEUs per hour. The same thing can be applied for each YC and YT. On double cycling there would be 4 TEUs per cycle for each pair of QCs and YCs and 4 TEUs per cycle for a single YT. For the simulation, the detailed cycle times for each machine were used as input and the productivity is one of the expected outputs. In the optimization, the productivity of each machine is needed to run the model in order to identify the fleet s or the chain s productivity as a whole. The steps for recalculating the QC unloading productivity are given below as an example: 1- Export the total cycle time from Table 4-1; 2- Calculate the number of moves per hour = 60 (min)/cycle time (min); 3- For QC unloading productivity, multiply the number of moves per hour by 2 TEUs/move; and 97
116 4- For QC double cycle productivity based on QC single cycle unloading productivity, take the result from step 3 and multiply by 2, or repeat step 3, replacing 2 TEUs by 4TEUs. Table 4-8: Case study of QC single cycle unloading productivity and double cycling based on number of QC moves/ hour Cycle ID total time (min) Number of Moves/hr Single cycle unloading Prod. (TEU/hr) Double cycle Prod. (TEU/hr) sum average
117 f(x) f(x) 0.3 Probability Density Function x Histogram Error Figure 4-6: QC unloading productivity histogram Probability Density Function x Histogram Normal Figure 4-7: QC loading productivity probability density function histogram 99
118 The QC unloading and loading probability functions are represented in Figure 4-6 and Figure 4-7, respectively. As in QC productivities, YC productivities are calculated based on the YC cycle times in both unloading and loading cycles. YC double cycling is also abstractive, based on YC single cycle productivity. The lowest YC productivity is adapted to calculate the YC double cycle productivity as a way to control the pairs of YCs, since the YC pairs are dependent on each other. The YC loading productivity is greater than it is in unloading. The adopted productivity for YC double cycling is double that of the YC s unloading productivity. The YT productivity is calculated using the same principle of cranes with only some modifications. YT single cycle productivities follow the same principles as for cranes. Defining the number of moves per hour and then multiplying that number by 2 TEUs gives the YT single cycle productivity for each activity. For double cycling, the steps given below must be followed: 1- Export the YT double cycle time from section 4.3.3; 2- Define the number of moves per hour= 60 (min)/ double cycle time (min); and 3- Multiply the number of moves per hour by 4 TEUs. Table 4-9: Statistic analysis of resources productivity result summary Resource Category Unloading (TEU/hr) Single cycle Loading (TEU/hr) Double cycling (TEU/hr) QC Mean (µ) SD (σ) YT Mean (µ) SD (σ) YC Mean (µ) SD(σ)
119 4.5 Cost data collections As mentioned earlier, the resources hourly costs are the only data provided by the company. The authors preferred to add 25% of each resource hourly cost as an overhead cost. The equipment base hourly costs provided by the APM terminal are; QC hourly cost = $/hr YC hourly cost = $/hr YT hourly cost = 6.75 $/hr 4.6 Summary Data collection is an important part of any project. Successful data collection will vary according to the type of project, the use and the nature of the data. Data almost always needs to be organized, cleaned and analyzed to fit the format used in the model or project. Data can be qualitative, quantitative or both. In this research most of the data are quantitative, divided into two types: duration data and productivity data. The duration data was collected from APM Terminals container facility at Tangier, Morocco. The productivity was calculated and abstracted from the duration data based on a single move of a resource equal to 2 TEUs/ move and of a double move equal to 4 TEUs/ move. Both types of data were organized, analyzed and summarized. The data is now is ready to be used in implementation as input variables in both simulation and optimization models. The next chapters show how these models were implemented and verified. 101
120 Chapter 5: Models implementation and verification 5.1 Overview In this chapter, both the simulation and optimization models are implemented, using both duration and productivity case study data. The models test the handling strategy s efficiency and assess its improvements. The aims of this implementation and verifications are: 1- To make sure that the strategy can be implemented in real life through the simulation tool; 2- To monitor the movements of the resources during the container handling process and at the turning points of changing from single to double cycling and vice versa; 3- To quantify the improvement in productivity by comparing the introduced strategy with the traditional strategy; and 4- To be able to select the optimum fleet size that will deliver the job with maximum productivity and thus minimize the vessel turnaround time at a minimum cost. Both the simulation model and optimization model developed in chapter three are implemented, verified and tested, followed by selected approaches to their deployment. First, the simulation model is implemented using the case study duration data. Second, the sensitivity analysis is implemented using the simulation model by changing the number of YTs. The simulation models of both single cycling and double cycling with the results of the sensitivity analysis are then compared. The comparison shows the improvement and benefits achieved by replacing traditional container handling (YT single cycling) by the introduced strategy (YTs double cycling). Third, a multi-objective GA model is implemented using the case study productivity data. Fourth, some selection approaches are implemented to select the best alternative from 102
121 results generated by GA optimization. Fifth, the simulation model is implemented again, to evaluate the top-ranked four solutions generated by the GA. Finally, the top solutions are compared and ranked to select the best solution, also called the best chromosome or alternative. 5.2 Simulation model implementation The case study considers a hatched vessel with a TEU (8000, 40 feet containers) capacity. The vessel will totally unload and then be loaded with the same number of containers. The containers are estimated to be distributed uniformly on the vessel in 20 rows and 20 stacks. The total number of containers per row is 400. For single cycling, only one QC and one YC will do the job of unloading and loading the vessel, and the loading process will not start until the unloading process is completely finished. However, for double cycling, two QCs and two YCs are needed to do the job. Each activity (loading and unloading) requires one QC and one YC. The same trucks will work as duel loading/unloading trucks to serve the QCs and the YCs. The small movement of QCs between the rows is neglected due its minor time value compared to the total time of unloading each row. The YCs are of the RTG type Single cycle simulation inputs The single cycle model is displayed in detail in chapter three. The simulation model is shown in Figure 5-1 and the simulation process is clarified in detail in section 3-6. The input durations and costs are derived from the data selected and analyzed in chapter 4. The single cycle simulation parameters include the number of resources, the number of containers to be unloaded and loaded and the hourly costs of the equipment cost plus 25% of the total hourly costs to cover overhead and labour. 103
122 EmptyQC2Trvl Normal[0.48,0.16] UnloadVessel Normal[0.36,0.3] LoadedQC2Trvl 1 Normal[0.84,0.33] LoadYtAtQc2 Normal[0.30,0.36] >0, 1 QCBusy 1 >=1, 1 ContAtVes sel 8000 >0, 1 YtReturn YtTrvlToSY 1 Normal[3.25,0.60] Normal[2.74,0.53] 1 YtBusyAtSY YTWaitAtQC2 5 >0, 1 1 DischargYtAtSY Normal[0.34,0.13] >0, 1 YC2LoadedTrvl Normal[0.77,0.23] SpaceAtSY 0 YCWait 1 1 YC2EmptyTrvl Normal[0.62,0.28] UnloadContAtSY Normal[0.28,0.21] DischargYtAtQc1 Qc1LoadedTrvel 1 SpaceAtVe Normal[0.20,0.11] Normal[0.60,0.25] ssel 0 >0, 1 QcWait YtTrvelToYC1 >0, 1 YtBusyAt Qc1 1 Normal[2.7,0.54] YtloadedTrvltoQ SpaceAt Normal[2.77,1.04] SY YtWait 0 5 >0, 1 >=8000, LoadYt Normal[0.18,0.09] rerout 8000 >0, 1 >0, 1 >=8000, 8000 ContAtSY Yc1LoadedTrvl YcBusy Normal[1.12,0.33] RerouSign al LoadVessel Normal[0.20,0.16] Qc1EmptyTrvl Normal[0.66,0.24] Yc1EmptyTrvl Normal[0.67,0.16] LeftContAtSy Normal[0.18,0.07] Figure 5-1: Single cycle simulation model implementation 104
123 The parameters used in the implemented single cycle simulation model are listed below and presented in more detail in Figure 5-2. Containers to be unloaded = 8000, 40-ft (16000 TEUs) Containers to be loaded = 8000, 40-ft (16000 TEUs) Number of QCs required = 1 Number of YCs required = 1 Number of trucks for unloading and loading = 5 UnloddContanr Containers to be Unloaded 8000 LoddContainer Contaners to be Loaded 8000 nyts yard truck 5 nqc QC loading cranes 1 nyc YC Loading yard crane 1 QCCst Loading Quay cranel cost ($/hr) YCCst Loading Yard crane cost ($/hr) YTCst Yard Truc cost ($/hr) 6.75 OHCst Overhead cost ($/hr) 25% of total hourly cost Hrs Hrs needed to unload and load ` containers (32000 TEUs) SimTime/60 ProdRate Productivity rate (TEU)/hr) (4*SpaceAtVessel.CurCount/Hrs) HourlyCst Hourly Cost (nqc*qccst+nyc*yccst+nyts*ytcst)*1.25 UnitCst Unit Cost ($/ETU) HourlyCst/ProdRate Figure 5-2: Single cycle simulation parameters Case of study single cycle outputs The simulation is targeted to define the four results below, using EZStrobe: 1- Productivity rates; 2- Total hours to complete unloading and loading of containers (32000 TEUs); 105
124 3- Hourly costs; and 4- Unit cost (cost of a single TEU). These results from theezstrobe simulation are normally displayed as in Figure 5-3, where the inputs and important results can be easily observed. Stroboscope Model 5 trucks single cycle Startigy containers 1 QC 1YC.vsd ( ) ** Model input parameters ** yard truck : 5 QC loading cranes : 1 YC Loading yard crane : 1 Loading Quay crane cost ($/hr) : Loading Yard crane cost ($/hr) : Yard Truck cost ($/hr) : 6.75 Overhead cost ($/hr) : 0 Containers to be unloaded : 8000 Containers to be loaded : 8000 ** Calculated results after simulation ** Hrs needed to load and unload ` containers (32000 TEUs): Productivity rate (TEU)/hr) : Hourly Cost : Unit Cost ($/ETU) : Statistics report at simulation time Figure 5-3: Single cycle simulation results Double cycle simulation inputs The double cycle model has been designed and is displayed in chapter three. The simulation model is shown in Figure 5-4. In double cycling, it is expected that unloading the first three rows of 400 containers will be carried out with the single cycling technique, followed by a conversion to double cycling for 17 rows of 400 containers. The loading is anticipated to go back to a single cycle model for loading the last three rows of 400 containers. The parameters are listed below and shown in detail in Figure
125 EmptyQC2Trvl Normal[0.84,0.22] UnloadVessel Normal[0.22,0.23] LoadedQC2Trvl Normal[0.84,0.33] 1 >0, 1 QC2Busy 1 >=1, 1 ContAtVe ssel 1200 LoadYtAtQc2 Normal[0.306,0.363] >0, 1 YtTrvlToSY Normal[2.74,0.53] 1 >0, 1 YtBusyAt SY YtReturn 1 Normal[3.25,0.6] YtIdelAtQc2 5 1 DischargYtAtSY Normal[0.347,0.138] >0, 1 SpaceAt SY YC2LoadedTrvl Normal[0.77,0.101] YC2Wait 1 1 YC2EmptyTrvl Normal[0.6,0.24] UnloadContAtSY Normal[0.28,0.21] 2 SpceAtVes seldbl 0 1 DschrgYtAtQc1Db Normal[0.206,0.112] Qc1LoddTrvelDbl Normal[0.64,0.25] LoadVesselDbl Normal[0.208,0.161] YtTrvelToQC >0, 1 >0, 1 YtBusyAt Qc1 1 Qc1WaitDbl 1 1 YtloddTrvlDbl Qc1EmptyTrvlDbl Normal[0.66,0.244] YtIdelAtQc2 Normal[2.77,1.04] Dbl YtWaitDbl 0 >0, 1 1 SpaceAt ReruteToDblCycl SY >=1200, 1200 ContAtSY Dbl 0 >=1, 1 LoadYtDbl Normal[0.233,0.11] Yc1EmptyTrvlDbl Normal[0.67,0.16] >=1200, 1200 >0, 1 SgnlRerut Dble 1200 Yc1Busy Dbl 1 1 Yc1LodedTrvlDbl Normal[1.1,0.33] LeftContAtSyDbl Normal[0.18,0.07] 107
126 UnloadVesselDbl Normal[0.22,0.23] EmptyQC2TrvlDbl Normal[0.84,0.22] 3 LoadYtAtQc2Dbl >0, 1 QC2Busy Dbl 1 >=1, 1 Normal[0.306,0.363] LodedQC2TrvlDbl Normal[0.84,0.33] 1 SpceAtVess eldbl YtTrvlToSYDbl >0, 1 YtIdelAtQc2 Dbl 0 YtReturnDbl YtWaitDbl 0 Normal[2.7,0.51] 1 4 YtBusyAt SYDbl >0, 1 DschrgYtAtSYDbl Normal[0.347,0.138] YC2LoddTrvlDbl Normal[0.77,0.101] UnlodContAtSYDl Normal[0.28,0.21] 1 SpaceAtSY Dbl 0 >0, 1 YC2WaitD bl 1 1 YC2EmptyTrvlDbl Normal[0.6,0.24] SpceAtVe ssellst 0 1 Qc1LoadedTrvel Normal[0.64,0.25] LoadVessel Normal[0.208,0.161] DischargYtAtQc1 Normal[0.206,0.112] 1 YtTrvlToYC2Last Normal[2.68,0.54] >0, 1 >0, 1 YtBsyAt Qc1Last Qc1Waitla st 1 YtloadedTrvltoQ 1 Qc1EmptyTrvl Normal[0.66,0.244] gnlrerutsi nglld 6800 >=6800, 6800 YtWait 5 RerutToSinglLod >0, 1 1 LoadYt Normal[0.233,0.11] >0, 1 1 Normal[2.77,1.04] Yc1EmptyTrvl Normal[0.67,0.16] LeftContAtSy Normal[0.18,0.07] SpaceAtS YDbl 0 >=6800, >0, 1 ContAtSY 0 Yc1Busy 1 1 Yc1LoadedTrvl Normal[1.11,0.33] Figure 5-4: Double cycling simulation model 108
127 The double cycle simulation parameters are: Containers to be unloaded = 8000, 40-ft (16000 TEUs) Containers to be loaded = 8000, 40-ft (16000 TEUs) Number of QCs required = 2 Number of YCs required = 2 Number of trucks for unloading and loading = 5 Durations and hourly costs are generated from the data collection, see chapter 4. UnloddConta Containers to be Unloaded 8000 nr LoddContainer Contaners to be Loaded 8000 nyts yard truck 5 nqc1 QC1 loading cranes 1 nqc2 QC2 unloading crane 1 nyc1 YC1 Loading yard crane 1 nyc2 YC2 Unloading Yard crane 1 QC1Cst Loading Quay cranel cost ($/hr) QC2Cst Unloading Quay crane cost ($/hr) YC1Cst Loading Yard crane cost ($/hr) YC2Cst Unloading Yard crane cost ($/hr) YTCst Yard Truck cost ($/hr) 6.75 OHCst Overhead cost ($/hr) 25% of total hourly cost Hrs Hrs needed to load and unload ` containers (32000 TEUs) SimTime/60 ProdRate Productivity rate (TEU)/hr) (((26*SpceAtVesselLst.CurCount)+(800))/Hrs) HourlyCst Hourly Cost (nqc1*qc1cst+nqc2*qc2cst+nyc1*yc1cst+nyc2*yc2cst+ny Ts*YTCst)*1.25 UnitCst Unit Cost ($/TEU) HourlyCst/ProdRate Case study of double cycling outputs Figure 5-5: Double cycling simulation parameters The simulation is targeted to define the four results below, using EZStrobe: 109
128 1- Productivity rates; 2- Total hours to complete the unloading and loading of containers (32000 TEUs); 3-Hourly costs; and 4-Unit cost (cost per TEU). The simulation results are then generated after the EZStrobe simulation run and shown in Figure 5-6. Stroboscope Model 5 Trucks new distribution.vsd vsd YT Tangier.vsd ( ) ** Model input parameters ** Description : 0 yard truck : 5 QC1 loading cranes : 1 QC2 unloading crane : 1 YC1 Loading yard crane : 1 YC2 Unloading Yard crane : 1 Loading Quay crane cost ($/hr) : Unloading Quay crane cost ($/hr) : Loading Yard crane cost ($/hr) : Unloading Yard crane cost ($/hr) : Yard Truck cost ($/hr) : 6.75 Overhead cost ($/hr) : 0 Containers to be unloaded : 8000 Containers to be loaded : 8000 ** Calculated results after simulation ** Hrs needed to load and unload ` containers (32000 TEUs): Productivity rate (TEU)/hr) : Hourly Cost : Unit Cost ($/TEU) : Statistics report at simulation time Figure 5-6: Double cycling simulation results It is clear that the productivity has been improved and the vessel turnaround time reduced. These results prove that the use of the YT double cycle is a beneficial and worthwhile. However, this is not yet enough improvement to justify replaces the YT single cycling by double cycling. Furthermore, the number of trucks is not yet optimized to handle containers using double cycling. For the above reasons and more, a sensitivity analysis was carried out to optimize the 110
129 fleet size in order to maximize productivity and minimize costs. This optimization also leads to further reducing the vessel turnaround time, the overall aim of this research. 5.3 Sensitivity analysis The sensitivity analysis is undertaken to evaluate the changes in model resources. For now, only the number of YTs is to be evaluated. The other resources (the number of QCs and YCs) will be assessed in the GA as lower and upper boundaries. To implement the sensitivity analysis on the other resources, a model must be developed to meet the processes. For instance, to add one more YC, another YC cycle must be developed and a probabilistic routing element introduced to connect the process. The number of YTs changes covers from 3 to 14 trucks in both single and double cycle. The resultsare compared and the optimum result can be observed Sensitivity analysis result After applying the sensitivity analysis on one resource, here the number of YTs for both single and double cycling, several results can easily be foreseen. These results vary from one to another in terms of their overall affect. The optimum single cycle productivity rate was almost 57 TEUs/hr when using 6 trucks, and was stable at that rate, while the optimum unit cost was 2.28 $/TEU when using 4 trucks. On the other hand, for double cycling, the optimum productivity rates were almost 92.5 TEUs/hr when using 9 trucks, with an optimum unit cost of about 2.8 $/TEU. It is obvious that the unit costs are not simple to use to decide which strategy is better. This led us to use a cost index to clearly monitor which option is most profitable, based on the productivity. The cost index is the ratio between unit cost and its corresponding productivity. The cost index is much better (lower) when using YT double cycling rather than single cycling. The cost index when using 9 trucks at double cycling is equal to 0.031and it is when using 5 trucks in single cycle. 111
130 Table 5-1: Sensitivity analysis comparisons between single and double cycling strategies Single Cycle Double Cycle Trucks Hrs needed to move 1600 Cont. Productivit y rate (TEUs/hr) Hourly cost ($/hr) Unit Cost ($/TEU Cost Index Total cost ($) Hrs needed to move 1600 Cont. Productivity rate (TEUs/hr) Hourly cost ($/hr) Unit Cost ($/TEU Cost Index Total cost ($) It is expected that clearer optimum results will be generated if the sensitivity analysis can be applied to the other resources (QCs and YTs). Single cycling and double cycling can now be compared in terms of productivity rates and cost savings. Even though more trucks are needed in double cycling, it is preferable to maximize productivity and minimize costs. To provide an integrated perspective, a broad comparison has been made, which includes turnaround time, productivity rate, unit cost and cost index. The quantitative comparisons are shown in Table 5-112
131 1to illuminate the difference between the two strategies. The sensitivity analysis implemented on trucks, varying from 3 to 14 trucks, provides a clear idea of the fluctuations and changes. Graphical comparisons were also developed in Table 5-1 (a, b, c and d) to cover the most important objectives: turnaround time, productivity rate, unit cost and cost index, respectively. Figure 5-7a shows the differences in vessel turnaround time between single and double cycling strategies. The time savings was more than 214 hours with a percentage of saving of 38%. This time savings is a result of productivity improvement which exceeded 35TEUs/hour in double cycling comparing to using single cycling for feasible solutions (see Figure 5-7b). The unit cost is not as clearly differentiated, but while it is almost the same in the two strategies, sometimes it is less when using single cycling, especially when using less than 7 trucks (see Figure 5-7c). However, this is not an optimal variable to use to compare between the two strategies unit cost, asthe double cycling strategy delivers higher productivity with the same cost. In other words, YT double cycling delivers the desired results with higher efficiency without increasing the unit cost. Using a cost index makes it easier to compare the cost and efficiency. Figure 5-7d shows that the cost index when using double cycling is lower than it is for single cycling, which supports the above statements. To summarize the comparisons; YT double cycling is more productive, efficient and economical than YT single cycling. For more confidence in the results and to be more specific, an optimization covering all the scenarios and testing all the probable resource exchanges was carried out and is described in the following sections. The optimum number of YTs is to be the base number for each QC in an optimization algorithm to insure that the QC is kept busy all the time. The number of YCs varies from 1 to 2.5 times the number of QCs, as stated in the literature. 113
132 Hours needed to move 32000TEUs Hours Single cycle Double cycle Number of YTs (a) Comparison between single and double cycling hours needed to load and unload (32000 TEUs) Productivity rate comparision between YT single and double cycling Productivity rate (TEU/hr) Number of YTs single cycle double cycle (b) Comparison between single and double cycling productivity rates 114
133 Unit cost comparsion Unit cost $/TEU Single Double Number of YTs (c) Comparison between single and double cycling unit costs Cost index Cost index Single cycle Double cycle Number of YTs (d) Comparison between single and double cycling cost index Figure 5-7: (a, b, c, and d) Sensitivity analysis output comparisons 115
134 5.4 Case study optimization model implementation overview The case study is set to have the same parameters as in the simulation case study in terms of vessel capacity, number of containers to be loaded and unloaded and the handling strategy. Three activities are scheduled to deliver the containers: YT unloading single cycling, YT double cycling and YT single cycling loading. The activities are set to start in sequence. The data (durations and costs) are generated from the case study data collection in chapter 4. Multiobjective GA optimization is implemented, employing two different software applications. GANetXL software, developed by a research team in the Water Engineering Department at the University of EXETER, UK (Savić et al. 2011): This software is an add-in for Microsoft Excel that uses GA to solve optimization problems and searches. Due to the inherent complications in selecting an absolute optimum alternative solution, four approaches are used to select the near-optimum solution. The four approaches are: Pareto frontier, TOPSIS, Cost index and re-simulation. Most of the approaches indicated the same alternative solution in each of the three scenarios of QC availability. Visual Basic for Applications code (VBA). This code is an algorithm for solving nonlinear problems VBA functions by relying primarily on randomly generated variables. The code randomly generates a value for every variable (between the minimum and maximum variable values) and then calculates both objective functions for that variable s values. The code generates a random answer and then checks if the answer is better than the last best-generated answer. Any improvement on the previous best-answer is determined by calculating the multiplication of the time and cost functions and comparing them to the previous best-answer's objective functions' multiplication. The code adds all the generated answers which improve on the existing optimal answer and 116
135 also randomly adds other answers to use in plotting the answer curve. End of editing in this version. New editing starts from here: 5.5 GA optimization A multi-objective genetic algorithm was applied to verify the near-optimum solution. A population size of 600 was selected to be tested. SolveXL software, which is a commercial version of GANetXl, was used for most of the optimization, but the GANet XL solver was later used to solve the multi-objective optimization. The variables were selected in each activity to be adequate to accomplish the task. The activities were selected to be of start-to-end duration. None of a preceding activity could start before the successor activity had finished. The activities are sequenced as follows: The YT double cycling activity is preceded by the YT single cycling unloading activity, and the YT single cycling loading activity is the successor activity of the YT double cycling activity. The task ends by loading the last container. The vessel turnaround time starts at minute zero and ends at the minute of loading the last container. The vessel will not depart until the last container is loaded GA variables and parameters Table 5-2 presents the input parameters for the GA, where: a, b, and c are the resource productivity in each activity, and W1, W2 and W3 are the hourly resource costs in each activity. Table 5-3 presents the GA input variables and the objective functions, where GA variables X n, Y n and Z n are the number of resources (QCs, YTs, and YCs, respectively) in each activity. 117
136 5.5.2 Objective functions a) Maximize 1- A 1, A 2, and A 3 are the fleet productivity for each activity, A= min (resource productivity in the chain for each associated activity). 2- Average productivity for the task = [total number of units to be moved (TEUs)/Total time (hr)]= TEU/hr. b) Minimize 1- B 1, B 2 and B 3 are the unit cost of the activity. B= [(summation hourly cost of each resource). (number of resources) + (overhead hourly cost)]/ (productivity (A)) = ($/hr)/ (TEU/hr)= $/TEU. Overhead cost estimated to be 25% of the resources hourly cost. 2- Total time (T total) T total = Summation of [(number of TEUs to be moved using single cycling unloading/ A 1 ), (number of TEUs to be moved using double cycling/ A 2 ) and (number of TEUs to be moved using single cycling loading/ A 3 )] = TEUs/(TEU/hr)= hours. 3- Total cost of the task = Summation of [(number of units to be moved in each activity (TEUs)) times ((unit cost of each activity ($/TEU))] = TEUs. ($/TEU)= $ 4- Average unit cost for the task Unit cost average= [Total cost ($) / (number of units to be moved (TEUs)]= ($/TEU) 118
137 5.5.3 GA constraints The objective functions are subjected to some constraints. Most of the constraints have been defined in chapter 3 (see section 3.7.4). In addition to those constraints, the following constraints must be considered: Number of units to be unloaded = TEU. (Equation 5.1) n j m ; ; Number of units/row n = 0,1,2,3.. n and j number of rows to be unloaded j= 1,2,3 m Number of units to be loaded = TEU. (Equation 5.2) ; Number of units/row, = 0,1,2,3. and ; number of rows to be loaded = 1,2, Configuration of GA using GANetXL As mentioned earlier in this chapter, the GA is a multi-objective optimization. To configure the multi objective GA optimization using GANetXL software, several steps must be implemented: 1- Select the type of optimization (single or multi objective); 2- Select the sized of the solution population. In this optimization problem, the population size is selected to be 600 solutions. Steps 1 and 2 are shown in Figure
138 Table 5-2: GA parameters Single cycling unloading Double cycling Single cycling loading Resources productivity a1 b1 c TEU/QC TEU/YC TEU/YT Resources hourly costs W1 W2 W $/hr/qc $/hr/yc 6.75 $/hr/yt Resources productivity a2 TEU/Pair QCs b2 TEU/Pair YCs C2 TEU/YT Resources hourly costs W1 $/hr/pair QCs 2W2 W $/Pair YCs 6.75 $/hr/yt Resources productivity a $/QCs Resources hourly costs W1 b W2 c TEU/YT W $/hr/qc $/hr/yc 6.75 $/hr/yt Single cycling Unloading GA optimization Variables Double cycling Single cycling Loading X1 Y1 Z1 X2 Y2 Z2 X3 Y3 Z3 Table 5-3: GA variables and objectives Single cycling Unloading Double cycling Objective functions Single cycling Loading Total task Max Min Max Min Max Min Min Min Max Min A1 TEU/hr B1 $/TEU A2 TEU/hr B2 $/TEU A3 TEU/hr B3 $/TEU T total hr C total $ Productivity TEU/hr Unit Cost $/TEU


139 Figure 5-8: GA configuration (steps 1and 2) 3- Assign a uniform random crossover rate (here it is 95%); and 4- Define the mutation rate, which is defined to be 5%. Figure 5-9 describes steps 3 and
 5.")

140 Figure 5-9: GA configuration (steps 3 and 4) GA excel sheet linking By linking to the excel sheet, all the objective functions, the variable functions and the constraints are defined as functions in the excel cells where the variables represented in the selected cells and their boundaries (upper and lower) are defined in the software. The cells represent the assigned objective functions, which have to be defined if they are to be maximized 122


141 or minimized. If there are any constraints, they must be assigned excel cells in the software to be considered. For some examples, see Figure Figure 5-10: GA configuration, excel sheet linking Any other options such as the number of runs, the number of generations and the display of the charts can be assigned according to the user requirements(see Figure 5-11 for two examples). 123


142 Figure 5-11: GA configuration, options GA results The GA is employed and feasible solutions are tabulated. Each feasible solution is considered as a chromosome. The numbers of resources in each chromosome are treated as genes. As in any 124
143 multi-objective optimization, more than one solution could be considered to be a near-optimum. For instance, some alternatives are near-optimum for productivity and thus the task time, but further from the optimum in costs and vice versa. In conclusion, it is difficult to select the overall nearest-optimum solution without some support from another method or tool. To solve this problem, several approaches are utilized to simplify the conflict or diminish the complexity in order to define the best alternative. Table 5-4 represents the GANetXl results where: ID is the chromosome identification number that solution; represents the individual alternative or G0, G1,.., G6 are the genes in each chromosome and represent the number of resources; G0, G1, G2 are the number of QCs, YTs and YCs used to unload containers in the first activity (YT single cycling unloading); G2, G3, and G4 are the number of pairs of QCs, YTs and YCs used to load and unload containers in the second activity (YT double cycling); G5, G6 and G7 are the number of QCs, YTs and YCs used to unload containers in the third/ last activity (YT single cycling loading); Pro 1, Pro2 and Pro 3 represent the fleet productivity in each activity mentioned earlier as A1, A 2 and A 3 ; and Unit cost 1, 2 and 3represent each activity unit cost, mentioned earlier as B 1, B 2 and B 3. The results are then ranked in order with the largest productivity first, which insures that the minimum vessel turnaround time is the first result that is feasible. Even though it is the manager who chooses the best alternative according to the organisation s perspective, it is still not easy to decide which chromosome or alternative is to be selected. More work is needed to be able to 125
144 select the best alternative. The next section contains of some approaches implemented for selection support. These approaches are implemented on a set of 20 chromosomes or alternatives from alternatives A to T. These alternatives are ordered in productivity criterion order with the higher productivity firs. For GA set alternatives details see Table Best alternative selection In this section, three different approaches are employed to identify the best solution: Pareto frontier, TOPSIS, cost index or decision index, utilized with EZStrobe simulation Pareto frontier The first approach is to invest the Pareto chart provided by the GANetXl software. Figure 5-12 show the results in Pareto frontier. Unfortunately, the feasible solutions are close to each other and it is difficult to decide which alternative is the best. For example, in Figure 5-12, the maximum productivity alternative, of ( TEU/hr), has the lowest time with hours but it does not offer the minimum unit cost. Meanwhile another alternative has the minimum unit cost at 2.16 $/TEU, and total cost, but a lower productivity rate of 281 TEU/hr and a longer the time to deliver the job, at about 113 hours compared to the other alternatives. In this case, if the manager s has the authorization to make a decision, it can be made so as to achieve the highestpriority aims. For example, a manager may need to finish the task early regardless of the cost, and so selects the most productive alternative, while if time is not an issue, then inevitably, the costs merit more attention. Therefore, Pareto alone is not sufficient to determine the preference alternative without priorities, which invites us to investigate other approaches. 126
145 Table 5-4: 1600 TEU vessel GA result sample ordered higher productivity first (16000 TEUs vessel) ID G0 G1 G2 G3 G4 G5 G6 G7 G8 Pro1 (TEU/hr) Unit cost 1 ($/TEU) Pro2 (TEU/hr) Unit cost 2 ($/TEU) Pro3 (TEU/hr) Unit cost 3 ($/TEU) Total time ( hr) Total Cost ($) Productivity total (TEU/hr) Unit cost average ($/TEU) 127
146 Table 5-5: TEU vessel GA set of twenty best alternatives selected (16000 TEUs vessel) ID G0 G1 G2 G3 G4 G5 G6 G7 G8 Pro1 (TEU/hr) Unit cost 1 ($/TEU) Pro2 (TEU/hr) Unit cost 2 ($/TEU) Pro3 (TEU/hr) Unit cost 3 ($/TEU) Total time ( hr) Total Cost ($) Productivity total (TEU/hr) A B C D E F G H I J K L M N O P Q R S T Unit cost average ($/TEU) 128


147 Figure 5-12: Pareto frontier sample results (16000 TEUs vessel) 129
148 5.6.2 TOPSIS As mentioned above, ranking the alternatives in productivity order makes it possible to monitor the set of best solutions. It is obvious that the best set alternatives are from A to T in alphabetical order. Subsequent alternatives offer no improvement or have less productivity and more unit cost than the selected alternative set. The TOPSIS approach is implemented on a set of alternative in two scenarios. a- First scenario Table 5-6: TOPSIS first scenario results (16000 TEUs vessel) ID C i a = [S i b /( S i b + S i a )] Ranking A B C D E F G H I J K L M N O P Q R S T In this scenario, only two criteria (average productivity and average unit cost) were selected and were fairly equal weights of 50% each. The alternative (B) was the furthest from the NOS and would be considered the winning alternative. These TOPSIS scenario results are shown in Table
149 b- Second scenario The targeted criteria in the second scenario are structured to include all eight objectives. These objectives are considered as the main criteria that affect the choice of the near optimum solutions. Table 5-7: TOPSIS second scenario results (16000 TEUs vessel) ID C i a = [S i b /( S i b + S i a )] Ranking A B C D E F G H I J K L M N O P Q R S T Different weights are distributed among the criteria in a way that agrees with the author s opinion. Alternative (B) was ranked the nearest to the POS and considered the winner. To more fully inform the decision, other approaches are implemented on the set of best solutions. Table 5-8 shows the results of the second scenario of TOPSIS approach. 131
150 5.6.3 Cost and decision index A decision index approach was implemented on the set of twenty top-ranked productivityordered alternatives from A to T. According to the results, alternative (D) was ranked with the lowest index, which can win in the competition for the best alternative. Table 5-9 shows the results. ID Average Productivity (TEU/hr) Table 5-8: Cost index results Average unit cos ($/TEU cost index Decision index Ranking A B C D E F G H I J K L M N O P Q R S T
151 5.6.4 EZStrobe simulation tool To save time, an EZStrobe simulation was applied to a set of four solutions ranked the highest from both the TOPSIS and Cost index results. Using the genes (G0, G1, G2, G8) of each of the selected alternatives, and data collected and analysed from the r terminal (resources cycle times), the EZStrobe simulation is re-run and the results of the simulation are summarised in Table Alternative (L) ranked the best solution. Table 5-9: EZStrobe Simulation results (16000 TEUs vessel) Alternative Total time Total cost Productivity Unit cost Rank D F H L Alternative ranking and final decision selection After carrying out the above simulations, a summary table ranking the best alternatives in each approach was created and is presented in table It is obvious that alternative (D) is the winner in three approaches, which allow it to be the selected alternative. The fleet size of this solution is distributed over the three activities as shown in Table 5-6This crew or fleet size is able to deliver the best performance, with the following results: Vessel turnaround time reduced to hours; The unit cost reduced to 2.24 $/ TEU; and The terminal productivity increased to TEU/hr. 133
152 It is also able to maximize the productivity of single cycle unloading up to 165 TEU/hr, of double cycling up to 332 TEU/hr and of YT single cycle loading up to 179 TEU/hr, while minimizing the unit cost of single cycle unloading activity down to 2.9 $/TEU, of double cycling down to 2.17 $/TEU and of single cycle loading to 2.3 $/TEU when 6 QCs are available. Approach Table 5-10: Selected approaches: comparative and ranking (for a TEU vessel) Pareto frontier TOPSIS scenario 1 TOPSIS Scenario 2 Cost decision index EZStrobe simulation D F H L Final rank The same procedure is implemented in other two QC-availability scenarios (for 4and 2 QCs available). The results are summarized in Table GA using stochastic productivity values Stochastic productivity is randomly determined using probability distributions that are statistically analyzed but are not always accurate predictors. The parameters are taken from the case study data analysis in chapter 4. The resources productivities in each activity considered the mean (µ) and its standard deviation (σ) (see Table 4-14). The GA algorithm and its procedure is implemented again, here on the productivities stochastic values instead of the productivities deterministic values; or the mean values of the resources productivities. The results reveal more productive alternatives (in terms of fleet size) and better values of unit costs compared to the deterministic productivity values. A sample of the best alternatives is shown in Table 5-13 for a scenario with 6 QCs available and vessel capacity of TEUs. 134
153 The results show that more than one output productivity value of time and unit cost can be generated from the same fleet solution (chromosome). For instance, solutions B, C, I, O, P and T have the same crew but different results. The same conflicting results occur with group solutions (A, K and N) and (D, L and R). This situation makes selecting the best solution more complicated. All of the results are true because of the probability distribution of resource productivity. Even though it is more optimistic to adapt the stochastic productivity results, only the deterministic productivity is considered in the verification and calibration of the developed strategy, the models and algorithms. The verification and calibration are discussed in the next chapter and will show the benefits and the improvement achieved by replacing YT single cycling with double cycling. The same procedure has been implemented on TEU-capacity vessels. The model outputs are summarized in the following tables in the same order as for the previous procedure, which includes the results, ranking, selecting approaches and final-decision selected alternative. These tables are labeled as: Table 5-14 to Table 5-12 and Figure For more details, please see the appendix. 135
154 QCs Availability Table 5-11: GA best alternative solutions according to QC availability and deterministic productivity values (16000 TEU vessel) Single cycling Unloading QCs YTs YCs Fleet size Double cycling Pairs QCs YTs Pairs YCS Single cycling Loading QCs YTs YCs Single cycling Unloading Double cycling performance Single cycling Loading Total task Max Min Max Min Max Min Min Min Max Min A1 TEU/hr B1 $/TEU A2 TEU/hr B2 $/TEU A3 TEU/hr B3 $/TEU T total hr C total $ Productivity TEU/hr 6 QCs QCs QCs Unit Cost $/TEU 136
155 Table 5-12: GA results using stochastic productivity values for 6 QCs availability and TEUs vessel capacity ID G0 G1 G2 G3 G4 G5 G6 G7 G8 Pro1 (TEU/hr) Unit cost 1 ($/TEU) Pro2 (TEU/hr) Unit cost 2 ($/TEU) Pro3 (TEU/hr) Unit cost 3 ($/TEU) Total time ( hr) Total Cost ($) Productivity total (TEU/hr) Unit cost average ($/TEU) A B C D E F G H I J K L M N O P Q R S T
156 ID G0 G1 G2 G3 G4 G5 G6 G7 G8 Table 5-13: GA result sample ordered higher productivity first (12000 TEU vessel) Pro1 (TEU/hr) Unit cost 1 ($/TEU) Pro2 (TEU/hr) Unit cost 2 ($/TEU) Pro3 (TEU/hr) Unit cost 3 ($/TEU) Total time ( hr) Total Cost ($) Productivity total (TEU/hr) Unit cost average ($/TEU) 138
157 ID G0 G1 G2 G3 G4 G5 G6 G7 G8 Table 5-14: GA set of twenty best alternative selected (12000 TEU vessel) Pro1 (TEU/hr) Unit cost 1 ($/TEU) Pro2 (TEU/hr) Unit cost 2 ($/TEU) Pro3 (TEU/hr) Unit cost 3 ($/TEU) Total time ( hr) Total Cost ($) Productivity total (TEU/hr) Unit cost average ($/TEU) A B C D E F G H I J K L M N O P Q R S T

158 Figure 5-13: Pareto Frontier simple results (12000 TEUs vessel) 140
159 Table 5-15 : TOPSIS first scenario results (12000 TEU vessel) ID C i a = [S i b /( S i b + S i a )] Ranking A 1 1 B C D E F G H I J K L M N O P Q R S T 0 20 Table 5-16: TOPSIS second scenario results (12000 TEU vessel) ID C a i = [S b b i /( S i + S a i )] Ranking A B C D E F G H I J K L M N O P
160 Q R S T ID Table 5-17: Cost index results (12000 TEU vessel) Average Productivity (TEU/hr) Average unit cos ($/TEU cost index Decision index Ranking A B C D E F G H I J K L M N O P Q R S T Table 5-18: EZStrobe Simulation results (12000 TEU vessels) Alternative Total time Total cost Productivity Unit cost Rank A B E G
161 Approach Table 5-19: Selecting approaches comparison and ranking (12000 TEU vessels) Pareto frontier TOPSIS scenario 1 TOPSIS Scenario 2 Cost decision index EZStrobesimulation A B E G Final rank 5.9 GA Visual Basic for Applications The optimization problem was solved using the Excel Visual Basic for Applications (VBA). A macro coding for the GA process was applied using visual basic language. The problem is solved and coded using the same inputs, variables, upper and lower variables boundaries, constrains and objective functions as were used in the GANetXL. A population size of 1024 was selected to be tested. The designed problem and its upper and lower boundaries are shown in Table The solutions were then generated by clicking on the solve button that appears on the Excel page. Some examples are presented in Figure The software will show all of the possible solutions and the operator can rank these solutions according to the maximum productivity or minimum unit cost. The solutions are then selected in the same way as when using the GANetXL software. A sample of the best solutions can be found in Table The nearest-optimum solution provides a vessel turnaround time of about 108 hours and near-optimum productivity of 296 TEU/hr. The code utilized to for solve the problem using VBA Excel is presented next. 143
162 QCs Availability QCs Availability Table 5-20: GA best alternative solutions according to QCs availability and deterministic productivity values (12000 TEU vessel) Single cycling Unloading QCs YTs YCs Fleet size Double cycling Pairs QCs YTs Pairs YCS Single cycling Loading QCs YTs YCs Single cycling Unloading Double cycling performance Single cycling Loading Total task Max Min Max Min Max Min Min Min Max Min A1 TEU/hr B1 $/TEU A2 TEU/hr B2 $/TEU A3 TEU/hr B3 $/TEU T total hr C total $ Productivity TEU/hr 6 QCs QCs QCs Unit Cost $/TEU Table 5-21: GA-designed problem using VBA Excel software for 6 QCs availability and TEUs vessel capacity Max. Min. Single cycling Unloading QCs YTs YCs Fleet size Double cycling Pairs QCs YTs Pairs YCS Single cycling Loading QCs YTs YCs Single cycling Unloading Double cycling performance Single cycling Loading Total task Max Min Max Min Max Min Min Min Max Min A1 TEU/hr B1 $/TEU A2 TEU/hr B2 $/TEU A3 TEU/hr B3 $/TEU T total hr C total $ Productivity TEU/hr Unit Cost $/TEU 144

163 Figure 5-14: VBA optimization screen shot 145
164 QCs Availability Table 5-22: GA sample results using VBA Excel software for 6 QCs availability and TEUs vessel capacity Single cycling Unloading QCs YTs YCs Fleet size Double cycling Pairs QCs YTs Pairs YCS Single cycling Loading QCs YTs YCs Single cycling Unloading Double cycling performance Single cycling Loading Total task Max Min Max Min Max Min Min Min Max Min A1 TEU/hr B1 $/TEU A2 TEU/hr B2 $/TEU A3 TEU/hr B3 $/TEU T total hr C total $ Productivity TEU/hr Unit Cost $/TEU
165 VBA Excel coding As introduced earlier in section 5.4, VBA code is Excel-based software-designed to solve nonlinear problems. To build the algorithm, the parameters and the objective functions are located in the Excel cells then the constraints are defined as upper boundaries, termed maximums, and lower boundaries termed minimums. According to the written code, the software will solve the problem by testing all of the probable solutions according to the pre-defined population. A special thank you is extended to Mr. Mohammad Kbeili for helping the author in writing this code. A sample of the code is represented on this page, and the rest of the code can be found in Appendix X. 1. Sub FindSolution() 2. ' This code aims to solve a Non-Linear programming problem ' Definte variables. Lastrow: stores the value of the last row, b: binary value used to determine for loop direction and step 5. ' l,m,n,o: Variables used in Looping between values 6. Dim Lastrow, b, i, l, m, n, o As Integer ' Define Variables. Obj: Stores the temporary objective function values. Sol: Stores th e current optimal solution 9. ' u,j,k,s,g,f: Store problem parameters, Min/Max: Store the lowest and highest bounds o f each variable 10. Dim Obj(23), Sol(23), u(3), j(3), k(3), s(3), g(3), f(3) As Double 11. Dim Min(), max() As Variant ' Turn off automatic formulat recalculation in the spreadsheet (To improve processing s peed) 14. Application.Calculation = xlcalculationmanual ' Turn off screen updating (To improve processing speed) 17. Application.ScreenUpdating = False ' Clear all cells below row (11) to make room for new answer 20. With Rows(11 & ":" & Rows.Count).Delete 21. End With ' Identify last row with data in the spreadsheet 24. Lastrow = ActiveSheet.Range("B" & Rows.Count).End(xlUp).Row ' Store all minimum variable values (constraints) into array 27. Min = Range("B10:X10") 28. ' Store all maximum variable values (constraints) into array 147
166 5.10 Summary This chapter detailed the implementations of the simulation model and the GA multi-objective optimization based on the developed strategy. The simulation model was applied on a theoretical case study, and a sensitivity analysis using that simulation was then applied to that theoretical case study. The simulation shows that the model contributes to a powerful analysis and has the ability to solve the problem. A GA multi-objective optimization was applied to a real case study via two different software applications (SolveXL in its GANetXL version and VBA Excel). The GANetXL solver was applied using both deterministic and stochastic productivity data. A conflict in selecting the nearest-optimum solution using multi-objective optimization was identified. Several approaches were employed to assist in making the best decision in selecting the nearest-optimum solution. The best solutions were then assigned and the fleet size or crew that most improves the container terminal was defined. This optimum crew will minimize vessel turnaround time with the most reasonable cost and near optimum-productivity. 148
167 Chapter 6: Benefits, Verification and Calibration 6.1 Benefits of using YT double cycling strategy It is clear that there are many advantages to be gained by replacing YT single cycling by double cycling. These benefits can be realised by comparing the two strategies productivity improvement, measured in terms of time saving, cost saving and resource deployment and scheduling (see Table 6-1). These benefits are summarized in the following seven points: 1- Productivity improvements The proposed strategy shows productivity improvements of between 89 and 243 TEUs/hr when using YT double cycling, while productivity ranges between 61 and 178 TEUs/hr when using single cycling. The range of productivity improvement depends on the QC availability for vessels of TEUs, and it is more pronounced for larger vessels. 2- Vessel turnaround time reduction of more than 33% in most cases. 3- Unit cost savings of a maximum of 10%, regardless of the cost savings resulting from time reduction. 4- Another financial benefit is the saving of vessel idle time. From the perspective of shipping companies and based on her study of (Notteboom 2004); Goodchild states that Intercontinental freight rates are estimated at $.045 per TEU-km. At this rate, each hour of idle vessel time costs the ship operator $10,000 (Goodchild & Daganzo 2005). 5- As the double cycling improves the costs, the benefits listed above are improved even more if the number of double cycles is maximized. 149
168 6- The number of cycles of YTs is decreased compared to those of the YT single cycle, where YT empty journeys are minimized. 7- Some resources can be scheduled for another job when not needed. For instance, some YTs are not needed when using single cycle loading and unloading. This also applies to the number of QCs and YCs. 6.2 Model Verification and Calibration QC productivity is one of the methods to measure container terminal productivity, unit and its unit of measurement are the number of TEUs/hr or Lifts/hr. Another method is the vessel turnaround time; the time a vessel spends at berth to fully exchange its targeted containers. This is equal to the summation of time the QCs take to discharge and load the vessel. The relation between vessel turnaround time and QC productivity is expressed in Table 6-2, Bartošek & Marek (2013) and in Table 6-3(Jordan 2002). The tables built on the variables and coefficients according to Bartošek & Marek data and imperical calculations. Bartošek & Marek data includes the follwoing: 1- Post-Panamax QCs can produce 1.75 TEU per lift; 2- All terminals are able to produce from 70% to 80% of the maximum computed productivity; 3- There is a loss of QC productivity that must be considered; 4- Transhipment vessels (large vessels) can be served by 6-8 QCs; and 5- Feeders (smaller vessels) can be served by only 1-2 QCs. 150
169 QCs Availability QCs Availability Table 6-1: YT double cycling improvements compared to single cycling(12000 TEUs vessel capacity) Single cycling Unloading QCs YTs YCs Fleet size Double cycling Pairs QCs YTs Pairs YCS Single cycling Loading QCs YTs YCs YT double cycling strategy Single cycling Unloading Double cycling performance Single cycling Loading Total task Max Min Max Min Max Min Min Min Max Min A1 TEU/hr B1 $/TEU A2 TEU/hr B2 $/TEU A3 TEU/hr B3 $/TEU T total hr C total $ Productivity TEU/hr 6 QCs QCs QCs Unit Cost $/TEU Single cycling Unloading QCs YTs YCs Fleet size Double cycling Pairs QCs YTs Pairs YCS Single cycling Loading QCs YTs YCs YT single cycling strategy Single cycling Unloading Double cycling performance Single cycling Loading Total task Max Min Max Min Max Min Min Min Max Min A1 TEU/hr B1 $/TEU A2 TEU/hr B2 $/TEU A3 TEU/hr B3 $/TEU T total hr C total $ Productivity TEU/hr 3 QCs QCs QC Unit Cost $/TEU 151
170 Table 6-2: Comparison of quay crane productivity (Bartošek& Marek, 2013) Lifts per hour Vessel size ( TEU) Cranes Vessel turnaround time (hours) 8, , , Table 6-3: Vessel Turnaround Time vs- Lifts per Hour (Jordan, 2002) Vessel size (TEU) 6,000 8,000 10,000 12,000 Cranes Lifts per hour Vessel turnaround time (hours) Counting vessel turnaround time To implement the theory to compute the vessel turnaround time for a vessel, the following steps can be followed: 1- Quay crane per lifts per hour = Q l lift/hr; 2- QC productivity per lift = Qp TEU/lift; 3- QC productivity per hour= Qhp = (Q l ) * (Qp)= TEU/hr; 4- QCs productivity per vessel= nq * Qhp; 152
171 5- Vessel turnaround time V tt = time to unload imported TEUs + time to load exported TEUs, where: a) Time to unload imported TEUs = number of TEUs / (nq * Qhp); and b) Time to load exported TEUs= number of exported TEUS/ (nq * Qhp); Then, Vtt = ( imported TEUs +exported TEUs)/ (nq * Qhp), when unloading QCs productivity = loading QCs productivity; 6- C g = percentage of vessel exchange containers; and 7- I g = percentage of maximum Qhp that QCs can make Example To prove the results summarized in Table 6-2 and Table 6-3, the following steps and calculations based on the previous method were carried out. In the above tables, the details required for implementation: Vessel capacity = TEU Vessel exchanges 75% of its containers = I g * ( ) Units to be exchanged = 24000*0.75= TEU. (Equation 6.1) Q l = 30 lifts/hr Qp= 1.75 TEU/lif QhP= 30* 1.75=52.5 TEU/hr. (Equation 6.2) Gross Qhp = I g * Qhp= 0.7 * 52.5 = TEU/hr/QC. (Equation 6.3) Number of QCs =6 cranes V tt = 18000/(6*36.75)= (Equation 6.4) Adding 5% to the total time to adjust for QC productivity loss (such as delays, moves between rows etc ), 153
172 Adjusted turnaround time = 81.63* 1.05= hours ~ 86 hours For QCs to achieve 40 lifts/hr: Adjusted turnaround time = [(24000*0.75)/( 40*1.75*0.7*6)]* 1.05 = 64.2 hours. (Equation 6.5) For QCs to achieve 50 lifts/hr Adjusted turnaround time = [(24000*0.75)/( 50*1.75*0.7*6)]* 1.05 = 51.4 hours. (Equation 6.6) Table 6-4 shows how Bartošek (2013) and Jordan (2002) summarized and calculated the vessel turnaround times. 6.3 Vessel turnaround time Verification and Calibration Now, we are able to verify and calibrate our work using the previous theory to calculate the vessel turnaround time and compare it with the simulation- optimization model results. This research applies the developed strategy on two vessel capacity types: large vessels of TEUs and mega vessels with TEU capacity. Since we are not able to use more than 3 pairs of QCs to serve a vessel, we recalculate the target vessel turnaround time by replacing the 6QCs by 3QCs. The QCs will be distributed on the vessel as; 3 QCs to discharge and 3 QCs to load the vessel. We are able to verify our work using the previous theory to theoretically calculate the vessel turnaround time and compare it with the simulation- optimization models results. The calculation procedure is given below: Adjust for the number of QCs Turnaround time = [(24000*0.75)/( 30*1.75*0.7*3)]* 1.05 = hours. (Equation 6.7) 154
173 However, the QC productivity per lift = 2 TEUs according to the case study data.. Next, adjust for QCp= 2: Turnaround time = [(24000*0.75)/( 30*2*0.7*3)]* 1.05 = hours. (Equation 6.8) We can also calculate the QC lifts per hour= lifts/hour, and so the next step is to adjust for QC lifts per hour: Turnaround time = [(24000*0.75)/( 27.66*2*0.7*3)]* 1.05 = hours. (Equation 6.9) We assume that the terminal reaches 100% of its productivity. Vessel capacity (TEU) Table 6-4: Calculated vessel turnaround times based on Bartošek 2013 and Jordan 2002 TEU exchange % QCs QC productivity per lift (TEU/lift) QC lifts per hour terminal productivity % QC productivity lose % Vessel turnaround time (hours)
174 Turnaround time = [(24000*0.75)/( 27.66*2*1*3)]* 1.05 = hours. (Equation 6.10) And finally, we assume the exchanging of containers to be 100%; so that Turnaround time = [(24000*1)/(27.66*2*1*3)]* 1.05 = hours. (Equation 6.11) Two scenarios are deployed to verify and calibrate the models; one considers the QC lifts limit as the limit to its unloading lifts/hr (see Table 6-5).and the other is limited to its loading lifts/hr (see Table 6-6). Vessel capacity (TEU) Table 6-5: Model Verification and Calibration (QC lifts limit to its unloading lifts/hr) TEU exchange (%) No. QCs QC product. per lift (TEU/lift) QC lifts per hour Terminal product. (%) QC product. lose ( %) Calculated turnaround time (hr) Model turnaround time (hr) Time improve ment (%) Vessel capacity (TEU) Table 6-6: Model Verification and Calibration (QC lifts limit to its loading lifts/hr) TEU exchange (%) No. QCs QC product. per lift (TEU/lift) QC lifts per hour Terminal product. (%) QC product. lose ( %) Calculate d turnaround time (hr) Model turnaround time (hr) Time improve ment (%)
175 6.4 Summary This chapter verified the benefits of replacing YT single cycling by double cycling. It is clear that the use of YT double cycling improves the productivity and minimizes the cost associated with container handling by minimizing vessel turnaround time. Investing the unused resources in a predefined time is an indirect benefit that can be added to the direct benefits. For verify and calibrate of the developed strategy, simulation and optimization models were utilized, as well as the optimization algorithm. Using the vessel turnaround time and QC productivity as the results to compare is a flawed approach, because the saving on time can be achieved only by increasing productivity and optimizing the fleet size. The introduced strategy and the developed models proved that reasonable time savings can be achieved, as proved by comparisons with some previous findings and studies. 157
176 Chapter 7: Conclusion and future work 7.1Summary This research sets forth the following main points: Global trade is growing exponentially, especially for goods transported across the seas. This has driven the shipbuilding industry to accelerate the development of transport vessels. To keep pace with developments in the shipbuilding industry in terms of speed and capacity, container terminals must also improve their productivity. Container terminal customers (shipping companies) believe that Vessels do not make money while berthing, which means that minimizing vessel turnaround time is crucial to satisfy these customers. It is clear that improving the productivity of any container terminal s resources leads to the improvement of the other elements productivity and of terminal productivity as a whole. QC double cycling has been introduced recently to improve container terminal productivity and minimize vessel turnaround time. This work introduces a new strategy that implements double cycling on YTs to improve container terminal productivity. This new strategy for handling containers has been modeled, tested and verified. The simulation indicates that a reasonable improvement in maximizing productivity while minimizing hourly and unit costs can be achieved. A sensitivity analysis, performed as a part of the simulation and feasibility assessment, revealed the efficiency of the new strategy. Multi-objective optimization is part of the research focused on optimizing fleet sizes, based on the objective functions of time and cost. Gas were used as the optimization tool for implementing and verifying this handling strategy, based on the investigation to date. Some selection approaches, based on the GA results, were implemented to provide decision makers a 158
177 degree of confidence in selecting the nearest optimum solution. The results were verified based on some previous findings, revealing the effectiveness of the strategy and the efficiency of the simulation model and optimization algorithm. 7.2 Conclusion A set of conclusions can be drawn from developing the YT double cycling in container handling, using simulation modeling and a GA optimization algorithm. Reducing vessel turnaround time can be achieved by improving one or more resources, factors or handling strategies in container terminals. Implementing YT double cycling with the conditions that two (or each pair of) QCs are linked to work together, that there is a start-up period with YT single cycling to create enough space on the vessel before switching to double cycling, and linking the functioning of two (or each pair of) YCs eliminates YT empty journeys and accelerates vessel turnaround time. To be able to mimic the realty of implementing YT double cycling, a simulation model was developed using EZStrobe simulation. The simulation model reveals a productivity improvement of about 38% overall and about 19% per QC. In terms of cost index (cost/productivity), savings of about 29% could be achieved by utilizing optimum alternatives in most cases. Based on the model s verification and comparisons with previous published findings, the optimization model indicates that YT double cycling improves the productivity and saves vessel turnaround time in a range of 26% to 38% compared to traditional YT single cycling for large vessel of TEU capacity, and this improvement will be even higher for mega vessels of TEU capacity The optimization model and algorithm 159
178 allows terminal management to select the most effective fleet size to be assigned in each of the three activities: YT single cycle unloading start-up, YT double cycling and YT single cycle loading activities. Increasing the number of double cycles is key to guarantee the best results and thus the greatest improvements in container terminal productivity, vessel turnaround time and cost savings. Employing a multi-objective GA is worthwhile, but in some situations other supporting approaches are required to select the optimum solution. Pareto frontier, TOPSIS, and Cost Index are powerful approaches that can solve the multi-objective problem with the EZStrobe simulation tool. Comparisons with previous YT double cycling results how that this method can improve productivity to achieve minimum TEUs vessel turnaround times of 109.5, and hours, depending on QC availability, which are more than 45% shorter than previous achievements. Productivity is thus improved accordingly, achieving a minimum TEUs vessel turnaround time of hours depending on QC availability for a time savings of about 35%-44% compared to other approaches. Fleet size optimization offers the opportunity to invest any un-needed resources they can be rescheduled to do another job. This can be considered as an extra gain and benefit, one that may contribute to reducing another vessel s turnaround time and thus improving terminal productivity. 7.3 Research limitations The research has some weaknesses and limitations which should be overcome to allow this method to be even more beneficial: 160
179 1- The research does not cover the impact of the developed strategy on other resources and areas such as YC, SY and the terminal s land side (the gate and land transportation). 2- The data was collected from only one container terminal; more data collection from other terminals is needed to make the research more reliable. 3- The cost data collected does not cover all data associated with container handling and so does not reflect an accurate overview of the benefits of the strategy and developed models. 4- In the implementation of TOPSIS approach, the parameter weights are suggested by the author s desire for fairness and reasonability. A survey or experts questionnaire will add value to the TOPSIS results. 5- The research does not consider the SY truck road congestion and how this would affect the use of the maximum number of trucks. 6- It would be more efficient if the research could evaluate the benefits of the time savings achieved, the cost savings results from this time reduction, the percentage of the increases of containers transhipped and the benefits of early vessel departure. 7.4 Research Contribution This research is considered to be of practical value in modeling the container handling process and in understanding the impacts of various factors on container terminal productivity in terms of time and cost. One aspect of its practicality is that the model will be able to be simulated using a simple simulation tool. The model will contribute to optimizing fleet sizes to maximize productivity and thereby minimize vessel turnaround time and the associated hourly costs. Both the simulation and its resulting optimization will provide managers and decision makers with 161
180 obvious criteria for selecting the optimal container handling method. The following are the most important research contributions: An improved understanding of each factors impact on container terminal productivity; Replacing the single cycle strategy by double cycling to reduce vessel turnaround time by reducing the empty yard truck journeys; Providing decision makers in the scheduling and planning stages with a simulation of the handling container process that closely mimics reality; Optimizing fleet sizes to achieve the maximum productivity and lower hourly costs; Providing easy and effective models in both simulation and optimization to enable container terminal mangers to determine the best solutions for the most time and costefficient handling of containers; and The developed strategy will add value on global trade supply chain. The time reduction contributes to accelerate and increase the sales volume in general. Most reputable suppliers will accrue the benefits from this time reduction which will motivate suppliers to improve their productivity to meet the global trade demands. 7.5 Recommendation for future work The research introduced a new strategy for container handling. The strategy is simulated and optimized to verify the improvements in container terminal productivity. The simulation model and the optimization algorithm are powerful enough to solve the multi-objective problem and a tangible productivity improvement is achieved. This work solves the problem but it does not cover all the needs in container terminal productivity improvement. There is room for more work 162
181 to compliment and reinforce the robustness of this strategy; some suggested research avenues are listed below: 1- This research focuses only on the sea side. To be more affective, adding the land side to this strategy with be necessary to more completely achieve the objective of this research. A container terminal is divided into three areas, the waterside, the storage yard and the gate. Two-directional transportation linking those areas is divided into two types: transportation between the waterside and the storage yard, and transportation between the gate and the storage yard. Container terminal productivity is influenced by the productivity of each area. Improving one area s productivity will impact positively on the other areas. To fully assess the optimum benefit of employing YT double cycling, the impact of the developed strategy on the other areas and the accumulated benefits in both productivity and cost savings must be evaluated. 2- This research requires more complete cost data to be collected to cover the objective cost optimization in a standard and efficient manner. The costs associated with handling containers are multiple and vary from one terminal to another, as well as from one season to another. Direct and indirect costs should be included to assist decision makers in deciding which strategy is most profitable. 3- Every type of productive work is associated with risks. Risks can impact the developed strategy depending on their type, value and indirect impacts. For instance, a resource collapse, especially of resource with limited availability, may affect to possibility of employing the YT double cycle strategy, which needs more resources to be working at a time than single cycling. Adding risk assessment and evaluation will make the research more realistic. 163
182 4- Large and mega vessels are fed by small vessels called feeders. It is more challenging to handle containers from and into feeders instead of the temporarily storing the containers in the SY. Managing the handling of containers directly from feeders to a large or mega vessel is a complicated process. If this process can be implemented, the value of the associated cost savings and time reduction is expected to be significant compared to the practice of storing the containers temporarily in a storage yard. These benefits would include: a- No need for YCs, saving highly-skilled labour and resource costs; b- Provides more space in SY and reduces SY costs, even reducing SY size a major benefit to space-constrained port cities; c- Reduces YT cycle times due to shorter distances to travel on the shore line rather than trips to the SY. This could accelerate the vessel turnaround time and cut the associated costs. d- Containers can be delivered to customers immediately upon arrival, accelerating global trade compared to the initial storing of containers. 5- The research would be more effective if it could translate the time savings to cost savings and profits, especially for the shipping companies. It can be concluded that the time savings when using YT double cycle strategy is greater than the cost reduction. In the economic sector Time is money. Translating the saved time into cost savings will provide a clear vision of how beneficial the developed strategy could be. Furthermore, the time reduction affects the shipping companies profits and accelerates the global trades in general. Many other suppliers in the global trade supplier chains will gain 164
183 profits and improve their productivity as a result of this time reduction and accompanying acceleration. 165
184 References Ahmed, E., Zayed, T. & Alkass, S., 2014a. Improving productivity of yard trucks in port container terminal using computer simulation. 31st International Symposium on Automation and Robotics in Construction and Mining, ISARC Proceedings, Ahmed, E., Zayed, T. & Alkass, S., 2014b. Simulation model of yard truck double cycling to improve container terminal productivity. 16th International Conference on Harbor, Maritime and Multimodal Logistics Modelling and Simulation, HMS 2014, 1 9. Aykagan, Berth and Quay Crane Scheduling : Problems, Models and Solution Methods. Georgia Institute of Technology. Bartošek, A. & Marek, O., Quay Cranes in Container Terminals. Transactions on Transport Sciences, 6(1). Bazzazi, M., Safaei, N. & Javadian, N., A genetic algorithm to solve the storage space allocation problem in a container terminal. Computers and Industrial Engineering, 56(1), Beškovnik, B. & Twrdy, E., Planning organization and productivity simulation tool for maritime container terminals. Transport, 25(3), Bierwirth, C. & Meisel, F., A survey of berth allocation and quay crane scheduling problems in container terminals. European Journal of Operational Research, 202(3),
185 Carlo, H.J., Vis, I.F.A. & Roodbergen, K.J., 2014a. Storage yard operations in container terminals: Literature overview, trends, and research directions. European Journal of Operational Research, 235(2), Carlo, H.J., Vis, I.F.A. & Roodbergen, K.J., 2014b. Transport operations in container terminals: Literature overview, trends, research directions and classification scheme. European Journal of Operational Research, 236(1), Cheong, C.Y. et al., Multi-objective optimization of large scale berth allocation and quay crane assignment problems. Conference Proceedings - IEEE International Conference on Systems, Man and Cybernetics, Cordeau, J-F. Legato, P, Mazza, R. & Trunfio R., Simulation-based optimization for housekeepingin acontainer transshipment terminal. Computers &Operations Research (53), Daganzo, C.F., The cranescheduling problem. Transportation Research Part B Methodological., 23 B(3), Duinkerken, M.B., Evers, J.J.M. & Ottjes, J. a, A simulation model for integrating quay transport and stacking policies on automated container terminals. Modelling and Simulation 2001, (June), Goodchild, a. V. & Daganzo, C.F., Crane double cycling in container ports: Planning methods and evaluation. Transportation Research Part B: Methodological, 41,
186 Goodchild, A. & Daganzo, C., Crane double cycling in container ports: affect on ship dwell time, California, Berkeley. Goodchild, A. V., Crane Double Cycling in Ports: Algorithms, Evaluation, and Planing. University of California, Berkeley. Goodchild, A. V. & Daganzo, C.F., Double-Cycling Strategies for Container Ships and Their Effect on Ship Loading and Unloading Operations. Transportation Science, 40(4), Guenther, H.-O., Grunow, M. & Lehmann, M., AGV dispatching strategies at automated seaport container terminals. Operations Research and Its Applications, 5, Haupt, R.L., Haupt, S.E. & Wiley, a J., Algorithms Practical Genetic Algorithms, Hwang, C.-L., Lai, Y.-J. & Liu, T.-Y., A new approach for multiple objective decision making. Computers & Operations Research, 20(8), Iason, Gk., Infrastructure Performance Assessment of Subway Networks. Concordia University, Montreal, Canada. Imai, A., Chen, H.C., et al., The simultaneous berth and quay crane allocation problem. Transportation Research Part E: Logistics and Transportation Review, 44, Imai, A., Nishimura, E. & Papadimitriou, S., Berthing ships at a multi-user container terminal with a limited quay capacity. Transportation Research Part E: Logistics and Transportation Review, 44,
187 Imai, A., Nishimura, E. & Papadimitriou, S., Marine container terminal configurations for efficient handling of mega-containerships. Transportation Research Part E: Logistics and Transportation Review, 49(1), Jordan, M., Quay crane productivity. In Terminal Operation Conference Americas, Miami, FL, USA. Miami, FL. Katalinic, E.B., Selection of as / rss by using fuzzy topsis method.annals of DAAAM for 2011 & Proceedings of the 22nd International DAAAM Symposiu, 22(1), Lane, A., Charles M., The impact of ever larger vessels on terminals, Mega Ship Ready, Edition 64-November 2014, Lee, D.-H. & Wang, H.Q., An approximation algorithm for quay crane scheduling with handling priority in port container terminals. Lee, D.H., Wang, H.Q. & Miao, L., Quay crane scheduling with non-interference constraints in port container terminals. Transportation Research Part E: Logistics and Transportation Review, 44, Lee, L.H. et al., An optimization model for storage yard management in transshipment hubs. Container Terminals and Cargo Systems: Design, Operations Management, and Logistics Control Issues, 561, Lee, T.-W., Park, N.-K. & Lee, D.-W., A simulation study for the logistics planning of a container terminal in view of SCM. Maritime Policy & Management, 30(January 2015),
188 Liang, C., Huang, Y. & Yang, Y., A quay crane dynamic scheduling problem by hybrid evolutionary algorithm for berth allocation planning. Computers and Industrial Engineering, 56(3), Linn, R. et al., Rubber tired gantry crane deployment for container yard operation. Computers and Industrial Engineering, 45, Liu, C.I. et al., Automated guided vehicle system for two container yard layouts. Transportation Research Part C: Emerging Technologies, 12, Liu, C.-I., Jula, H. & Ioannou, P.A., Design, simulation, and evaluation of automated container terminals. IEEE Transactions on Intelligent Transportation Systems, 3(1), Meisel, F. & Wichmann, M., Container sequencing for quay cranes with internal reshuffles. OR Spectrum, 32, Moccia, L. et al., A branch-and-cut algorithm for the quay crane scheduling problem in a container terminal. Naval Research Logistics, 53, Murty, K., Yard crane pools and optimum layouts for storage yards of container terminals. Journal of Industrial and Systems Engineering. Murty, K.G., Yard Crane Pools and Optimum Layouts for Storage Yards of Container Terminals. Nature, 1(3),
189 Nam, K.-C., Kwak, K.-S. & Yu, M.-S., Simulation Study of Container Terminal Performance. Journal of Waterway, Port, Coastal, and Ocean Engineering, 128(June), Nguyen, V.D. & Kim, K.-H., Minimizing Empty Trips of Yard Trucks in Container Terminals by Dual Cycle Operations. Industrial Engineering and Management Systems, 9(1), Pap, E. et al., Optimization of container quay cranes operations. In SISY IEE 9th International Symposium on Intelligent Systems and Informatics, Proceedings Park, Y.-M. & Kim, K.H., A scheduling method for Berth and Quay cranes. OR Spectrum, 25(1), Petering, M. & Murty, K., Simulation analysis of algorithms for container storage and yard crane scheduling at a container terminal. Proceedings of the Second International Intelligent Logistic Systems Confrence. Petering, M.E.H. & Murty, K.G., Effect of block length and yard crane deployment systems on overall performance at a seaport container transshipment terminal. Computers and Operations Research, 36, Roshandel, J., Miri-Nargesi, S.S. & Hatami-Shirkouhi, L., Evaluating and selecting the supplier in detergent production industry using hierarchical fuzzy TOPSIS. Applied Mathematical Modelling, 37(24),
190 S. M. Homayouni, Using simulated annealing algorithm for optimization of quay cranes and automated guided vehicles scheduling. African Journal of Business Management, 6, Sammarra, M. et al., A tabu search heuristic for the quay crane scheduling problem. Journal of Scheduling, 10, Savić, D. a., Bicik, J. & Morley, M.S., A DSS generator for multiobjective optimisation of spreadsheet-based models. Environmental Modelling and Software, 26(5), pp Steenken, D., Voss, S. & Stahlbock, R., Container terminal operation and operations research-a classification and literature review. OR Spectrum, 26, Tavakkoli-Moghaddam, R. et al., An efficient algorithm for solving a new mathematical model for a quay crane scheduling problem in container ports. Computers and Industrial Engineering, 56(1), Vis, I.F. a & De Koster, R., Transshipment of containers at a container terminal: An overview. European Journal of Operational Research, 147, Wang, Z. X. Chan Felix, T. S. Chung, S. H & Niu, B., Minimization of Delay and Travel Time of Yard Trucks in Container Terminals Using an Improved GA with Guidance Search. Mathematical Problems in Engineering, 2015, 1-12 Yap, W.Y. & Lam, J.S.L., million-twenty-foot-equivalent-unit container port? Sustainability issues in port and coastal development. Ocean and Coastal Management, 71,
191 Yong, D., Plant location selection based on fuzzy TOPSIS. International Journal of Advanced Manufacturing Technology, 28, Zayed, T. & Halpin, D., Simulation of concrete batch plant production. Journal of Construction Engineering and Management. Zhang, C. et al., Storage space allocation in container terminals. Transportation Research Part B: Methodological, 37, Zhang, H. & Kim, K., Maximizing the number of dual-cycle operations of quay cranes in container terminals. Computers & Industrial Engineering, (56), Zhang, J.L. & Qi, X.W., Induced interval-valued intuitionistic fuzzy hybrid aggregation operators with TOPSIS order-inducing variables. Journal of Applied Mathematics, Zhang, R. Zhihong, J Ma, Y. & Luan, W., Optimization for two-stage double-cycle operattions in container terminals. Computer & Industrial Engineering (83),
192 Appendix A Table A- 1: YC discharging cycle and productivity lift the cont. from the YT loaded forward move to SY Load the Cont. on SY Empty back word move to the YT Total time (min) Number of Moves/hr Productivity TEU/hr
193 Cycle ID empty forward move to the SY Table A- 2: YC cycle times and productivity Lift the containe r from SY Loaded backward move to the YT Load the containe r on the YT Total cycle time (min) Number of moves/ cycle Productivit y (TEU/hr)
194 Cycle ID Loading the truck at QC2 Table A- 3: YT unloading cycle time and productivity Loaded move from QC2-YC2 Discharge the truck at YC2 Empty back move from YC2 to QC2 Total cycle time Number of cycles/hr Productivity (TEU/hr) Load the YT at YC1 Table A- 4: YT loading cycle time and productivity Loaded move to QC1 Discharge the YT at QC1 Empty` back move YC1 Total cycle time Number of cycles/hr Productivity (TEU/hr)
195 Table A- 5: YT double cycle, cycle times and productivities cycle ID Load the YT at YC1 Loaded move to QC1 Discharge the YT at QC1 Empty move from QC1 to QC2 Loading the truck at QC2 Loaded move to YC2 Discharge the truck at YC2 empty back move from YC2 to YC1 Total cycle time Number of cycles/hr Productivity (TEU/hr)


196 Figure A- 1: QC loading Discharge the YT Figure A- 2: QC loading forward loaded move 178


197 Figure A- 3: QC loading Load the container on vessel Figure A- 4: QC loading, empty back move 179


198 Figure A- 5: QC loading productivity Figure A- 6: QC discharging empty forward move 180


199 Figure A- 7: QC discharging lift container from vessel Figure A- 8: QC discharging loaded back move 181


200 Figure A- 9: QC discharging Load container on YT Figure A- 10: QC discharging productivity 182


201 Figure A- 11: QC doubly cycle productivity Figure A- 12: YC loading empty forward move 183


202 Figure A- 13: YC loading lift container from SY Figure A- 14: YC loading Loaded back ward move 184


203 Figure A- 15: YC loading load the container on the YT Figure A- 16: YC loading productivity 185


204 Figure A- 17: YC discharging, lift container from YT Figure A- 18: YC discharging, loaded forward move 186


205 Figure A- 19: YC discharging, load the container on SY Figure A- 20: YC discharging, empty back ward 187


206 Figure A- 21: YC unloading productivity Figure A- 22: YC double cycle productivity 188


207 Figure A- 23: YT unloading, empty move from SY to QC Figure A- 24: YT single cycle unloading, loaded move from QC to SY 189


208 Figure A- 25: YT loading, loaded move from SY to QC Figure A- 26: YT loading, empty move from QC to SY 190


209 Figure A- 27: YT double cycle, loaded move from QC to SY Figure A- 28: YT double cycle, loaded move from SY to QC 191


210 Figure A- 29: YT single cycle, unloading productivity Figure A- 30: YT single cycle, loading productivity 192

211 Figure A-31: YT double cycle productivity 193
212 Appendix B VBA Excel coding 1. Sub FindSolution() 2. ' This code aims to solve a Non-Linear programming problem ' Definte variables. Lastrow: stores the value of the last row, b: binary value used to determine for loop direction and step 5. ' l,m,n,o: Variables used in Looping between values 6. Dim Lastrow, b, i, l, m, n, o As Integer ' Define Variables. Obj: Stores the temporary objective function values. Sol: Stores th e current optimal solution 9. ' u,j,k,s,g,f: Store problem parameters, Min/Max: Store the lowest and highest bounds o f each variable 10. Dim Obj(23), Sol(23), u(3), j(3), k(3), s(3), g(3), f(3) As Double 11. Dim Min(), max() As Variant ' Turn off automatic formulat recalculation in the spreadsheet (To improve processing s peed) 14. Application.Calculation = xlcalculationmanual ' Turn off screen updating (To improve processing speed) 17. Application.ScreenUpdating = False ' Clear all cells below row (11) to make room for new answer 20. With Rows(11 & ":" & Rows.Count).Delete 21. End With ' Identify last row with data in the spreadsheet 24. Lastrow = ActiveSheet.Range("B" & Rows.Count).End(xlUp).Row ' Store all minimum variable values (constraints) into array 27. Min = Range("B10:X10") 28. ' Store all maximum variable values (constraints) into array 29. max = Range("B9:X9") ' Store initial temporary objective function value (Using minimum variable values) 32. For l = 1 To Obj(l) = Cells(10, l + 1) 34. Next l ' Store optimal objective function value (Using minimum variable values) 37. For l = 1 To Sol(l) = Cells(10, l + 1) 39. Next l ' Store values for u,k,j,s,g,f For l = 1 To 3 194
213 44. u(l) = Cells(1, l * 5) 45. k(l) = Cells(2, l * 5) 46. j(l) = Cells(3, l * 5) 47. s(l) = Cells(4, l * 5) 48. g(l) = Cells(5, l * 5) 49. f(l) = Cells(6, l * 5) 50. Next l ' Generate random answer 54. For i = 1 To ' Generate a random answer for x1,y1,z1 (B is a binary variable that determines the dir ection of the loop 57. ' (From lower to upper bound or vice versa) b = Int(2 * Rnd + 1) For m = max(1, 1) - b * (max(1, 1) - Min(1, 1)) To Min(1, 1) + b * (max(1, 1) - Min(1, 1)) Step * b 61. b = Int(2 * Rnd + 1) For n = max(1, 2) - b * (max(1, 2) - Min(1, 2)) To Min(1, 2) + b * (max(1, 2) - Min(1, 2)) Step * b 63. b = Int(2 * Rnd + 1) For o = max(1, 3) - b * (max(1, 3) - Min(1, 3)) To Min(1, 3) + b * (max(1, 3) - Min(1, 3)) Step * b ' Set temorary objective function values based on randomly generated answer Obj(1) = m 69. Obj(2) = n 70. Obj(3) = o ' Calculate A1 and B1 73. Obj(10) = WorksheetFunction.Min(u(1) * Obj(1), k(1) * Obj(3), j(1) * Obj(2)) 74. Obj(11) = (1.25 * (s(1) * Obj(1) + f(1) * Obj(2) + g(1) * Obj(3))) / Obj(10) ' Calculate T1 (Contribution to Time Objective Function) and C1 (Contribution to Cost O bjective Function) 77. Obj(16) = 5400 / Obj(10) 78. Obj(19) = Obj(16) + Sol(17) + Sol(18) ' Calculate T and C 81. Obj(20) = 5400 * Obj(11) 82. Obj(23) = Obj(20) + Sol(21) + Sol(22) ' Check if temporary T*C is smaller than current optimal T*C 85. If Obj(19) * Obj(23) < Sol(19) * Sol(23) Then ' If Yes, set current best to temporary values 88. Sol(1) = Obj(1) 89. Sol(2) = Obj(2) 90. Sol(3) = Obj(3) 91. Sol(10) = Obj(10) 195
214 92. Sol(11) = Obj(11) 93. Sol(16) = Obj(16) 94. Sol(19) = Sol(16) + Sol(17) + Sol(18) 95. Sol(20) = Obj(20) 96. Sol(23) = Sol(20) + Sol(21) + Sol(22) ' Add new solution to spreadsheet 99. For l = 1 To Cells(Lastrow, l + 1) = Sol(l) 101. Next l 102. Lastrow = Lastrow End If ' Check another random answer 106. Next o 107. Next n 108. Next m ' Generate a random answer for x2,y2,z2 (B is a binary variable that determines the dir ection of the loop 112. ' (From lower to upper bound or vice versa) 113. b = Int(2 * Rnd + 1) For m = max(1, 4) - b * (max(1, 4) - Min(1, 3)) To Min(1, 4) + b * (max(1, 4) - Min(1, 4)) Step * b 115. b = Int(2 * Rnd + 1) For n = max(1, 5) - b * (max(1, 5) - Min(1, 5)) To Min(1, 5) + b * (max(1, 5) - Min(1, 5)) Step * b 117. b = Int(2 * Rnd + 1) For o = max(1, 6) - b * (max(1, 6) - Min(1, 6)) To Min(1, 6) + b * (max(1, 6) - Min(1, 6)) Step * b ' Set temorary objective function values based on randomly generated answer 121. Obj(4) = m 122. Obj(5) = n 123. Obj(6) = o ' Calculate A2 and B Obj(12) = WorksheetFunction.Min(u(2) * Obj(4), k(2) * Obj(6), j(2) * Obj(5)) 127. Obj(13) = (1.25 * (s(2) * Obj(4) + f(2) * Obj(5) + g(2) * Obj(6))) / Obj(12) ' Calculate T2 (Contribution to Time Objective Function) and C2 (Contribution to Cost O bjective Function) 130. Obj(17) = / Obj(12) 131. Obj(19) = Sol(16) + Obj(17) + Sol(18) ' Calculate T and C 134. Obj(21) = * Obj(13) 135. Obj(23) = Sol(20) + Obj(21) + Sol(22) ' Check if temporary T*C is smaller than current optimal T*C 139. If Obj(19) * Obj(23) < Sol(19) * Sol(23) Then 196
215 ' If Yes, set current best to temporary values 142. Sol(4) = Obj(4) 143. Sol(5) = Obj(5) 144. Sol(6) = Obj(6) 145. Sol(12) = Obj(12) 146. Sol(13) = Obj(13) 147. Sol(17) = Obj(17) 148. Sol(19) = Sol(16) + Sol(17) + Sol(18) 149. Sol(21) = Obj(21) 150. Sol(23) = Sol(20) + Sol(21) + Sol(22) ' Add new solution to spreadsheet 153. For l = 1 To Cells(Lastrow, l + 1) = Sol(l) 155. Next l 156. Lastrow = Lastrow End If ' Check another random answer 160. Next o 161. Next n 162. Next m ' Generate a random answer for x3,y3,z3 (B is a binary variable that determines the dir ection of the loop 165. ' (From lower to upper bound or vice versa) 166. b = Int(2 * Rnd + 1) For m = max(1, 7) - b * (max(1, 7) - Min(1, 7)) To Min(1, 7) + b * (max(1, 7) - Min(1, 7)) Step * b 168. b = Int(2 * Rnd + 1) For n = max(1, 8) - b * (max(1, 8) - Min(1, 8)) To Min(1, 8) + b * (max(1, 8) - Min(1, 8)) Step * b 170. b = Int(2 * Rnd + 1) For o = max(1, 9) - b * (max(1, 9) - Min(1, 9)) To Min(1, 9) + b * (max(1, 9) - Min(1, 9)) Step * b ' Set temorary objective function values based on randomly generated answer 174. Obj(7) = m 175. Obj(8) = n 176. Obj(9) = o ' Calculate A3 and B Obj(14) = WorksheetFunction.Min(u(3) * Obj(7), k(3) * Obj(9), j(3) * Obj(8)) 180. Obj(15) = (1.25 * (s(3) * Obj(7) + f(3) * Obj(8) + g(3) * Obj(9))) / Obj(14) 181. Obj(18) = 2400 / Obj(14) 182. Obj(19) = Sol(16) + Sol(17) + Obj(18) 183. Obj(22) = 2400 * Obj(15) 184. Obj(23) = Sol(20) + Sol(21) + Obj(22) ' Check if temporary T*C is smaller than current optimal T*C 187. If Obj(19) * Obj(23) < Sol(19) * Sol(23) Then
216 189. ' If Yes, set current best to temporary values 190. Sol(7) = Obj(7) 191. Sol(8) = Obj(8) 192. Sol(9) = Obj(9) 193. Sol(14) = Obj(14) 194. Sol(15) = Obj(15) 195. Sol(18) = Obj(18) 196. Sol(19) = Sol(16) + Sol(17) + Sol(18) 197. Sol(22) = Obj(22) 198. Sol(23) = Sol(20) + Sol(21) + Sol(22) ' Add new solution to spreadsheet 202. For l = 1 To Cells(Lastrow, l + 1) = Sol(l) 204. Next l 205. Lastrow = Lastrow End If ' Check another random answer 209. Next o 210. Next n 211. Next m ' Add most recently reached temporary answer to spreadsheet (For reference purposes) 214. For l = 1 To Cells(Lastrow, l + 1) = Obj(l) 216. Next l 217. Lastrow = Lastrow ' Generate another complete set of variables 220. Next i ' Add all Pareto Chart values to the appropriate sheet 223. Sheets("Pareto Chart").Cells(2, 2) = Sol(1) 224. Sheets("Pareto Chart").Cells(3, 2) = Sol(2) 225. Sheets("Pareto Chart").Cells(4, 2) = Sol(3) 226. Sheets("Pareto Chart").Cells(5, 2) = Sol(4) 227. Sheets("Pareto Chart").Cells(6, 2) = Sol(5) 228. Sheets("Pareto Chart").Cells(7, 2) = Sol(6) 229. Sheets("Pareto Chart").Cells(8, 2) = Sol(7) 230. Sheets("Pareto Chart").Cells(9, 2) = Sol(8) 231. Sheets("Pareto Chart").Cells(10, 2) = Sol(9) 232. Sheets("Pareto Chart").Cells(2, 3) = Sol(16) / Sheets("Pareto Chart").Cells(3, 3) = Sol(16) / Sheets("Pareto Chart").Cells(4, 3) = Sol(16) / Sheets("Pareto Chart").Cells(5, 3) = Sol(17) / Sheets("Pareto Chart").Cells(6, 3) = Sol(17) / Sheets("Pareto Chart").Cells(7, 3) = Sol(17) / Sheets("Pareto Chart").Cells(8, 3) = Sol(18) / Sheets("Pareto Chart").Cells(9, 3) = Sol(18) / Sheets("Pareto Chart").Cells(10, 3) = Sol(18) / Sheets("Pareto Chart").Cells(2, 5) = Sol(20) / 3 198
217 242. Sheets("Pareto Chart").Cells(3, 5) = Sol(20) / Sheets("Pareto Chart").Cells(4, 5) = Sol(20) / Sheets("Pareto Chart").Cells(5, 5) = Sol(21) / Sheets("Pareto Chart").Cells(6, 5) = Sol(21) / Sheets("Pareto Chart").Cells(7, 5) = Sol(21) / Sheets("Pareto Chart").Cells(8, 5) = Sol(22) / Sheets("Pareto Chart").Cells(9, 5) = Sol(22) / Sheets("Pareto Chart").Cells(10, 5) = Sol(22) / With Sheets("Pareto Chart") Range("A2:F10").Sort.Range("B2:B10"), xldescending End With ' Turn automatic calculation back on 258. Application.Calculation = xlcalculationautomatic ' Turn screen updating on 261. Application.ScreenUpdating = True 262. End Sub 199
218 Appendix C Table C- 1: TEU vessel GA set of twenty best alternatives selected (16000 TEUs vessel) ID G0 G1 G2 G3 G4 G5 G6 G7 G8 Pro1 (TEU/hr) Unit cost 1 ($/TEU) Pro2 (TEU/hr) Unit cost 2 ($/TEU) Pro3 (TEU/hr) Unit cost 3 ($/TEU) Total time ( hr) Total Cost ($) Productivity total (TEU/hr) A B C D E F G H I J K L M N O P Q R S T Unit cost average ($/TEU) 200
219 Table C- 2: Set of ranked best 20 alternatives Matrix craiteria Unit ID Pro1 Pro2 Pro3 Productivity C1 C2 C3 Time cost A B C D E F G H I J K L M N O P Q R S T
220 Table C- 3: Decision matrix normalization ID Pro1 Pro2 Pro3 Productivity C1 C2 C3 Time Unit cost A B C D E F G H I J K L M N O P Q R S T SumX^ (sumx^2)^
221 Table C- 4: Divide each column by (Sumx^2)^0.5 ID Pro1 Pro2 Pro3 Productivity C1 C2 C3 Time Unit cost A B C D E F G H I J K L M N O P Q R S T
222 Table C-5: multiply each column by wj to get A* and A`. wj ID Pro1 Pro2 Pro3 Productivity C1 C2 C3 Time Unit cost A B C D E F G H I J K L M N O P Q R S T A* A`
223 Table C- 6: define the POS separation measures for each alternative, S* ID Pro1 Pro2 Pro3 Productivity C1 C2 C3 Time Unit cost S* A E E E B E E E E E E E E C E E E E E E E D E E E E E E E E E E E E E E E E E F E E E E E E E E E G E E E E E E E E H E E E E E E E E I E E E E E E E E J E E E E E E E K E E E E E E E E L E E E E M E E E E E E E N E E E E E E E E E O E E E E E E E P E E E E E E E E Q E E E E E E E E R E E E E E E E S E E E E E E E E T E E E E E E E-06 5E
224 Table C-7: define the NOI separation measures for each alternative, S` ID Pro1 Pro2 Pro3 Productivity C1 C2 C3 Time Unit cost S` A E E E E E E E B E E E E E E E C E E E E E E E- 4.97E D E E E E E E E- 8.94E E E E E E E E E- 2.89E F E E E E E E E E G E E E E E E E- 2.38E E H E E E E E E E- 9.11E I E E E E E E- 2.34E E J E E E E E E E- 1.68E E K E E E E E E E- 5.51E L E E E E E E E M E E E E E E E E E N E E E E E E E E O E E E E E E E E P E E E E E E E Q E E E E E E E E R E E E E E E E E S E E E E E E E E T E E E E E E E
225 Table C-8: Calculate the relative closeness to the ideal solution Ci* = S'i / (Si* +S'i ) and rank the alternatives, the farthest from the NOS is the best ID S* S` C*=[S`/(S`+S*)] Distance from best solution Ranking A B C D E F G H I J K L M N O P Q R S T


226 208


227 209

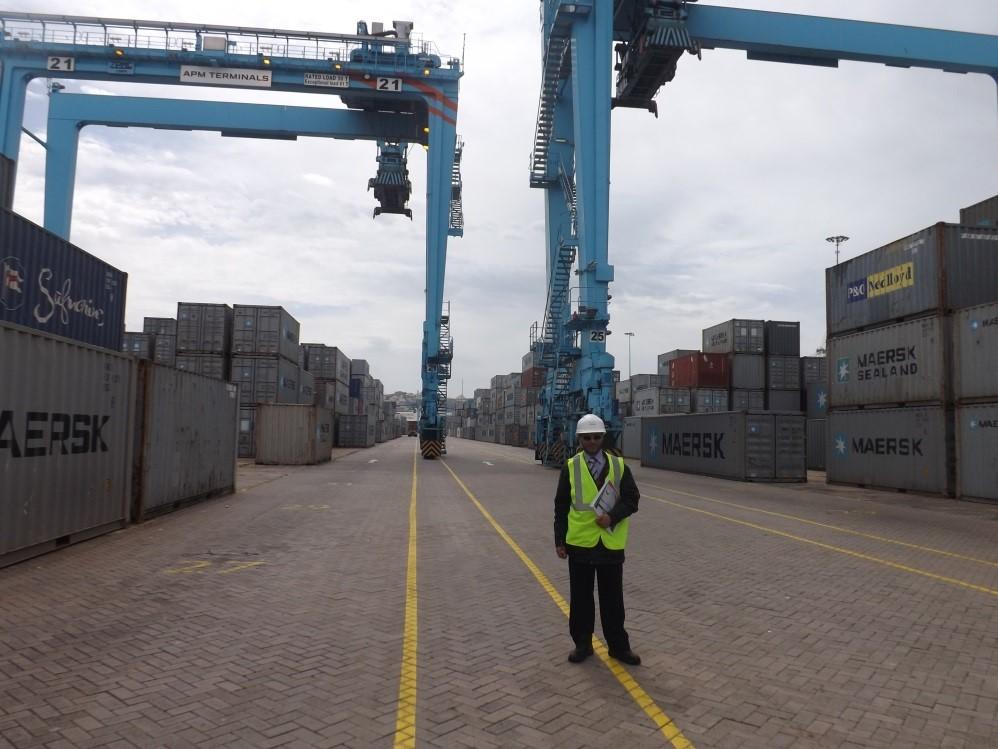
228 210