Mobility 2025 Update: The Metropolitan Transportation Plan
|
|
|
- Katrina Houston
- 5 years ago
- Views:
Transcription

1 Mobility 2025 Update: The Metropolitan Transportation Plan May, 2001 North Central Texas Council of Governments Transportation Department
2 MOBILITY 2025 UPDATE FINANCIAL SUMMARY Metropolitan Transportation System Components Cost (Millions/2001$) Revenue (Millions/2001$) Revenue Initiative (Millions/2001$) Operation & Maintenance Congestion Mitigation Strategies Bicycle & Pedestrian Facilities and Transportation Enhancements Rail and Bus Transit System HOV and Managed Facilities Freeway and Toll Road System Regional Arterial and Local Thoroughfare System TOTAL $18,078 $18,078 $0 $2,014 $2,014 $0 $960 $960 $0 $8,653 $8,653 $0 $2,115 $2,115 $0 $11,528 $8,262 $3,266 $5,677 $5,677 $0 $49,025 $45,759 $3,266
3 MOBILITY 2025 Revenue/Cost Imbalance Reconciliation Initiatives Pursue Congestion Pricing Opportunities Through Managed Facilities in Specific Corridors Identified Through Major Investment Studies Continue Value Engineering Initiatives Increase DFW Share of State Allocations Continue to Pursue Legislative Actions Aimed at: Increasing Revenue Through Initiatives Identified by the RTC Mobility Plan Finance Subcommittee Decreasing Project Costs Through Streamlining the Project Development Process 2
4 MOBILITY 2025 UPDATE METROPOLITAN AREA DEMOGRAPHIC FORECAST % Change 3 POPULATION 4,536,000 6,671, % EMPLOYMENT 2,691,000 3,907, % The region will grow at a rate of: 82,000 persons per year and 47,000 jobs per year

5 1999 Congestion Levels Legend 35E Areas of Moderate Peak-Period Congestion 35W Areas of Severe Peak-Period Congestion Annual Cost of Congestion = $5.3 Billion W 67 35E 45 North Central Texas Council of Governments Transportation N
6 2025 Congestion Levels Legend 35E Areas of Moderate Peak-Period Congestion 35W Areas of Severe Peak-Period Congestion Annual Cost of Congestion = $8.2 Billion W 67 35E 45 North Central Texas Council of Governments Transportation N
7 Mobility 2025 Plan Update Land Use/ Transportation Interface Chapter Sustainable Development Defined 6 Land use and transportation practices that promote economic development while using limited resources in an efficient manner. Transportation decision making based on impacts on land use, congestion, vehicle miles traveled, and the viability of alternative transportation modes. Planning efforts which seek to balance access, finance, mobility, affordability, community cohesion, and environmental quality.
8 7
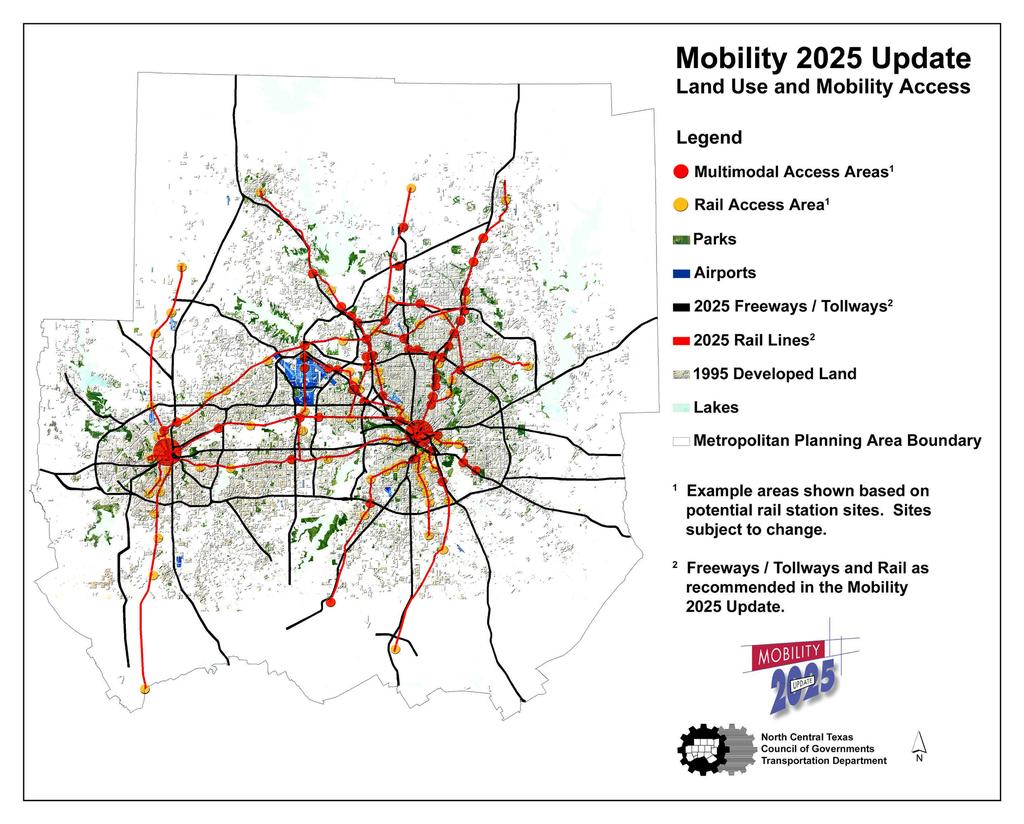
9 Recommendations Mobility 2025 Plan Update Land Use/ Transportation Interface Chapter Promote the use of existing system capacity. Promote the mixing/integration of land uses. 8 Promote increased rail mobility. Promote improved access management. Develop Transportation Accessibility Program Partnerships. Support the Center of Development Excellence. Improve pedestrian and bicycle access to rail. Encourage local commitment to transit oriented development. Monitor regional mobility access and land use trends.
10 Recommendations Mobility 2025 Update Intermodal Freight Chapter Promote NAFTA Safety and Mobility Issues Promote Safety at At-grade Highway-Railroad Crossings 9 Establish New Process for Intermodal Freight Community Input Monitor Goods Movement Traffic Throughout the Region Evaluate Accessibility of Intermodal Freight Centers Ensure Safety of Hazardous Materials Truck Routes Continue MPO Involvement With Freight and NAFTA Groups Review Intermodal Factors in Project Selection
11 MOBILITY 2025 UPDATE Elderly and Persons with Disabilities Program Goal: To Provide Assistance in Meeting the Transportation Needs for Elderly and Persons with Disabilities where Transportation Services are Unavailable, Insufficient, Or Inappropriate Program Activities: The Provision of Services ; the Purchase of Vehicles and/or the Purchase of Auxiliary Equipment Geographic Area: Metropolitan, Small Urban and Rural Areas 10
12 MOBILITY 2025 UPDATE Clean Vehicle Program Recommendations Encourage the Displacement of Petroleum Fuels Facilitate the Sharing of Refueling Stations Explore the Feasibility of Electric Vehicles Complementing Rail and Other Transit Facilities Facilitate the Adoption of Emerging Technologies Fund Incremental Costs Expand Funding for Private Fleets Expose the General Public to Low-Emitting Vehicles Seek Financial and Non-Financial Incentives to Promote Low-Emitting Vehicles 11
13 MOBILITY 2025 UPDATE Travel Demand Management Program Goal: To Reduce the Demand for Drive Alone Travel by Offering Low Cost and Quickly Implemented Alternatives. Program Results: Improved Mobility and Air Quality. Program Activities: 1. Employer Trip Reduction Programs 2. Transportation Management Associations 3. Vanpool Programs 4. Park-and-Ride Lots 12
14 MOBILITY 2025 UPDATE Transportation System Management Intersection Improvements 1,615 Projects Signalized Improvements 12,800 Projects Traffic Signal Integration and Monitoring Project Freeway Bottleneck Removal System Monitoring -Peak Period Commuter Traffic Initiate Bottleneck Program Special Events Management Interagency Programs to Identify Special Events Develop and Implement Congestion Mitigation Strategies 13
15 MOBILITY 2025 UPDATE Intelligent Transportation System Efforts Accomplished to Date ITS Investment $125 million existing and funded (40% complete) Sub-Regional ITS Plans Interagency Communications Analysis and Recommendations Study (2000) Current Efforts Development of Dallas-Fort Worth Regional ITS Architecture Regional Integration and Information Exchange Incorporate RTC Policies into Mobility 2025 Update Based on the Interim Guidance Establishes local review process Expedites state and federal review process 14
16 Mobility 2025 Update Pedestrian Facilities Legend Pedestrian Transportation Districts 2025 Veloweb Routes Mobility 2025 Update Rail Lines 15 # 1 Transit Station Pedestrian Transportation Districts 1 Example districts shown based on potential rail station sites. Sites subject to change. New facility locations indicate transportation needs and do not represent specific alignments. All existing railroad rights-of-way should be monitored for potential future transportation corridors. North Central Texas Council of Governments Transportation N
17 Mobility 2025 Update Bicycle Facilities Legend Bicyle Transportation Districts Recommended Veloweb Routes Candidate Veloweb Routes Existing Off-Street Hard Surface Trail (Improved) Programmed Off-Street Bicycle/Pedestrian Facilities 16 New facility locations indicate transportation needs and do not represent specific alignments. All existing railroad rights-of-way should be monitored for potential future transportation corridors. All veloweb routes should be targeted for right-of-way preservation. North Central Texas Council of Governments Transportation N
18 Mobility 2025 Update Rail System Legend Denton Frisco McKinney Commuter Rail Light Rail Texas Motor Speedway W 35E Plano North Crosstown Corridor Study Possible Eastern Terminus Staged Rail * Special Events Intercity Rail Corridor Freeways/Parkways Existing Rail Corridors Santa Fe 17 Cottonbelt Union Pacific Northeast Burlington Northern 635 All existing railroad rights-of-way should be monitored for potential future transportation corridors. South Orient 35W Trinity Railway Express 30 Union Pacific 20 West Oak Cliff 67 South Oak Cliff 35E 45 Pleasant Grove New facility locations indicate transportation needs and do not represent specific alignments. * STAGED RAIL (Must meet two of the following) Refined rail forecasts are necessary to determine technology and alignment Extension into Olympic Village Site (South Oak Cliff LRT) Institutional structure for implementation to be determined - DART and FWTA expansion (preferred) or New transit authorities will be created - Other sources of funding to be pursued Midlothian Waxahachie Cleburne North Crosstown Corridor Study Area At a minimum, evaluate the engineering feasibility and environmental implications of: - rail along the Santa Fe line and the Burlington Northern line, including the feasibility of an alternative connection along S.H. 190; - rail along the full Cottonbelt Corridor, from Parker Road to DFW Airport; and - rail along the Cottonbelt Corridor from DFW Airport with an eastern transition to light rail along LBJ Freeway at an Addison Intermodal Center. North Central Texas Council of Governments Transportation N
19 Mobility 2025 Update HOV and Managed Facility System Legend Reversible 35E Managed HOV/Integrated Tollroad 35W Two-Way Freeways/Parkways Arrows represent the direction of travel during the morning peak period. Direction of travel is reversed during the afternoon peak period on these HOV facilities 635 Right-of-Way preservation should be encouraged in all freeway corridors to accommodate potential future HOV facilities New facility locations indicate transportation needs and do not represent specific alignments. All HOV facilities will be managed for mobility efficiency W 67 35E North Central Texas Council of Governments Transportation N
20 Mobility 2025 Update Freeway and Tollway System Legend Improve Existing Freeway New Staged Freeway New Staged Tollway 35E New Staged Parkway 35W Upgrade to Parkway Preserve ROW 114 Dallas CBD Fort Worth CBD Additional and improved freeway interchanges and service roads should be considered on all freeway facilities in order to accomodate a balance between mobility and access needs New facility locations indicate transportation needs and do not represent specific alignments. 35W 67 35E 45 The need for additonal east/west capacity is identified in the corridor between Northwest Highway and Mockingbird Lane from US 75 to SH 183/IH 35E. Further study is needed to refine alignment and operational characteristics. North Central Texas Council of Governments Transportation N
21 Mobility 2025 Update Regional Arterial System Legend Regional Arterials Existing Freeways and Tollways Proposed Freeways and Tollways Preserve Right of Way Local government thoroughfare plans vary in these corridors Thoroughfare Spacing Review 20 New facility locations indicate transportation needs and do not represent specific alignments. Based on NCTCOG's Regional Thoroughfare Plan Dallas CBD Fort Worth CBD North Central Texas Council of Governments Transportation N
22 Title VI and Environmental Justice Job Accessibility Performance Measures Trip Based Link Based By Auto By Transit Level of Service Census Year Populations Black o o Hispanic o o Asian American American Indian/Alaskan Native 2000 o o o o + + Under Poverty Line (Low Income) o + Over 65 Years Old Under 13 Years Old Persons with Disabilities Females (Head of Household) = Protected Population is Five Percent Greater Than Unprotected Population - = Protected Population is Five Percent Less Than Unprotected Population o = Protected Population is Within Five Percent of Unprotected Population