Smart Growth Impact Fees
|
|
|
- Bridget Evangeline Murphy
- 5 years ago
- Views:
Transcription
1 Smart Growth Impact Fees Presentation to National Impact Fee Roundtable October 10, 2008 Deb Galardi, Galardi Consulting Donald Samdahl, Fehr & Peers
2 Smart Growth and Impact Fees Enhanced ability to fund needed infrastructure: Full cost recovery methodology vs policy based adjustments Improved equity from right-sizing Lower fees when higher development standards reduce public infrastructure costs Fees proportionate to system impact Level the playing field for developers in achieving Smart Growth development Lower fees for targeted developments Higher fees for higher impact development 2
3 2007 Metro SDC Study Metro Regional government of Portland, Oregon- 25 cities Component of New Look at Regional Choices program (defines how the region s long term plan is carried out) Promote opportunities for efficient land use Invest in centers, corridors; employment and industry centers Impact Fee (SDC in Oregon) Objectives Real Cost Recovery use of SDC revenue to fund infrastructure needed to build-out urban growth boundary Sustainable Development Patterns Use of SDCs to promote desired development patterns
4 Metro Study Scope Identify model approaches to SDCs used by other jurisdictions that: Acquire the real costs of infrastructure development Promote sustainable development by varying rates or other methods Secure future infrastructure needs identified in a capital improvement plan Identify approaches that applicable for area jurisdictions Identify steps to overcome barriers to implementation
5 Similar Study Conducted in Canada Each community has a unique set of circumstances regarding existing infrastructure systems.. It is not possible, therefore, to make general quantitative conclusions that would apply to all communities about the costs savings associated with different development patters. However, experience and logic support some reasonable general conclusions about the possible effects of different growth patterns on infrastructure costs. Do Development Cost Charges Encourage Smart Growth and High Performance Building Design? An Evaluation of Development Cost Charge Practices in British Columbia (Coriolis Consulting Corp)
6 Coriolis Study Findings All infrastructure systems potentially impacted by number of occupants, building size, in some cases, density of lot or area Transportation system demand also a function of development configuration Location can be a factor in determining cost of service due to: Cost differentials (e.g., land prices or specific facilities) Differences in level of service standards Impact (e.g., proximity to service or differences in demographics) 6
7 Model Approaches - Transportation City of Tucson: House size and type Location (reduced fees for central city) City of Olympia: Location (central city) City of Atlanta: Proximity to rail transit City of Albuquerque House size Location (employment centers) Kelowna, BC: Density Prince George, BC: Density
8 Metro Study Recommendations Integrate development characteristics into SDC methodology and schedule: System plans should clearly identify facility design standards and impact assumptions for different land use types/locations. Beyond system plans, explore other local data sources to support differentials (census data, household travel surveys, etc). Supplement local data with regional and national data sources. 8
9 Metro Study Recommendations Consider policy based adjustments Building/site design features Proximity to service 9
10 Follow-Up Metro is conducting a follow-up study Provide more detail to local jurisdictions of how system plans can better support SDC methodology How regional transportation model might be modified to incorporate study findings How future household travel survey may be developed to address study data needs Jurisdictions considering applicability of findings/recommendations in SDC studies 10
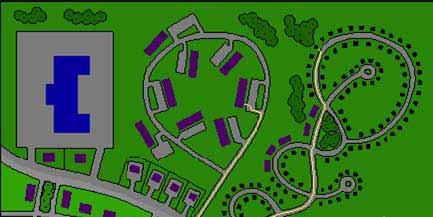
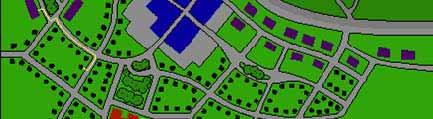
11 Smart Growth and More Factors Affecting Smart Growth The D s Effects on Travel Smart Growth Examples California Washington Portland 11
12 7 D factors that influence trip generation: Density dwellings, jobs per acre Diversity mix of housing, jobs, retail Design connectivity, walkability Destinations regional accessibility Distance to Transit bus, rail proximity Development Scale: population, jobs Demographics household size, income
")

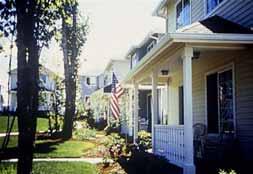
13 Density (jobs and dwellings per acre) Shortens trip lengths More walking/biking Supports quality transit
 Links trips,")

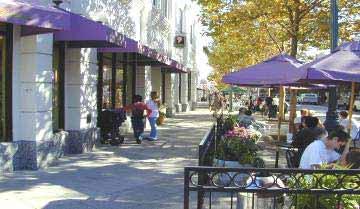
14 Diversity (mix of housing, jobs, retail) Links trips, shortens distances More walking/ biking Allows shared parking
15 Design (connectivity, walkability) Improves walking experience Shortens routes Improves safety
")

16 Destinations (accessibility to regional activities) Development at infill or close-in locations reduces vehicle miles


17 Distance to Transit Transit shares higher within ¼ mile and ½ mile of station
 Critical mass for")

18 Development Scale (acres, population, jobs) Critical mass for basic services, schools Sufficient variety of options, balance of opportunities

19 Demographics Household size, income and employment influence tripmaking
20 4D Elasticity Ranges Density Diversity Design Destinations Vehicle Trips Per Capita 4% to 12% 1% to 11% 2% to 5% 5% to 29% VMT per Capita 1% to 17% 1% to 13% 2% to 13% 20% to 51% Sources: National Syntheses, Twin Cities, Sacramento, Holtzclaw

21 Smart Growth Development Types TOD IND Atlantic Station MXD TND


22 Latest Findings on Smart Growth Trip Generation National studies of Mixed Use, TOD and Infill development Statistical analysis, empirical validation Trip Discount MXD 35% TOD 44% Infill 36% Examples: San Diego, Seattle, Portland, Sacramento, Houston, Atlanta, Boston Sources: EPA MXD, SANDAG SG TG, TCRP 128, Caltrans 1221
23 Challenge: Conventional Technical Methods & Models ITE allows trip rate adjustments: if there is evidence, for example through market analysis, that the site may be better or different than average to reflect the use of alternative modes
24 Shortcomings of Conventional Travel Models in Assessing Smart Growth Primary use is to forecast long-distance auto travel on freeways and major roads Secondary use is to forecast system-level transit use Short-distance travel, local roads, non-motorized travel modes are not addressed in model validation

25 Typical Model Blind Spots Abstract consideration of distances between land uses within a given TAZ or among neighboring TAZ s Limited or no consideration intra-zonal or neighbor-zone transit connections Network in Model Network in Field


26 Typical Model Blind Spots Sidewalk completeness, route directness, block size generally not considered.
27 Typical Model Blind Spots Little consideration is given to spatial relationship between land uses within a given TAZ (density) Interactions between different non-residential land uses (e.g. offices and restaurants) not well represented
28 California AB 3005 (Adopted Aug 08) Applies to housing within ½ mile of community retail, including food Applies to new fees only, not increases in fees (until 2011) Housing must provide only the minimum amount of parking Located within one-half mile of a transit station and have direct access to the transit station along a barrier-free walkable pathway
29 Washington State Growing interest in smart growth impact fees and concurrency Limiting state legislation= streets and roads Examples: Activity center trip rate reductions: Bellevue, Olympia Multi-modal concurrency: Redmond
30 City of Olympia Reduced Downtown Impact Fees due to: Lower range of trip generation rates Higher pass-by trip percentage Shorter trip lengths Supported by national research
31 City of Olympia Land Use (ITE Category) ITE Average Trip Rate (PM peak Hour) 50% of Standard Deviation (SD) Modified Trip Rate (Average-50% SD) Walk-in Bank (911) ** Supermarket (850) Fast Food (without Drive- Through Window) (883) Convenience Market (Open Hours) (852) Scenario Trips to/from Olympia CBD Average City Trips Olympia CBD Trip Lengths compared with Average City Trips Total Trips 2.3 mi 3.7 mi -39% Home Based Work Trips 2.7 mi 3.0 mi -12%
32 City of Olympia Land Uses Unit of Measure Other Areas Impact Fee Downtown Multi Family Residential -Townhouse, Duplex Dwelling $1,091 $504 Senior Housing/Accessory Dwelling Dwelling $413 $209 Asst. Living/Nursing Home, Group Home bed $330 $224 Daycare Sq ft/gfa $10.60 $2.88 Health Club Sq ft/gfa $5.05 $2.88 Bank Sq ft/gfa $18.40 $7.89 Hotel/Motel Room $1,266 $939 Movie Theater seat $73 $61 Marina berth $284 $174 Restaurant Sq ft/gfa $10.93 $2.88 Fast Food Restaurant Sq ft/gfa $18.58 $10.65 Retail Up to 49,999 sq ft Sq ft/gfa $3.48 $ ,000-99,999 sq ft Sq ft/gfa $3.05 $ , ,999 sq ft Sq ft/gfa $2.98 $ , ,999 sq ft Sq ft/gfa $2.71 $ , ,999 sq ft Sq ft/gfa $3.22 $1.65 over 400,000 sq ft Sq ft/gfa $3.62 $1.65 Supermarket > 5,000 sq ft Sq ft/gfa $8.83 $4.93 Convenience Market < 5,000 sq ft Sq ft/gfa $16.44 $8.09 Video Rental Sq ft/gfa $5.58 $4.32


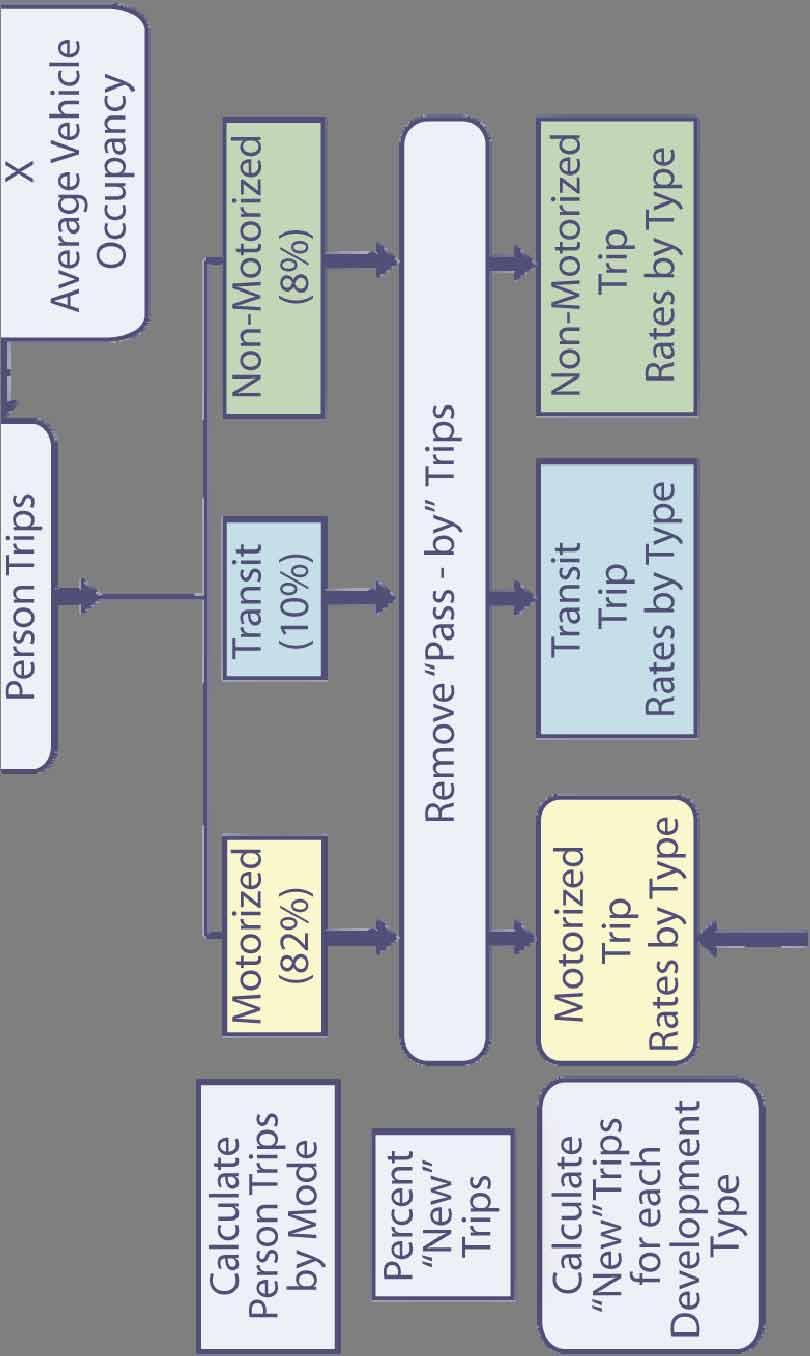
33 Oregon State legislation allows multi-modal modal System Development Charges SDC Examples: Portland Metro: Promoting Vibrant Communties through SDC s.
34 Key Features of the Portland Program Multiple Modes- Motorized, Transit, Non-motorized Project Selection Procedure Calculation of Modal TSDC Rates
35 Project Selection Procedure has two steps First Cut Criteria - meet all of following: Adds capacity Part of Transportation System Plan Public street, walkway/bikeway 10-year focus Not a maintenance project Not equipment or rolling stock
36 Project Selection Procedure has 2 steps Second Cut Criteria - meet one or more of the following: Support bicycle, pedestrian and/or transit modes Improve movement of freight and goods Reduce congestion, improve access and/or circulation
37 Project Selection Procedure- Other Criteria Community or business priority? Strong leverage potential?
38 Resulting Project List Started with 500+ Projects Final list after screening: 46 multimodal projects $415 million 10-year program
39
40 Cost Allocations to Modes Direct and Common Costs Direct: - Specific to mode Common: - Common to all modes Calculated for each project using a standard procedure
41 Motorized Transit Pedestrian Deficiency Analysis -Volume to capacity ratio -Maximum load factors -Percent arterials without sidewalks Bicycle -Bike lane-miles per 1000 households
42 Through Trip Analysis Motorized Model - Select Links to calculate city trip portion Transit, Pedestrian - Model trip origins and and Bicycle destinations within areas of the city
43 Calculations Modal Cost = Project Cost * mode % Growth % = 100 Deficiency % City Growth Portion = 100- Through Trip % Cost per Person Trips for each mode
44 Land Use Trip Generation Start with ITE Vehicle Trip Rates Convert to Person Trips using average vehicle occupancy and mode shares Remove pass-by trips Separate trips into modes using mode shares
45
46 Portland TSDC Rate Schedule TSDC Rates for Each Mode Total TSDC Rate= Motorized Rate + Transit Rate + Non-motorized Rate
47 What Have we Learned? Growing demand for Smart Growth applications to Impact Fees Limited tools currently available, but New research is happening
48 What have we Learned? Multi-modal applications require defined performance measures Roadway: Use Highway Capacity Manual LOS Pedestrian and Bicycle Facilities: Locally adopted standards vary Transit: Local agencies have limited influence
49 What Have we Learned? Limited pedestrian, bike and transit trip generation data related to land use 4+ D s offer opportunities to inject smart growth factors
50 Summary Need to recognize that growth affects all other travel modes Portland s program working well Began 1997; updated 2007 Washington State Should change the GMA to encourage multiple mode impact fee programs More research needed on multi-mode trip generation
51 Questions? Deb Galardi Don Samdahl