Transportation Asset Management Webinar Series
|
|
|
- Claude Copeland
- 5 years ago
- Views:
Transcription


1 Transportation Asset Management Webinar Series Webinar 34 Integrating PM2 Targets with the TAMP Sponsored by FHWA and AASHTO Webinar 34 October 10, 2018

2 FHWA-AASHTO Asset Management Webinar Series This is the 34 th in a webinar series that has been running since 2012 Webinars are held every two months, on topics such as off-system assets, asset management plans, asset management and risk management, and more We welcome ideas for future webinar topics and presentations Submit your questions using the webinar s Q&A feature 1
3 Welcome FHWA and the AASHTO Sub-Committee on Asset Management are pleased to sponsor this webinar Sharing knowledge is a critical component of advancing asset management practice 2
4 PM2 Targets and the TAMP Where are we now? DOT PM2 Target Setting DOT PM2 Reporting Initial TAMP Complete TAMP Jan Feb Mar Apr May Jun Jul Aug Sep Oct Nov Dec Jan Feb Mar Apr May Jun Jul Aug Sep Oct Nov Dec
5 PM2 Targets and the TAMP Where are we now? Initial TAMP DOT PM2 Target Setting DOT PM2 Reporting MPO PM2 Target Setting Complete TAMP Jan Feb Mar Apr May Jun Jul Aug Sep Oct Nov Dec Jan Feb Mar Apr May Jun Jul Aug Sep Oct Nov Dec
6 Learning Objectives Building working knowledge of key concepts and definitions relevant to transportation asset management Beginning to apply this knowledge in the context of PM2 Targets and TAMPs to answer: What approaches are agencies taking to coordinate PM2 Targets with the TAMP? What benefits can my agency expect by better integrating PM2 target setting with the TAMP? What are key lessons-learned for agencies as they move forward with developing their complete TAMPs? SHARE LESSONS LEARNED, IDEAS, KNOWLEDGE!!! 4
7 Webinar Agenda 2:00 Webinar Introduction and Overview Steve Gaj (FHWA) Hyun-A Park (Spy Pond Partners, LLC) 2:10 Caltrans Target Setting Approach Michael Johnson (Caltrans) 2:30 Maryland Experience Meredith Hill (Maryland SHA) 2:50 Wyoming Integration of Pavement and Bridge Targets with the TAMP Martin Kidner (Wyoming DOT) 3:10 Q&A and Wrap Up 5


8 Caltrans Target Setting Approach Michael Johnson P.E. State Asset Management Engineer October 2018

9 California s Regional Planning Partners 18 Metropolitan Planning Organizations 26 Regional Transportation Planning Agencies

 represents the measures for the NHS Source: 2016 HPMS Data NHS Target Setting Bridge and Pavement Target Setting Workshop")
10 California Pavement Inventory 2016 Total California Pavement Inventory 180,351 Road Miles (RM*) 402,466 Lane Miles (LM**) State 14,776 RM 49,682 LM Local 165,574 RM 352,784 LM State Non-NHS 6,319 RM 13,033 LM = 26% State State NHS 8,458 RM 36,649 LM = 74% State Local NHS 5,450 RM 19,427 LM = 6% Local Local Non NHS 160,124 RM 333,357 LM = 94% Local Note: *Road Miles (RM) is center lane miles ** Lane Miles (LM) represents the measures for the NHS Source: 2016 HPMS Data NHS Target Setting Bridge and Pavement Target Setting Workshop Slide 3

11 California Bridge Inventory 2017 Total California NBI Inventory 24,868 Bridges Deck Area 325,870 KSF* State 12,413 Bridges Deck Area 252,566 KSF Local 12,455 Bridges Deck Area 73,304 KSF State Non-NHS 3,217 Bridges Deck Area= 17% State State NHS 9,196 Bridges Deck Area=83% State Local NHS* 1,629 Bridges Deck Area= 32% Local Local Non NHS 10,826 Bridges Deck Area= 68% Local NHS Target Setting Source: National Bridge Inventory (NBI) bridges Note: NHS Targets are required on NBI bridges, non-nbi bridges excluded Note: There are over 250 Local Agency owners of NHS bridges of which 87% own less than 10 bridges *Deck area in thousand square feet (KSF) Bridge and Pavement Target Setting Workshop Slide 4
12 Target Setting Approach 1. Identify the inventory and current condition of NHS pavements and bridges 2. Solicit expected 2 and 4 year targets from all NHS owners 3. Use a quantity weighted approach to develop a statewide targets

13 Example Click to Calculation edit Master title style
14 Summary Caltrans solicited MPO input before establishing targets State of California targets reflect each agencies expectations The approach is transparent and inclusive
15 MARYLAND S NHS ASSET MANAGEMENT Ms. Meredith Hill, Performance Planner


16 MDOT & the System NHS in Maryland Targets and Projections Delivering the Final TAMP MDOT Asset Management Lessons Learned


17 ABOUT OUR (MDOT SHA) SYSTEM
18 SYSTEM PRESERVATION TRADEOFFS Million $1,000 $900 $800 $700 $600 $500 $400 $300 $200 $100 $0 Actual Projected Other Pavement and Bridges MDOT SHA Program Access Controls ADA Retrofit Bicycle Retrofit Bridge Replace & Rehab. Capital Equipment CHART Communications Commuter Action Improvements Crash Prevention Drainage Emergency Enhancements Environmental Compliance Environmental Preservation Guardrail End Treatment Intersection Capacity Neighborhood Conservation Noise Barriers Park-n-Ride Pedestrian Access to Transit Railroad Crossings Railroad Safety & Spot Rest Areas & Information Centers Resurfacing & Rehabilitation Safety & Spot Sidewalks Statewide Planning & Research TMDL Compliance Traffic Management Urban Reconstruction


19 NHS IN MARYLAND NHS Owners MDOT SHA MDOT MAA MDTA ACoE NPS Counties Municipalities Parks Commission Partners FHWA MD Division Office MPOs


20 DEVELOPING THE NHS STORY Bridges Pavement MDOT SHA submits NBIS for non-federal structures, only. Has historical records for non-federal structures Mature BMS capable of reasonable nonfederal condition projections MDOT SHA collects all I&C information for the directional lane miles of the NHS, regardless of ownership Has historical records for IRI, cracking, faulting, & rutting Mature PMS capable of reasonable condition projections
21 PERFORMANCE PROJECTIONS - BRIDGES
22 PERFORMANCE PROJECTIONS - PAVEMENT

23 DELIVERING ON TPM AND TAM Data Collection Content Development Review Submission Oct Nov Dec Jan Feb Mar Apr May Early June Leadership Directive Building the Team Increasing shared competencies Data and Information Incorporate vulnerability into management systems and project development Balance increasing tradeoff realities with state of good repair practice and commitments
24 MDOT ASSET MANAGEMENT GOALS The Department Asset Management Program is focused on the following goals: 1. Know What We Own Develop & Maintain Accurate Asset Inventory and Information 2. Know What Condition Our Assets are In Implement Conditioning Protocols & Track Maintenance/Costs 3. Establish Plan for Maintaining a State of Good Repair Develop & Document Processes & Procedures 4. Commit to Asset Management Practices Educate and Train Workforce in AM Practices 5. Develop a Framework & Guidance for Asset Management Software 6. Integrate Asset Management into How We Do Business Critical Infrastructure Pavement Large Structures Rail Tunnels Facilities Vehicle Fleet & Equipment IT Systems

25 QUESTIONS /pages/mdot/ Meredith Hill Performance Planner MDOT SHA, Innovative Performance Planning Division
26 Wyoming Integration of Pavement and Bridge Targets with TAMP Martin Kidner State Planning Engineer, WYDOT
27 Critical Communication How fast can you change the needle? Will your funding change predictably? How do you handle inflation? 10/10/18 Buckle up 2
28 Space-Time Continuum Understand time from decision to reporting. Legislature provides new funds (July 2009) Contracts let (August 2009) Crushing and paving (Summer 2010) Measure (NHS every other year, 2011) Report to HPMS (April 2012) instant reaction is a three year delay 10/10/18 Buckle up 3

29 Construction and Contract Maintenance History 10/10/18 Buckle up 4
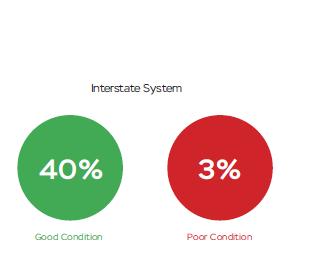
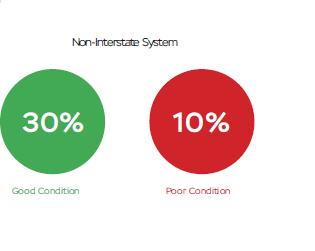
30 Effects of inflation, constant funding scenario 100% Non-Interstate NHS Condition Projections 4% Inflation Rate 90% 80% 70% Good + Excellent Target 60% 50% 40% Year 10/10/18 Buckle up 5
31 Treatments are not system wide We are treating about 10% of the interstate pavements per year The change in condition is relatively slow Don t Fall Behind 10/10/18 Buckle up 6

32 10 year projection begins to indicate the condition of long life assets 10/10/18 Buckle up 7
33 So What? 2 year outcomes are already in the pipeline 4 year targets don t adequately show the trends Assets are long lived, and need to project longer term. How do we indicate compliance with the TAMP? 10/10/18 Buckle up 8
34 Output versus Outcome Output example: dollars spent on pavement treatment. Outcome example: number of 0.1 mile segments changed from poor to good with the lowest life cycle cost. 10/10/18 Buckle up 9

35 Management Systems Wyoming s management system indicates miles of light, medium, and heavy (1S, 2S, 3S) pavement treatment per system type Track committed projects by system, type of treatment, and validates locations 10/10/18 Buckle up 10
36 Martin Kidner, WYDOT, Planning Engineer (307) QUESTIONS? 10/10/18 Buckle up 11
37 Questions? Submit your questions using the webinar s Q&A feature 6

38 All webinars available online: Next Webinar Wednesday, December 12, :00 PM EST More to follow!