2040 Addendum Performance-Based Planning November 2018
|
|
|
- Beryl Jennings
- 5 years ago
- Views:
Transcription


1 2040 Long Range Transportation Plan 2040 Addendum Performance-Based Planning November 2018 Adopted June 13, S. Orange Ave, Suite 200, Orlando, FL MetroPlan
2 Contents Introduction... 3 Planning Rule Framework... 4 Figure 1 Federal Performance Measures & Targets... 5 Figure 2 MetroPlan Orlando Performance Measures & Targets Regional Vision & Goals... 8 Performance Based Planning Process... 9 Figure 3 LRTP, Planning Factors & Performance Measure Linkage Figure 4 MetroPlan Orlando Performance Based Planning Process Reporting & Performance Monitoring Scorecard Figure 5 Federal Performance Measures Scorecard Figure 6 MetroPlan Orlando Performance Measures Scorecard Moving Forward with Performance Based Planning Figure 7 Adopted 2040 Cost Feasible Project Map Appendix FDOT Performance Measures Fact Sheets Figure 8 MPO Planning Requirements (FDOT Fact Sheet) Figure 9 PM1 Safety (FDOT Fact Sheet) Figure 10 PM2 Bridge & Pavement (FDOT Fact Sheet) Figure 11 PM3 System Performance (FDOT Fact Sheet) Figure 12 TAM Transit Asset Management (FDOT Fact Sheet)

 must apply a transportation performance-based planning approach to transportation decision-making.")
3 Introduction MetroPlan Orlando, the metropolitan planning organization for Central Florida, recently updated the region s Long Range Transportation Plan (LRTP) to include a Performance-Based Planning Process. The Moving Ahead for Progress in the 21st Century Act (MAP-21) Act enacted in 2012 and the Fixing America's Surface Transportation Act (FAST Act) enacted in 2015 require that the Florida Department of Transportation and metropolitan planning organizations (MPOs) must apply a transportation performance-based planning approach to transportation decision-making. The 2040 Long Range Transportation Plan includes Orange, Osceola, and Seminole counties, along with 23 municipalities, offering a regional approach to future transportation challenges and opportunities. MetroPlan Orlando, in cooperation with the state and public transportation operators, must now develop a Long Range Transportation Plan (LRTP) and Transportation Improvement Program (TIP) through a performance-driven, outcome-based approach to planning for metropolitan areas of the state that meet the federal planning factors. This addendum summarizes how MetroPlan Orlando is incorporating performance-based planning into the plans, programs and process for the Central Florida Region. Historically, project priorities have been established through the Long Range Transportation Plan Process and evaluated and discussed annually for the development of the Prioritized Project List (PPL). The current 2040 Long Range Transportation Plan was adopted on December 9, 2015 by a unanimous vote of the MetroPlan Orlando Board. This performance-based planning addendum was adopted in phases by unanimous votes of the the MetroPlan Orlando Board on: February 14,2018 Performance Measure 1: Safety June 13,2018 MPO Planning Requirements / MetroPlan Orlando Performance-based planning process November 14, 2018 Performance Measure 2: Bridge & Pavement Condition November 14, 2018 Performance Measure 3: Travel Time Reliability December 3, 2018 LRTP Addendum published on web 3
4 Planning Rule Framework The Federal Highway Administration (FHWA) and Federal Transit Administration (FTA) jointly issued a Planning Rule to document changes in the statewide and metropolitan planning processes consistent with the Moving Ahead for Progress in the 21st Century (MAP-21) Act and the Fixing America s Surface Transportation (FAST) Act. Among other changes, this rule specifies the requirements for State DOTs and MPOs to implement a performance-based approach to planning and programming. Under this framework, the three FHWA Performance Measures (PM) rules and FTA transit rule established various performance measures required to monitor the performance of safety (PM1), bridge and pavement (PM2), system performance (PM3), and transit asset management (TAM). The rules also indicate how MPOs should set targets, report progress, and integrate performance management into their Long-Range Transportation Plans (LRTPs) and PM1 Safety PM2 Bridge & Pavement Condition PM3 Travel Time Reliability (auto & freight) TAM Transit Asset Managemnt Plan Transportation Improvement Programs (TIPs). More details can be found in the Florida Department of Transportation (FDOT) Fact sheets located in the appendix. There are two methods for target setting: 1) MPO establishing their own target and reporting performance, or, 2) supporting the statewide target established by FDOT. For the three federal performances measures (PM1, PM2 & PM3) addressing the National Highway System and State Roads, MetroPlan Orlando by resolution supported the FDOT targets for Safety, Bridge & Pavement Condition and System Performance. Table 1 identifies the Performance Measures and Targets the MetroPlan Orlando Board supported. 4
5 Figure 1 Federal Performance Measures & Targets Federal Performance Measures Target Number of Fatalities (Motorized) Number of Fatalities (Transit) Number of Fatalities (Bicycle) PM1 - Safety Number of Fatalities (Pedestrian) Number of Serious Injuries (Motorized) Number of Serious Injuries (Transit) Number of Serious Injuries (Bicycle) Number of Serious Injuries (Pedestrian) Vision Zero: Zero (0) fatalities, Zero (0) Serious Injuries and Rate of Zero (0) per 100 million VMT Rate of Fatalities per 100 million vehicle miles of travel (all modes) Rate of Serious Injuries per 100 million vehicle miles of travel (all modes) PM2 - Bridge & Pavement Condition Percent of National Highway Bridges in good condition Percent of National Highway Bridges in poor condition Percent of interstate pavement in good condition Percent of interstate pavement in poor condition Percent of non-interstate pavement in good condition Percent of non-interstate pavement in poor condition > 60% in good condition & < 5% in poor condition > 40% in good condition & < 5% in poor condition > 50% in good condition & < 10% in poor condition PM3 - System Performance Travel Time Reliability Percent of interstate providing reliable travel times Travel Time Reliability Percent of non- interstate providing reliable travel times Truck Travel Time Reliability Index % reliable 50% reliable 5
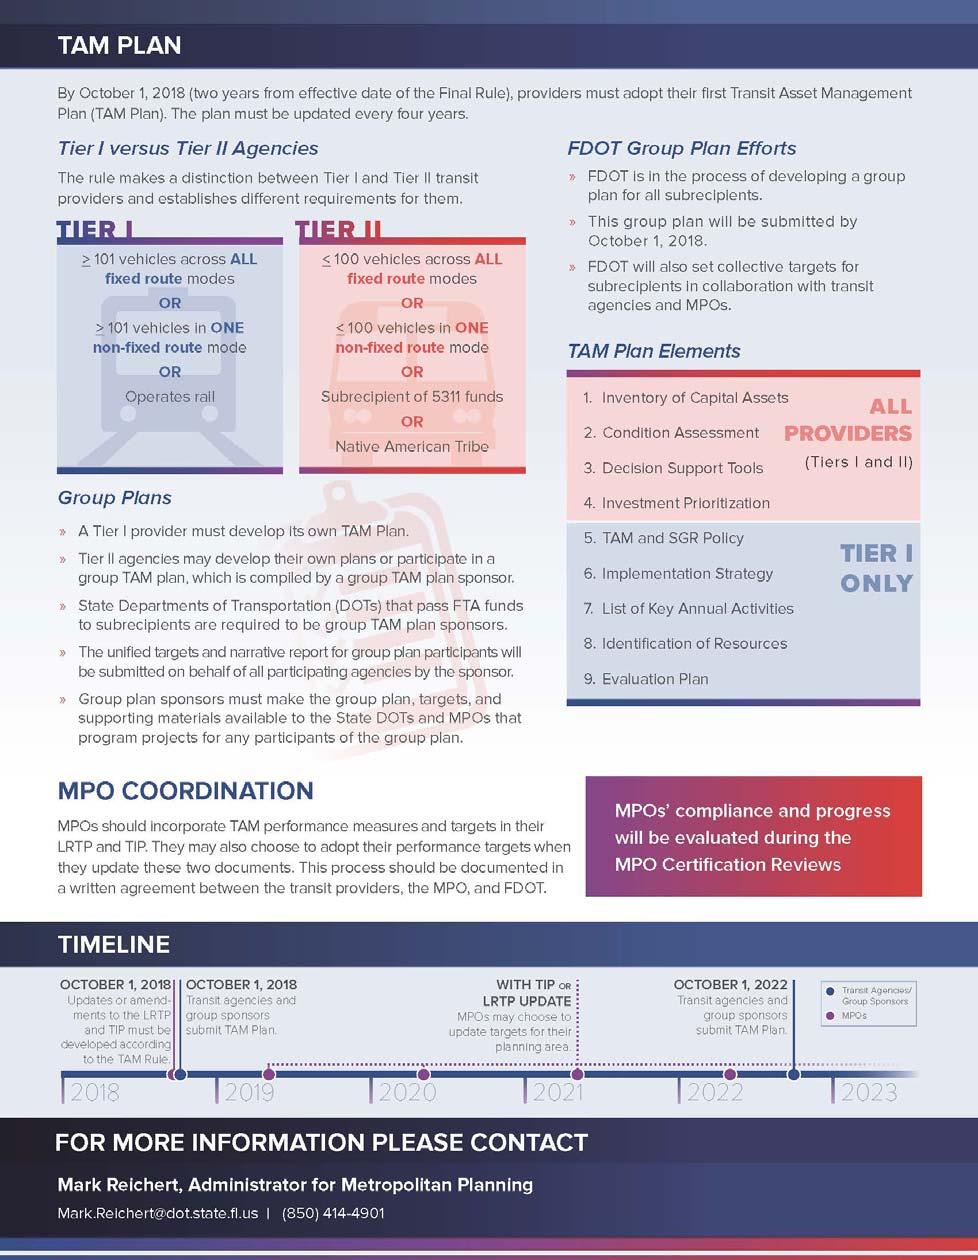
6 The Transit Asset Management (TAM) Rule is a set of federal regulations (49 Code of Federal Regulations [CFR] part 625) that sets out minimum asset management practices to guide transit providers on how to manage capital assets and prioritize funding to improve or maintain assets in a state of good repair (SGR). MetroPlan Orlando will incorporate TAM performance measures and targets into the performance monitoring, prioritization and the TIP process. MetroPlan Orlando has supported the performance targets established by LYNX (LYNX Transit Asset Management Plan and will be working to incorporate this into a written agreement between the transit providers, the MPO, and FDOT. Additionally, a committee made up of the Technical Advisory Committee (TAC), Transportation Systems Management & Operations (TSMO) and Community Advisory Committee (CAC) developed a set of localized performance measures important to the region and addressing rest of the federal aid system. Each performance measure includes an associated listing of the evaluation criteria to quantify these performance measures and targets. Each performance measure and target will be evaluated annually, and presented in a scorecard for the project prioritization process. 6
7 Figure 2 MetroPlan Orlando Performance Measures & Targets MetroPlan Orlando Performance Measures 1 Evacuation route lane miles per 1,000 household Target 4 Lane miles per 1,000 households Transportation System miles per person that include more than three (3) of the following (auto, transit, designated bike & sidewalk) designed and functioning up to code Federal Aid System Miles within 20 minutes travel time to Attractions (Auto/Transit) Federal Aid System Miles within 20 minutes travel time to Convention Center (Auto/Transit) Federal Aid System Miles within 20 minutes travel time to Regional Airports (Auto/Transit) Percent of Population within 30 minute travel time to Activity Center (Auto/Transit) Number of Performance Measures or indicators where Environmental Justice Areas fall below the regional measure or indicator Percent of Limited Access, Arterials & Freight Corridors with Average Speed / Posted Speed Ratio less than 0.75 Total Carbon dioxide equivalent Emissions in million metric tons Total Particulate Matter (Highest daily average reading for 2016) Total Ozone ( in 3 year (2016) fourth highest average in parts per billion) 75% 50% 90% 0 100% 3% less than 16.7mT (2016) 35 μg/m3 70 ppb 8 System miles that are actively managed / monitored (TSMO) 50% 9 % of System miles that have documented storm water issues 0% 7
8 2040 Regional Vision & Goals To incorporate the performance-based planning approach, MetroPlan Orlando will now evaluate corridors based on performance measures and an adopted set of targets that reflect the goals and vision of the region. Vision A regional transportation system that safely and efficiently moves people and goods through a variety of options that support the region s vitality Mission To provide leadership in transportation planning by engaging the public and fostering effective partnerships Consistent with the regional transportation vision, seven overarching goals were established for the 2040 Long Range Transportation Plan (2040 LRTP; Plan Overview). The vision and goals remain unchanged from the 2040 LRTP. Safety Balanced Multimodal System Integrated Regional System Quality of Life Efficient & Cost Effective Energy & Environmental Stewardship Economic Vitality 8
9 Performance Based Planning Process The purpose and intent of the process, is to link the adopted Long Range Transportation Plan goals and the Federal Planning Factors with Performance Measures to develop priorities for mobility projects that help achieve the Regional Vision and Goals. PERFORMANCE-DRIVEN, OUTCOME-BASED APPROACH TO PLANNING: (a) The MPO, in cooperation with the State and public transportation operators, shall develop LRTPs and TIPs through a performance driven, outcome-based approach to planning for metropolitan areas of the State that meet the Federal Planning Factors. The MetroPlan Orlando Performance-Based Planning process will utilize the Tracking the Trends as the required performance monitoring report, supporting the prioritization process as well as showing significant progress toward achieving performance measures and targets. The Tracking the Trends is an annual evaluation of the system s performance. The evaluation will now incorporate both the federal and local performance measures and targets established. The process will now include a technical ranking of corridors within the Central Florida Region based on the performance measures and targets established. The process will use a layering approach to identify the corridors that are not meeting the desired performance measurement and targets established for the region. Top-ranked corridors will be cross-referenced with cost feasible projects from the LRTP and the highest-ranked projects in the plan identified by performance measures and targets will be advanced into the TIP. Performance Measures and Indicators Long Range Transportation Plans Tracking the Trends Priority Project List Transportation Improvement Program 9
10 Figure 3 LRTP, Planning Factors & Performance Measure Linkage Safety Balanced Multimodal System Integrated Regional System Quality of Life Efficient & Cost Effective Energy & Environmental Stewardship Economic Vitality Long Range Transportation Plan (LRTP) Goals Economic Vitality Safety & Security Accessibility (people & goods) Protect Environment Integrated & Connected System Efficient System (M&O) Preservation of Existing System Resiliency & Reliability Travel & Tourism Federal Planning Factors Federal Performance Measures: Safety System Reliability Bridge Conditions Pavement Conditions MetroPlan Performance Measures: Evacuation System Multiple Modal Options on Corridors Efficient Accessibility to Regional Modal Facilities & Tourist Destinations Efficient Accessibility to Employment Centers & Services Reduction of Off Peak Congestion Improved Air Quality Actively Monitored Corridors (ITS) Resiliency of the System Addressing Traditionally Underserved Areas (Environmental Justice Areas, see Title VI Plan) Performance Measures & Targets MetroPlan Orlando Performance-Based Prioritization Process 10


11 Figure 4 MetroPlan Orlando Performance-Based Planning Process Long Range Transportation Plan Freight & Goods Plan Performance-Based Planning Process Tracking the Trends Bike / Ped Action Plan & Trails Transit Development Plan High crash id Worst travel time Poor Bridge Poor Pavement Top Ranked Corridors Cost Feasible Plan Performance Based Priority Project List Transportation Improvement Program 11
12 Reporting & Performance Monitoring Scorecard MetroPlan Orlando researches current Central Florida trends annually to help plan for the region s transportation needs. Tracking regional trends gives insight into where the transportation system is doing well and what areas need improvement. It also gives an indication of future needs. The Scorecard below will report each performance measure and target for three geographic areas. There will be an evaluation of system performance in the three-county regional planning area, the urbanized area of MetroPlan Orlando and the MetroPlan Orlando Environmental Justice Areas identified in the Title VI Plan Language-Plan-2018-FINAL.pdf. The Scorecard below represents system conditions from the 2015 calender year. MetroPlan Orlando will develop a new Tracking the Trends in 2019 using 2018 data. Figure 5 Federal Performance Measures Scorecard Federal Performance Measures Target MetroPlan Region MetroPlan Urbanized Area Environmental Justice Areas Number of Fatalities (Motorized) Number of Fatalities (Transit) Number of Fatalities (Bicycle) PM1 - Safety Number of Fatalities (Pedestrian) Vision Zero Zero (0) Number of Serious Injury (Motorized) fatalities, Zero (0) Serious Injuries and Number of Serious Injury (Transit) Rate of Zero (0) per 100 Number of Serious Injury (Bicycle) million VMT Number of Serious Injury (Pedestrian) Rate of Fatalities per 100 million vehicle miles of travel (all modes) Rate of Serious Injuries per 100 million vehicle miles of travel (all modes) PM2 - Bridge & Pavement Condition Percent of National Highway Bridges in Good condition Percent of National Highway Bridges in Poor condition Percent of interstate pavement in Good condition Percent of interstate pavement in Poor condition Percent of non-interstate pavement in Good condition Percent of non-interstate pavement in Poor condition > 60% in good condition & < 5% in poor condition > 40% in good condition & < 5% in poor condition > 50% in good condition & < 10% in poor condition % 0% 94.90% 5.10% LEGEND Meets the target Less than the target PM3 - System Performance Travel Time Reliability Percent of interstate providing reliable travel times Travel Time Reliability Percent of non- interstate providing reliable travel times 70% reliable 50% reliable Truck Travel Time Reliability Index 2 52% 84% 2.62 Exceeds the target Measure that needs to be reduced 12
13 Figure 6 MetroPlan Orlando Performance Measures Scorecard MetroPlan Orlando Performance Measures Target MetroPlan Region MetroPlan Urbanized Environmental Justice Areas 1 Evacuation route lane miles per 1,000 household 4 Lane miles per 1,000 households Transportation System miles that include more than three (3) of the following (auto, transit, designated bike & sidewalk) designed and functioning up to code per Person 75% Data not available 3 4 Federal Aid System Miles within 20 minutes travel time to Attractions (Auto/Transit) Federal Aid System Miles within 20 minutes travel time to Convention Center (Auto/Transit) Federal Aid System Miles within 20 minutes travel time to Regional Airports (Auto/Transit) Percent of Population within 30 minute travel time to Activity Center (Auto/Transit) 29.40% 50% 17.84% 21.44% 90% 90.42% 87.36% 92.60% 5 Number of Performance Measures or indicators where Environmental Justice Areas fall below the regional measure or indicator 0 7 LEGEND 6 Percent of Limited Access, Arterials & Freight Corridors with Average Speed / Posted Speed Ratio less than % Data not available 7 8 Total Carbon dioxide equivalent Emissions in million metric tons Total Particulate Matter (Highest daily average reading for 2016) Total Ozone ( in 3 year (2016) fourth highest average in Parts per billion) System miles that are actively managed / monitored (TSMO) 3% less than 16.7mT (2016) 16.2 mt 35 μg/m μg/m3 70 ppb 62 ppb 50% 30% Meets the target Less than the target Exceeds the target Measure that needs to be reduced 9 % of System miles that have documented storm water issues 0% Data not available Moving Forward with Performance Based Planning MetroPlan Orlando embraces and supports the Planning Requirements outlined in the Federal Legislation. Incorporating the process does not change the adopted 2040 Long Range Transportation Plan Goals or resulting Cost Feasible Plan ( It merely enhances the transparency of the planning and prioritization process for the local government partners, elected officials, and public. The adopted process will be used to further support a balanced system and implement the 2040 Long Range Transportation Plan. The process will remain the same, but MetroPlan Orlando will be beginning the development of the 2045 Metropolitan Transportation Plan (MTP) in early 2019, and the goals and performance measures may change to support the vision of Central Florida. 13

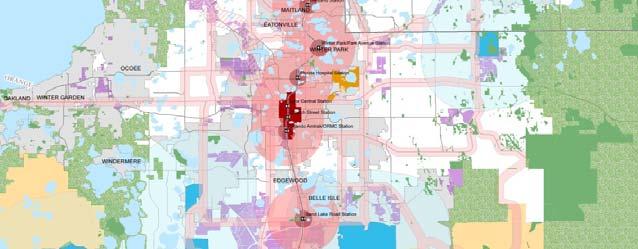
14 Figure 7 Adopted 2040 Cost Feasible Project Map 14
15 Appendix FDOT Performance Measures Fact Sheets MPO Planning Requirements Performance Measure 1: Safety Performance Measure 2: Bridge & Pavement Performance Measure 3: System Performance Transit Asset Management (TAM) 15

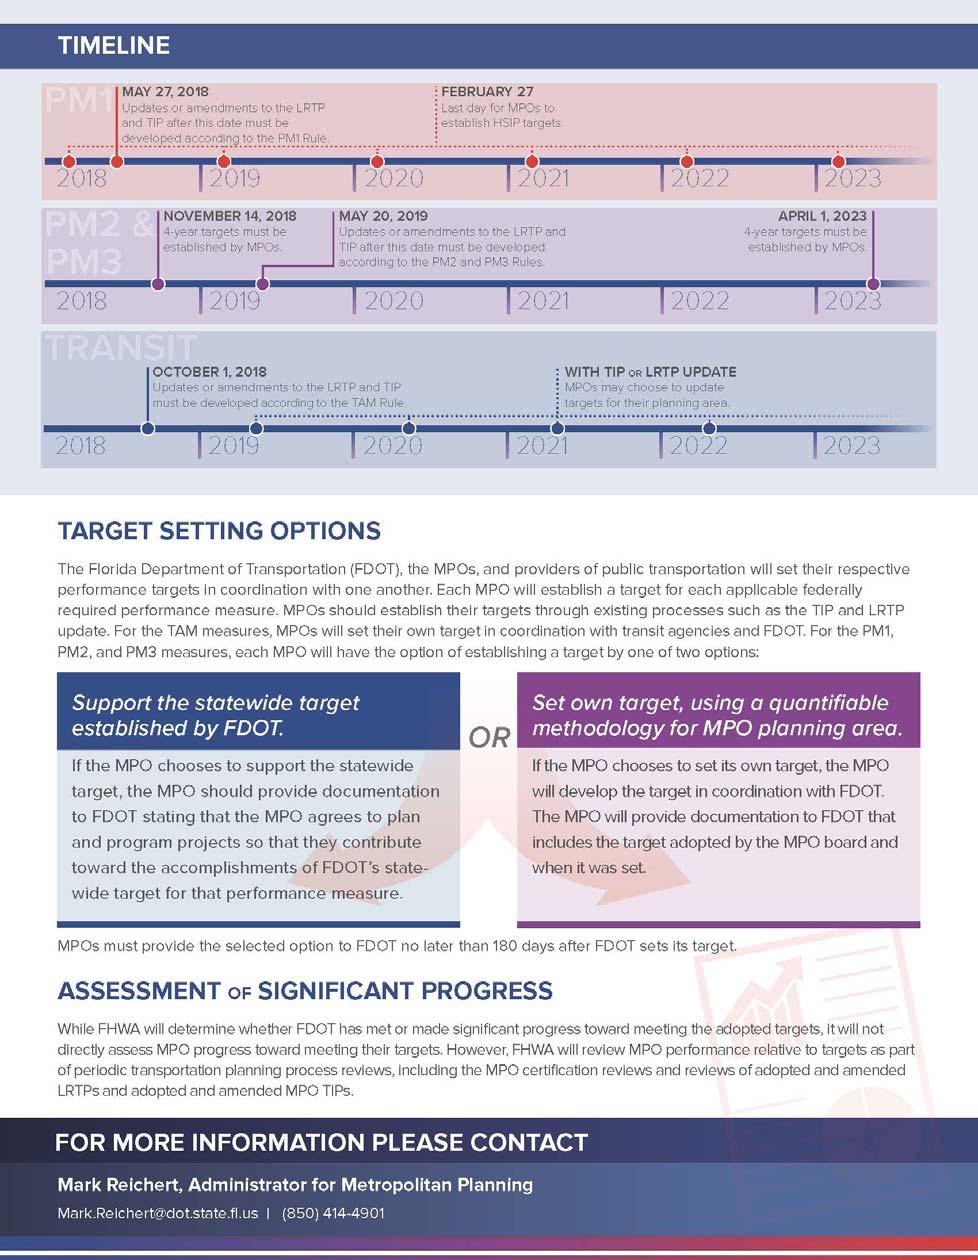
16 Figure 8 MPO Planning Requirements (FDOT Fact Sheet) 16
17 17
")
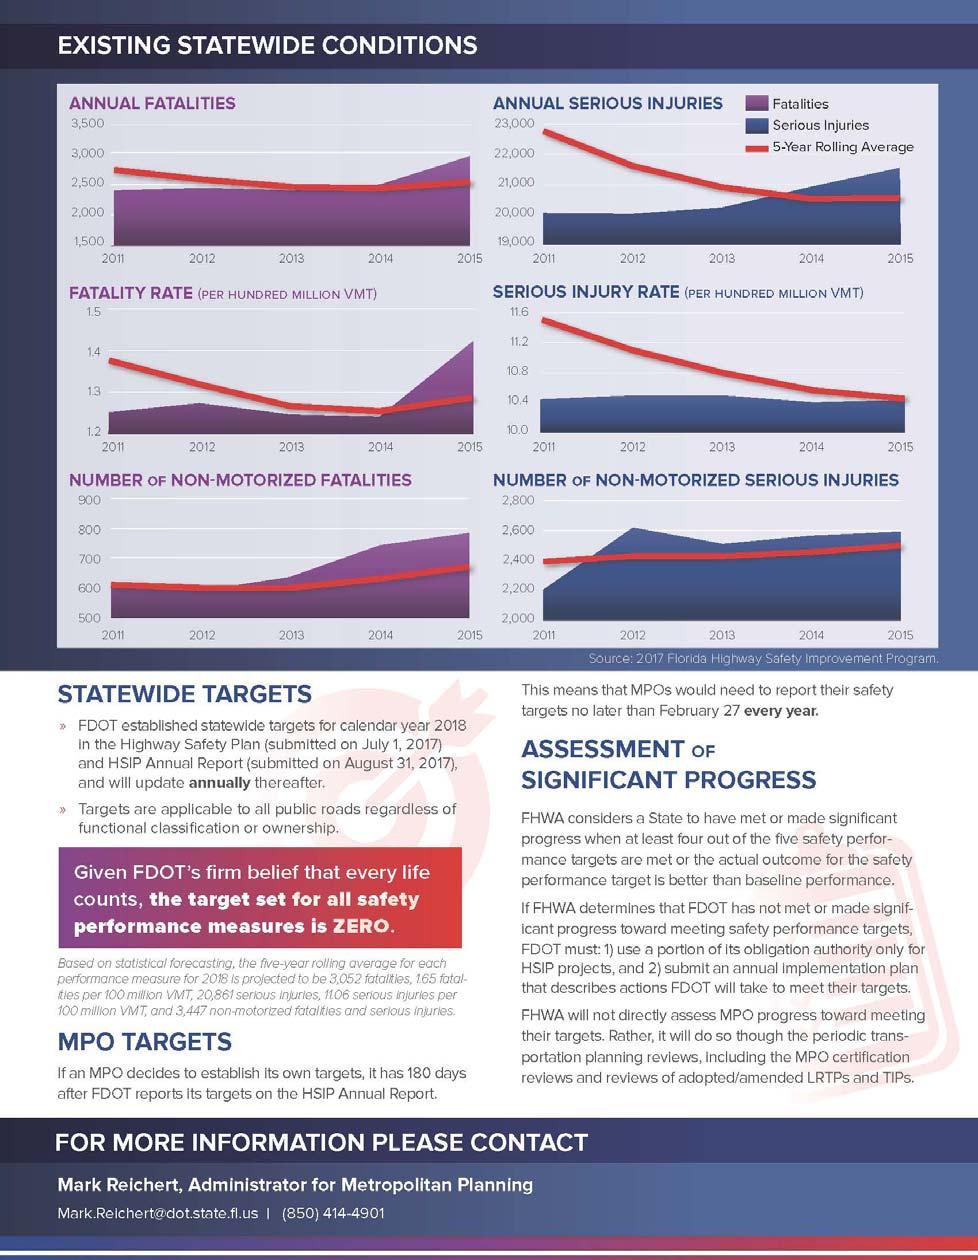
18 Figure 9 PM1 Safety (FDOT Fact Sheet) 18
19 19


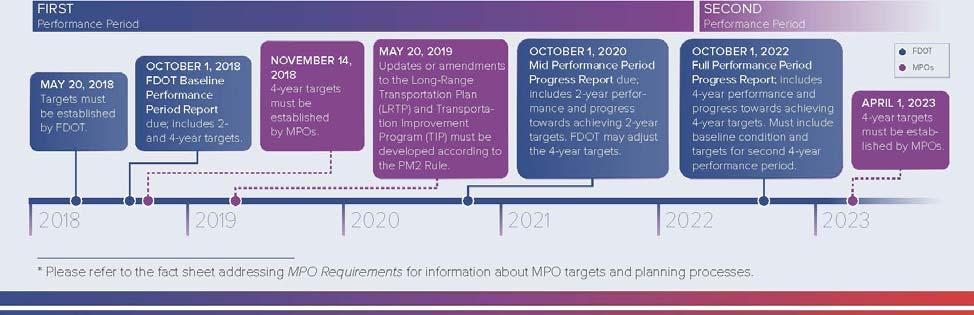
20 Figure 10 PM2 Bridge & Pavement (FDOT Fact Sheet) 20
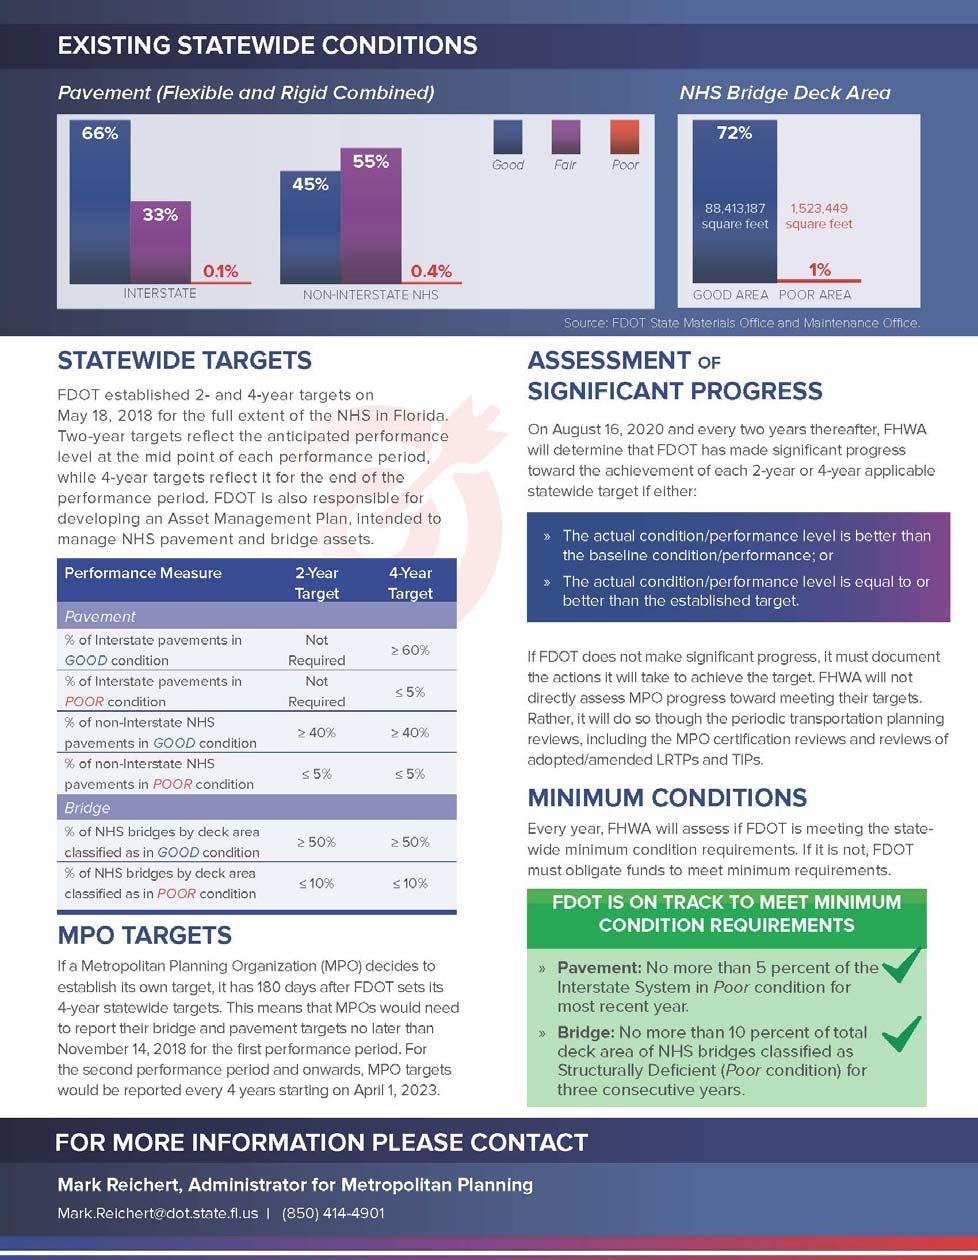
21 21

22 Figure 11 PM3 System Performance (FDOT Fact Sheet) 22
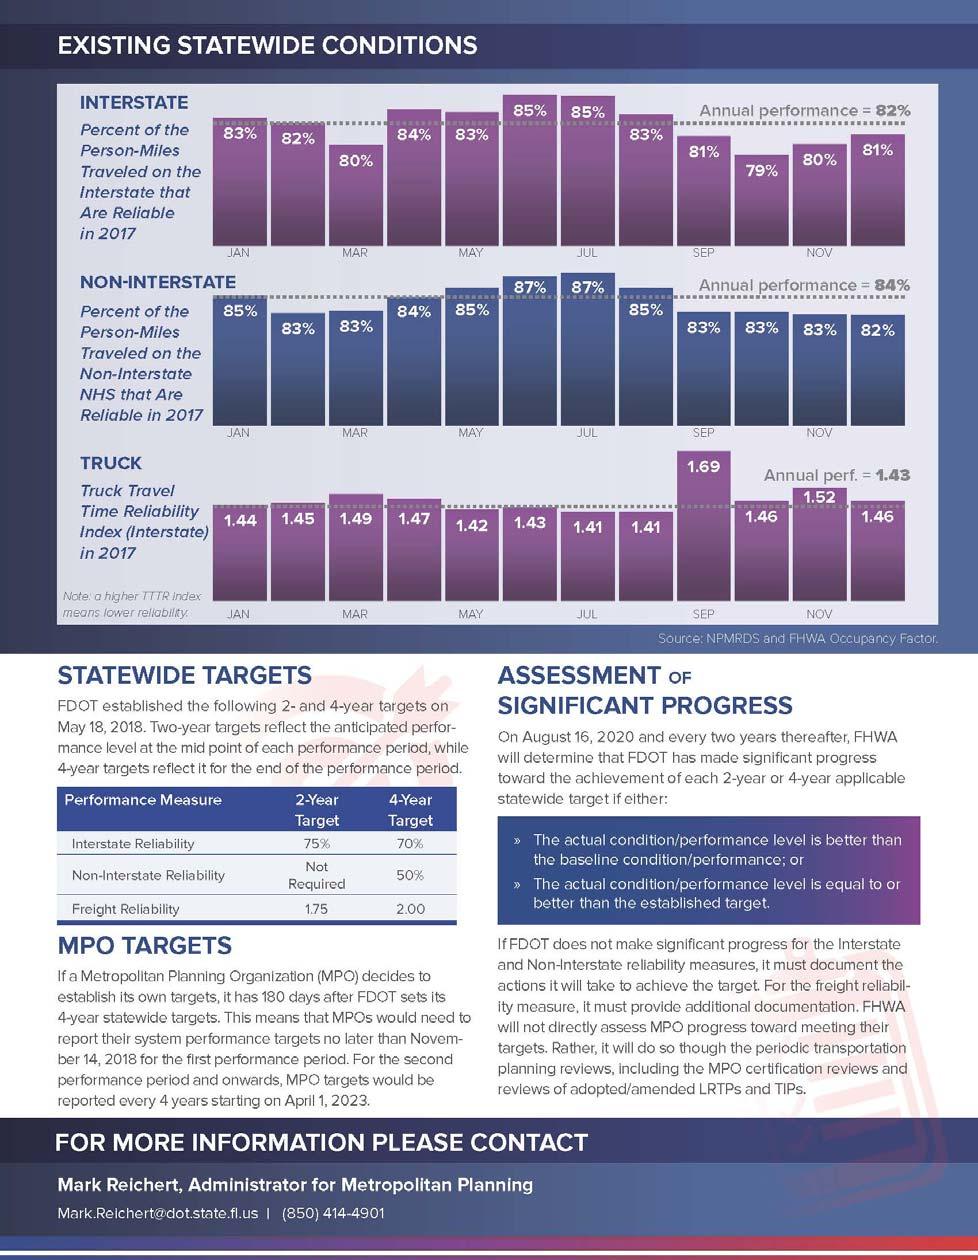
23 23
")
24 Figure 12 TAM Transit Asset Management (FDOT Fact Sheet) 24
25 25