Finding DVR s Transportation Links for Trade and Economic Development. Dr. Thomas H. Wakeman Stevens Institute of Technology 14 April 2010
|
|
|
- Mariah Butler
- 5 years ago
- Views:
Transcription

1 Finding DVR s Transportation Links for Trade and Economic Development Dr. Thomas H. Wakeman Stevens Institute of Technology 14 April 2010
2 U.S. - Leading Importer and Exporter in 2005 Value of International Trade in Goods and Services, All Modes, Top T 50 Countries, 2005 (World Bank) Canada United States China South Korea Japan Canada India United Kingdom Germany Netherlands Country Imports ($ bil USD) Exports ($ bil USD) Total ($ bil USD) France Italy United States 1,984 1,364 3,347 Germany 1,003 1,143 2,146 China ,548 United Kingdom ,272 1 Trillion Dollars Imports Exports Japan ,228 Countries
3 2009 Tonnage Falls 2.8%
4 Drivers of International Trade Structural Drivers Continue Offshoring of Manufacturing and Jobs Global Trade Agreements Containerization Cyclical Drivers Remain Trade has grown faster than GDP. Macro shocks have not impacted trends in global trade growth.
5 Approximately 13% NJ Jobs at Risk to Outsourcing Source:
6 Impact of Trade Agreements Free trade means more trade for the United States a key conclusion drawn from an analysis by the US Department of Commerce, International Trade Administration. U.S. exports to China grew by more than 25 percent from 2004 to Exports to India are growing at a similarly rapid pace, rising approximately 23.5 percent over the same period.

7 North American Free Trade Agreement Main Corridors
8 US Exports from 1962 to 2005 NAFTA EU-25 Japan China Other FTA Rest of World $ (billions) NAFTA Export flows have tripled between 1990 to Year Source: UN Merchandise Trade Data, Int l Trade Administration, U.S. Department of Commerce.


9 Containerization of Freight Original Ideal X Containerization started in Newark, NJ in In 2007, the world total containerized cargo was more than 74 million containers.

10 Global Container Flows 2007 TRANS-ATLANTIC 6.3 million TEU TRANS-PACIFIC 20.7 million TEU ASIA- N.EUROPE 18.6 million TEU INTRA-ASIA 28.3 million TEU Source: Drewry Shipping Consultants

11 World Economic Recovery Beginning in 2010
12 International Trade Flows Trade activity and container flows have shifted from the North Atlantic region to the Far East and intra-asia flows. While GDP growth is ~2-3% in U.S., in China it is expanding at about 10%, intra- Asia about 9%, and India near 8%.
13 World and US GDP: 1995 to ,000 50,000 Gross Domestic Product ($) 40,000 30,000 20,000 10, ~33% 2008 ~23% Year World (billions) United States (billions)
14 U.S. GDP Correlated to Trade $12,000 $10,000 US Trade ($Million) $3,000 $2,500 GDP $8,000 $6,000 $4,000 $2,000 $ GDP Global Trade $2,000 $1,500 $1,000 $500 $0 Source: Global Insight Global Trade
15 What Has Changed? The international economic contraction has transformed the global logistics chain as consumption of durable goods dropped. Cost of energy has fluctuated but will increase as competition for oil grows. Climate change is a international concern. BUT, global population growth will remain the primary driver of increasing demand for energy, resources, and consumer goods, particularly in emerging markets.
16 World Trade Will Grow


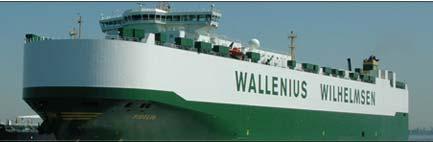
17 Global Logistics & Shipping
18 Four Mega-Trading Blocks Russia Europe China India


19 Two Mega-Trading Blocks North America South America


20 North American Exports are Key to U.S. Recovery


21 National Export Initiative In February, President Obama launched the National Export Initiative (NEI), which aims to double exports over the next five years. This initiative is envisioned to significantly increase the volume of American products entering the global marketplace. Beyond the export of service sector products, these exports include agricultural goods, manufactured products, and natural resources. The President declared that exports are important to boost the U.S. GDP, reduce the trade deficit, and help stimulate job creation.
22 Logistics Chains Global Multi-National (e.g., NAFTA) National/Federal (EU) Megaregions, Multi-state, Market-oriented, Trade Corridors State Metropolitan Local/Site
23 What can we learn from others? The Mississippi Valley Freight Coalition (MVFC) is a regional organization that cooperates in the planning, operation, preservation, and improvement of transportation infrastructure in the Mississippi Valley region. A Memorandum of Understanding was placed before state DOT executives in the Mississippi Valley region, received wide approval, and was signed following some revisions. One major change that occurred was the broadening of the Upper Midwest region to incorporate all Mississippi Valley states. The ten states of the Mississippi Valley region now share their key interstate corridors, inland waterways, and the Great Lakes as a regional responsibility.


24 Upper Midwest Freight Corridor 10-states Working Together

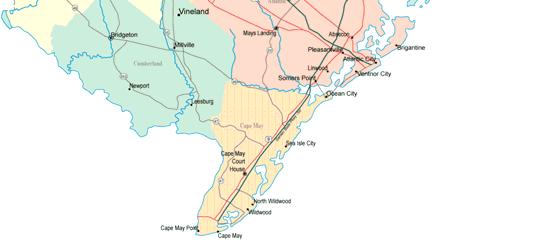
25 Philadelphia-Camden is well- situated to be the International Gateway for the Northeast...and a key national corridor for domestic freight movement.
26 Formation of a Port Pole A Port Pole is a freight logistics platform of collaborating ports that attract cargo because of their combined capacity, enhanced resiliency to shocks, and ability to contribute value through economies of scope and scale. Examples of existing port poles include the LA(16)-LB(17) port complex, ports of Rotterdam(9)-Antwerp(13), and ports of Hamburg(11)-Bermerhaven(19).
27 Two Gateways One Port Collaborations of the Port of New York and New Jersey(20) with the Port of Philadelphia-Camden could form a new port pole that serves the Northeast, Midwest and the Nation. North Port (PANYNJ) is the import gateway... moving containerized goods quickly into the region and the hinterlands... and connects to: South Port (P-C) is the bulk cargo and container export gateway... making use of available local land and labor resources in South Jersey and the Philadelphia region to increase efficiency.


28 Maritime Freight Platforms Port of NY & NJ NORTH PORT Philadelphia-Camden Port Complex SOUTH PORT
29 Available Resources DVRPC's Freight Planning Program Port Authority of New York and New Jersey s capital program NYSA s Economic Impact of the New York-New Jersey Port Industry NJ DOT s Freight plan NJ DOT s South Jersey Freight Transportation and Economic Development Assessment


30 The Economic Impact of the New York-New Jersey Port Industry 2008 Prepared by: In Association with: September
31 NORTH PORT Anchor Role The NYSA economic study showed that operations at the Port of New York/New Jersey provide: A total of 269,990 full-time jobs in the region; More than 164,900 direct jobs; Nearly $36.1 billion in business income; and Over $5 billion in tax revenues. It is a significant economic engine that operates to meet the international cargo demands of the largest consuming region in the nation.


32 South Jersey Freight Transportation and Economic Development Assessment Delaware Valley Goods Movement Task Force


33 SOUTH PORT Building a Vision to Focus on Key Freight Issues and Opportunities in Philadelphia-Camden Region

34 A recommendation to DVRPC, NJTPA, DOTs, etc. Create an import-export freight platform for the Northeast


35 Port of New York, New Jersey and Pennsylvania or Port of Pennsylvania, New Jersey and New York


36 Using Trade and Transportation to Generate Economic Development and Jobs for the Region and Nation IMPORTS EXPORTS North Port South Port Corridor
37 Two Gateways One Port North Port is the import gateway... Moving containerized goods quickly into the region and the hinterlands... and connects to: South Port is the bulk cargo and container export gateway... Making use of available local land and labor resources in DVR. They work together as a port pole to provide the Northeast and the Nation with import and export transportation services.


38 Connectivity is a key ingredient! S/N Supply Chain Corridor Envisioning a east-west and north-south supply chain corridor for both Pennsylvania and New Jersey...and the Northeast.

39 Delaware River Dredging Project An opportunity for... Job creation Economic development Improved resiliency Greater sustainability and Increasing U.S. exports competitiveness in the global marketplace.
40 Program to Expand Use of America s Marine Highways Wednesday, April 7, 2010 U.S. Transportation Secretary Ray LaHood today unveiled a new initiative to move more cargo on the water rather than on crowded U.S. highways. Under the America s Marine Highway program, the Department s Maritime Administration (MARAD) will help identify rivers and coastal routes that could carry cargo efficiently, bypassing congested roads around busy ports and reducing greenhouse gases.
41 Conclusions World trade will continue to grow, and the U.S. must be aggressive to achieve its objectives. The United States has a 5-year export initiative that will demand transportation services and competitive international gateways. Today s gateways operate at levels that utilize economies of scope and scale and multimodalism. There is an opportunity to form a new port pole or freight platform in the Northeast if there is collaboration among stakeholders in 3 states.