Urner Barry Conference, May 4, 2014 William C. Duggan, Jr, Maersk Line North American Refrigerated Services. By Land and By Sea: Today s.
|
|
|
- Estella Richardson
- 5 years ago
- Views:
Transcription
1 Urner Barry Conference, May 4, 2014 William C. Duggan, Jr, Maersk Line North American Refrigerated Services By Land and By Sea: Today s Transportation Capacities, costs and coverage
2 Agenda Key Messages Industry Financials Industry Players What is Slow-steaming The Global and USA Reefer Market The Reefer Container Challenge The Reefer Rate The Future Questions


3 My key messages today MAERSK LINE REMAINS COMMITTED TO THE REEFER BUSINESS THE SHIPPING INDUSTRY IS STILL FACING SIGNIFICANT CHALLENGES PARTNERSHIPS AND SERVICE INNOVATION WILL BE FUTURE VALUE DRIVERS
4 SECTION 1: SECTION 1: INDUSTRY FINANCIALS
5 Our industry is faced with significant challenges ,000,000,000,, ,000,000, ,400,000, ,700,000, ,000,000 Total -8,853,000,000
6 With only 6 of 17 carriers turning a profit in 2013 Full year 2013 operation profit In USD millions NYK MOL Zim HMM COSCO Evergreen APL CSAV Hanjin Ming Shipping Yang China Maersk CMA Hapag Lloyd Wan Hai OOCL K Line Source: Alphaliner, Issue 14, 2014
7 average carrier operating margin by quarter 15.2 %
8 The overall market outlook is very bleak Index 2005 = 100 Supply (Alphaliner) Demand (Drewry, Clarkson) 100 Forecast Source: Public corporate reports

 200 180 160 Inflation 140 120 100 For the")

 40 20 0 2005")
9 The price of our product has not kept up with inflation Development of rates vs. inflation January 2005 December 2011 Index 2005: Bunker Prices (Clarkson s) Inflation For the last 6-7 years, rates (including BAF) have not been able to keep up with the development of bunker costs and inflation This has eroded our revenue base, making it more difficult to invest in better solutions for you Freight rates (CCFI) Source: Clarkson s, CCFI
10 SECTION 2: INDUSTRY PLAYERS
11 The Inter-Alliance Arms Race in Deliveries <3,000 TEU 3,000-6,000 TEU 6,000-10,000 TEU >10,000 TEU Maersk 2 9 MSC 3 2 CMA CGM 1 8 P3 Total APL 6 2 HMM 5 MOL 1 6 H-L 1 3 NYK OOCL 2 2 G6 Total COSCO 4 K-Line YM 4 1 Hanjin 1 5 Evergreen 10 8 CKYHE Total CSCL 10 CSAV 2 Hamburg Sud 4 10 PIL 7 UASC 2 1 Independents Total Source: Alphaliner
12 The Race Will Continue in Deliveries <3,000 TEU 3, ,000-6,000 10,000 TEU TEU >10000 TEU Maersk 7 MSC CMA CGM P3 Total APL HMM 2 MOL HL H-L NYK OOCL 2 G6 Total 2 2 COSCO KLi K-Line 5 YM 1 10 Hanjin 1 2 Evergreen 3 CKYHE Total CSCL 3 CSAV 6 Hamburg Sud 1 PIL UASC 12 Independents Total 6 16 Source: Alphaliner
13 SECTION 3: SLOW-STEAMING STEAMING


14 What is Slow Steaming? Slow steaming is defined as operating a vessel below 60% of maximum engine load Ships are not sailing with the same speeds in the entire roundtrip of a service; speeds vary from leg to leg 1-2 extra vessels are added to ensure the same service frequency (e.g. one port call per week) Slow steaming is an industry wide practice with benefits to reliability, cost and the environment


15 Industry Wide Practice Global carriers throughout the industry had adopted slow steaming Slow steaming absorbed 4.1% of the global fleet at one point according to industry consultant AXS Alphaliner, and has helped significantly reduce the problem of idle fleet caused by the economic downturn Given the benefits of slow steaming, this practice is likely to be maintained across the industry.
16 SECTION 4: GLOBAL & US MARKET


17 Global Market Reefer Cargo Largest and fastest growing segment At 4.8% CAGR from (or 36.3m MT) Source: Drewry Container Forecaster
18 Seasonal demand creates pressure in Q1-Q2 Q2 ECSA WCSA CAM ROW

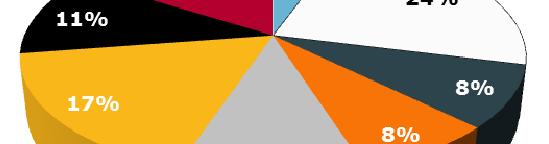

19 Maersk Global Reefer Composition Export share Import share


20 USA Reefer Market
21 SECTION 5: CONTAINER CHALLENGE
22 Global Cellular Container Fleet by size Range 5,122 Total number of vessels Total TEU ship Capacity 16,701,264 22M 2.2M 13.2% Reefer Capacity (TEU) Source: Drewry June 2013) Reefer e Shipping Market
23 15 15 Major Reefer Carriers 1.63M TEU 74% Representing of the total reefer container fleet Reefer Containers Ship Capacity (TEU) Reefer Container Carrier Share TEU TEU/Ship Reefer cap Reefer Total Reefer/Total APL 4.7% 104, , ,900 19% China Shipping 0.9% 20, , ,600 17% CMA CGM 6.0% 133, ,200 1,476,900 22% Coscon 1.7% 37, , ,500 16% CSAV 2.0% 44, , ,599 27% Evergreen 3.7% 82, , ,300 23% Hamburg Sud 5.2% 115, , ,900 37% Hanjin 1.9% 41, , ,600 17% Hapah- Lloyd 3.3% 73, , ,700 21% "K" Line 1.5% 32, , ,800 17% Maersk Line 23.2% 510, ,000 2,623,700 24%
24 Actual reefer carrying capacity: container versus conventional Container Conventional
25 Reefer Equipment will be a bottleneck in , , ,000 80,000 40, ,875 14,556 14,040 12,930 15,487 14,430 23,595 29,090 13,676 20,763 69,300 72,998 21,436 66,514 61,683 68,613 15,668 55,432 50,702 19,216 44,000 47,616 27,099 36,500 48,000 18,761 54,545 46,807 54,543 57,270 60,133 63,140 66,297 69,612 16,000 22, E 2013E 2014E 2015E 2016E Market Growth Container Scrapping Break Bulk Scrapping Market Growth Container Scrapping Break Bulk Scrapping Reefer Container Production Est. Reefer Container Order Reefer Container Production Assumptions: Market growth estimated t at 5% annually from 2014 onwards Container scrapping based on a 13 year lifespan Production for 2013 has been reduced to 82,000 FFE which is approx 60,000 unit below max production capacity BB vessel scrapping continues The containerized reefer market has grown strongly since 2008 and reached a share of 75% of total t reefer


26 Investment is essential to meet market growth Investing in reefer equipment must be financially sustainable Cost of capital warrants a contraction of supply in the reefer market 1,400 A.P. Moller Group has cancelled planned investments of USD 500 million in new FFE (thousand d) 1,200 1, % market growth Industry reefer container demand Scenario 1: Maersk invests 9 % capacity gap! equipment for 2014 If Maersk Line does not recommence investment, global reefer container demand will outstrip supply by 9% by Scenario 2: Maersk halts investment b USD total investment cost in 2013 just to maintain existing reefer equip fleet
27 Direct containerization will increase ~ 2% p.a. in coming years while the break bulk fleet will shrink Containerization will be driven by break bulk scrapping which will reduce the break bulk fleet by around 30% in the next 5 years and a further 25% until 2024 In recent years, low prices for containerized reefer have pulled demand d away from the break bulk market With increasing prices in the container market, the containerization i ti in coming years will be mainly driven by the scrapping of break bulk vessels Reefer break bulk fleet, (Start of year, FFE) 120, ,000 80,000 60,000 40, ,933 18,364 33, , ,955 21,601 23, ,458 15,079 # of vessels The scrapped reefer capacity is estimated to be fully replaced by containerized reefer 20, ,318 16,318 16,318 9,311 2,841 6,470 6, ,841 Source: Lloyd s list, Monaco Shipping
28 Both containerization and break bulk scrapping have been consistently growing in recent years The break bulk fleet has been constantly decreasing with ~ 6% p.a. & very few deliveries Average reefer break bulk fleet, Since 2008, containerized reefer demand has grown 3-6% p.a. stronger than total reefer Reefer break bulk containerization, (%) 160, , # of vessels 7% 6% 5.7% 120, ,000 80, % 4% 3.4% 3.7% 4.2% 4.4% 60,000 3% 40,000 2% 20,000 1% Scrappings Deliveries % Source: Drewry, Lloyd s list, Monaco Shipping
29 Reefer container fleet Source: Harrison Consulting and Nordea Markets
30 Major carriers reefer equipment fleet Owned Fleet Leased Fleet Total Fleet Total Mkt Share Containerized Mkt Share ML % 24% MSC 40,000 80, ,000 5% 6% CMA CGM 50,000 70, ,000 5% 6% Hamburg Süd 90,000 10, ,000 4% 5% APL 38,000 42,000 80,000 3% 4% CSAV 10,000 70,000 80,000 3% 4% Hapag-Lloyd 45,000 21,000 66,000 3% 4% Evergreen 59,000-59,000 2% 3% MOL 32,000 18,000 50,000 2% 3% Hanjin 35,000 7,000 42,000 2% 2% Other lines 426, , ,000 27% 37% Total Container Carriers Conventional Carriers 1,250, , ,850, % 100% 26% Source: Drewry Reefer Shipping Market Review and Forecast, Annual report, 2013/14
31 Growth of containerized reefer demand is driven by 3 main drivers Slide 31 1 Population growth Demand for reefer goods increases when the number of people continues to grow worldwide 2 Income effect The wealthier people become the more goods they demand 3 Containerization The conversion of reefer transportation from break bulk vessels into reefer containers An increase of general reefer demand leads to additional containerization as the break bulk fleet cannot absorb it Growth of containerized reefer demand
32 Overall, the containerized reefer demand is expected to grow by around 5.2% per year Containerized reefer demand , y/y growth (%) 6% 5% 2.5% 5.2% 4% 3% 1.5% 2.7% 2% 1.2% 1% 0% Population Growth Income Effects Subtotal Containerization (Direct Total + Indirect)
33 SECTION 6: SECTION 6: THE REEFER RATE
34 During the last 8 years our reefer rates have not covered inflation nor the rising bunker prices Index 2005= Bunker price Maersk Line reefer rates (incl. BAF) Inflation (world) Source: Maersk Line internal data, IMF, bunker prices for ROT 380 CST
35 FUTURE Where is the reefer business heading?


36 Macro drivers POPULATION GROWTH FOOD SAFETY EXTREME WEATHER GLOBAL CONNECTIVITY 9 bln by 2050 Legislation Global Warming One market Middle class of 40% Food contamination Unpredictability Trade barriers Food shortage Traceability Forecasting More Opportunities


37 Industry value drivers CONTRACTS SERVICE LEVEL AGREEMENTS EASE OF DOING BUSINESS TRANSPARENCY Continuity Win-Win Accessibility Traceability Long Term On time Exceptions E2E Cold-Chain Innovation Forecasting Handling Claims Trust


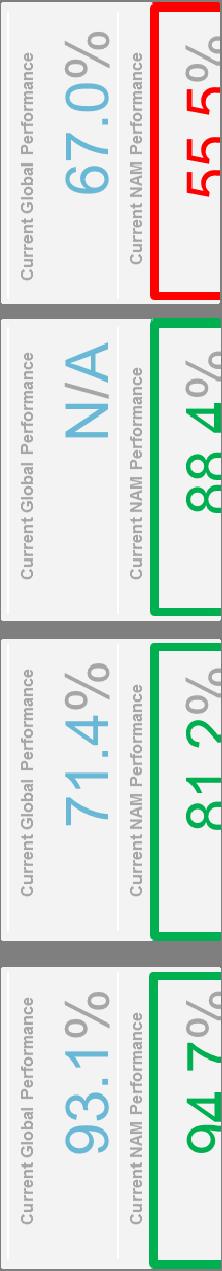
38 Our promise to you Customer Charter- through week 15
39 The Future Ball Game New and emerging markets will grow fast Food shortages and increased commodity prices Retailers want more control over their refrigerated supply chain Increased focus on health, food safety and environment Partnership & collaboration will increase to drive out waste: this will include reciprocal service level agreement Full transparency in the cold chain
40 Key takeaways As an Industry, Carriers are losing big money The price paid in today s market for international shipping does not cover cost of capital While markets, vessel plug & capacity grows, the reefer equipment is not Alliances and cost savings will be the way of the near future Closer partnerships between carrier and shipper is critical
41 Questions?