Distributed by. Timothy M. Zygula
|
|
|
- Candice Cannon
- 5 years ago
- Views:
Transcription
1 Use of Process Simulation for Distillation Design Timothy M. Zygula Westlake Styrene Corp. 900 Hwy. 108 Sulphur, La Pamela C. Dautenhahn, Ph.D., P.E. McNeese State University College of Engineering and Technology P.O. Box Lake Charles, La "Copyright 2000 Timothy M. Zygula and Pamela C. Dautenhahn, Ph.D., P.E." All rights reserved Not to be uploaded to any other web site without written permission from the copyright holder. Distributed by Timothy M. Zygula NOVA Chemicals Inc Port Road Pasadena, TX (Fax) 1
2 Use of Process Simulation for Distillation Design Timothy M. Zygula Westlake Styrene Corp. 900 Hwy. 108 Sulphur, La Pamela C. Dautenhahn, Ph.D., P.E. McNeese State University College of Engineering and Technology P.O. Box Lake Charles, La Presented at the AIChE Spring National Meeting 5-9 March 2000 Atlanta "Copyright Timothy M. Zygula and Pamela C. Dautenhahn, Ph.D., P.E." March
3 ABSTRACT The focus of this publication will be to demonstrate how to use a process simulation package to successfully design a distillation column. The authors will present two test cases: a methanol and water system and a benzene, toluene, and cumene system These systems will be used to demonstrate the steps to obtain a good design using a process simulation package. First, equilibrium data results from the simulation will be compared to the literature data. The equilibrium data will be compared to results obtained from three commercial process simulation packages. Once the equilibrium data from the simulations have been determined to be reasonable, a step-by-step procedure will be provided demonstrating how to make sure your simulation results provide a successful design. These steps will be based on steps using graphical analysis techniques to evaluate simulation results. Finally, the authors will provide guidelines to select the correct mass transfer internals for the above mentioned design cases. 3
4 INTRODUCTION In recent years the use of commercial process simulation packages for distillation column design has increased dramatically. Process simulation packages have made performing design calculations for distillation column significantly easier. Conversely the job of evaluating a simulation design to see if it is an optimum design or to see if the design simply will work falls to the engineer. The most difficult part of using a commercial process simulation package is determining if the design you get is a good design. Once a converged design is obtained there is no guarantee that the design is optimized or that the design is viable. Only using the proper techniques to evaluate a simulation design can the viability of a design be determined. There are many factors to consider when designing a distillation column using a commercial process simulation package. The first concern is the thermodynamic package used in the design. Is the equation used correct for your system? Will the package used model your system accurately? The next concern is the design calculations for the internal vapor liquid traffic. Is the design optimal to minimize the tower diameter? Can the reboiler and condenser duties be lowered? These type of parameters will have a big impact on the final phase of the design. This is why it is important to make sure the design is optimized. An optimized design will have a big impact on the sizing of the column, design of the internals, and overall cost of the project. The focus of this publication will be to present some guidelines to follow when using a commercial process simulation to design distillation equipment. The authors will present two design cases using three different process simulation packages for comparison purposes. The systems used in the design cases are as follows: 1. Methanol/Water 2. Benzene/Toluene/Cumene These cases will be used to demonstrate the required steps needed to obtain a good design using a process simulation package. First, equilibrium data results from the simulation will be compared to the literature data on these systems. Once the equilibrium data from the simulation have been determined to be reasonable, a step-by-step procedure will be provided demonstrating how to make sure your simulation results provide a successful design. A graphical design technique will be used to evaluate simulation results. An optimal design for each system will be presented. Finally, the authors will provide some guidelines in selecting mass transfer internals for the above mentioned design cases. 4
5 SIMULATION MODEL When a distillation column is being designed it is necessary to understand the separation to be made. Research is important, the more information you can obtain on the system the easier it is going to be to build your design model. The first step is to set the values for a complete set of independent variables. The feed variables need to be fixed (temperature, pressure, composition, and flow). This is extremely important because in order to have a good operating model the feed variables need to remain constant. With the feed variables set it is necessary to pick near-optimum values for the reflux ratio, column pressure, and the product purity. From this set of independent variables, it is possible to determine the number of theoretical stages needed to achieve the desired separation. The parameters previously stated need to be determined before a simulation model can be built. Column Pressure Choosing the operating pressure of the column is not as easy as it sounds. There are many factors to be considered when selecting an operating pressure. Often the type of separation being performed determines the operating pressure. Some of the factors that need to be considered when selecting an operating pressure are: 1. At higher operating pressures the relative volatility of the system is lower which increases the separation difficulty. As a direct result of increased separation difficulty the reflux requirements for the column would increase. The column would also require more stages and increased duties for the reboiler and condenser to perform the separation. 2. At higher operating pressures the temperature in the bottom of the column increases. This increases the amount of chemical degradation, polymerization and fouling that occurs. 3. At higher operating pressures the reboiler temperature rises, thereby requiring a more expensive heating medium. If the same heating medium is used a reboiler with a larger heat transfer area would be required. 4. Increasing the operating pressure would increase the vapor density and therefore the vapor handling capacity. This would lead to a reduction in the diameter of the column, which would reduce the capital equipment costs. 5. At higher operating pressures the distillate boiling point increases which allows the use of a cheaper cooling medium in the condenser. If the same cooling medium is used a condenser with a smaller heat transfer area would be required. 5
6 These are some of the factors to consider when setting the column pressure. The process of obtaining the most optimum operating pressure is lengthy. All factors must be considered and the economics of each case compared (1). Minimum Stages/Minimum Reflux Before a simulation model can be constructed it is important to determine the minimum amount of theoretical stages required for a particular separation. It is also necessary to determine the minimum reflux required. There are several short-cut methods that can be used to determine these two parameters. These methods are listed in most distillation design books. These parameters can also be obtained by using your simulation runs with specified conditions. Once a rigorous computer simulation is constructed it will be possible to determine the optimum number of stages and optimum reflux ratio (1). Physical Properties Physical properties are critical to the success of a simulation model. Physical properties are also very important to the accuracy of the model. Sometimes poor physical property data may even prevent your simulation model from converging. The most typical problem is missing parameters in the thermodynamic package used. This is not unusual in most commercial simulation packages. Physical property parameters for most compounds are not known for every thermodynamic model at every pressure and temperature range. Many times this fact is overlooked when a design model is constructed. Simulation models are constructed and executed with thermodynamic parameters missing. The model may appear to be correct but is completely wrong because of the missing thermodynamic data. Then there is the problem that all of the thermodynamic data are present but the data are not accurate. This problem is even worse than the problem of missing data. The problem with incorrect thermodynamic data is that the results from a simulation model will appear to be correct but the results are totally wrong due to incorrect data. Most simulation packages won t alert the users that there is a problem. It is the job of the user to determine if the results from a simulation model are accurate (2). The best way to confirm if your thermodynamic data are correct is to see if you can find any laboratory data or data from literature on your system. This may not always be practical because good thermodynamic test data are hard to find. Sometimes that data may have to be generated in a pilot plant before any design work begins. Research the system being modeled. Published thermodynamic data on the system being modeled may exist. If data are obtained, the data must cover the same temperature and pressure range that you are designing. Next, run a simulation with the same system and see if you can match the data. Simulation Accuracy 6
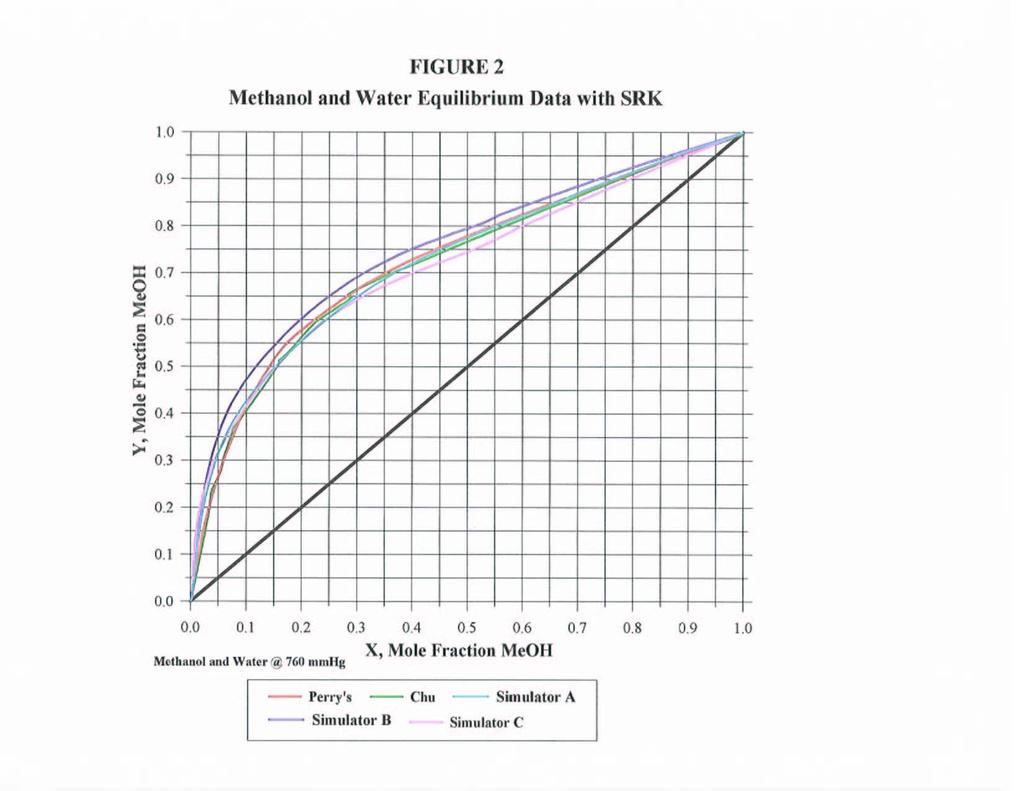
7 In order to determine the accuracy of a simulation it is always desirable to construct a McCable-Thiele diagram from the data generated from the simulation. The data from the simulation can be easily transferred to a software package where the graph can be constructed. This graph is used more as a tool to identify possible problems that won t be discovered until the column fails. The following is a list of the areas where a McCable-Thiele diagram can be used as a powerful analysis tool (1). Test Cases 1. Pinched regions - Pinching is readily seen on an x-y diagram. 2. Mislocated feed points - The feed point should be where the q-line intersects the equilibrium curve. This is generally the rule in binary distillation. However, it is not always true in multicomponent distillation. A key ratio plot is often developed in the design phase. This type of plot is far superior to an x-y diagram for identifying mislocated feeds, especially with large multicomponent systems. 3. Determining if the column is being over refluxed or reboiled - This can be recognized by too wide of a gap between the component balance line and the equilibrium curve throughout the column. 4. Identify cases where feed or intermediate heat exchangers are needed. The results from two test cases will be examined. The first case is a methanol/water system and the second test case is benzene/toluene/cumene. Thermodynamic data on these systems were compared with results from three process simulation packages. This paper will examine the results from the three simulation packages by comparing the similarities and differences with respect to the design of distillation towers for these two cases. The first system studied was the methanol/water system. The feed was a bubble point liquid of a mixture of methanol and water at atmospheric pressure. Since there was literature equilibrium data presented at constant pressure, the simulations were run at constant pressure for a more accurate comparison of the equilibrium data. The products desired contained 99 percent methanol in the distillate and 99 percent water in the bottoms. This allowed the development of a good equilibrium curve. Several thermodynamic methods were chosen for use in the simulation packages. These methods included ideal, Soave-Redlich Kwong (SRK), Non-Random Two-Liquid (NTRL), Van Laar, and others. The results from these methods were compared to values presented in the literature. One set of literature data was obtained from Chu (3) and the other set was from Perry s Chemical Engineering Handbook (4). Figures 1A, 1B, 1C and 2 show the comparison of the results from the process 7
8 simulators with the data obtained from the literature. The comparison shows that the NRTL predicts the best results. The curves in Figure 1A and 1B have very similar trends with respect to the simulator results and are very close to the literature curve. However, simulator C (Figure 1C) provides an opposite trend; i.e., it is above the literature curve at low methanol concentrations and below the literature curve at high methanol concentrations. In addition, the results from simulator C do not match the literature data as well as simulators A and B. The SRK prediction (Figure 2) is close but not as accurate as the NRTL method. Figure 2 also shows the deviation among the different simulation packages. As one can see from the diagram, the different simulation packages predict the actual values fairly well, but deviate from each other considerably. One simulation package predicts an equilibrium curve consistently above the real equilibrium curve and the other two predict curves above at low concentrations of methanol and below at higher concentrations. The Van Laar and ideal methods gave similar results (not shown) but deviate from the literature results. These curves were well below the literature curve from 0 to.45-mole fraction of methanol and then high from 0.45 to 1. One would expect the NRTL method to be appropriate since both compounds are polar. Since the results from the NRTL method matched the real data reasonably well, this method was used for the future studies of the methanol and water system. Test case two is benzene/toluene/cumene. The feed for this system was a bubble point liquid of 25 mole percent benzene, 35-mole percent toluene, and 40-mole percent cumene at atmospheric pressure. For the study of this ternary system, toluene was chosen as the light key and cumene as the heavy key. The desired specifications for this system were 95 percent recovery of toluene in the distillate and 96 percent recovery of cumene in the bottoms. Since the system should be reasonably ideal, ideal and SRK were selected for the thermodynamic methods in the simulation packages. The results from these methods were compared to the values given for this system in Wankat (5) using relative volatilities, which are 2.25 for benzene/toluene and 0.21 for cumene/toluene. It is unknown whether the values given in Wankat were based on real data or calculated; however, no other data was found in the literature. Table 1 provides the comparison of relative volatilities. Table 1. Relative Volatility Comparison for Benzene/Toluene/Cumene Simulator A Simulator B Simulator C Ideal α benz/tol N/A α cum/tol N/A SRK α benz/tol α cum/tol
9 Both the ideal and SRK methods gave similar results; however, the ideal method gave better slightly results compared to literature. For the relative volatility for benzene/toluene the ideal method agreed very well with the value in Wankat; however, the relative volatility for cumene/toluene deviated significantly (0.31 vs 0.21). The SRK values for the relativity volatilities deviated slightly more than ideal from the values in Wankat. Further research of the literature is needed to determine if the equilibrium data are accurate; however, for the purpose of illustrating the steps in the design the ideal method was chosen. Since this is a ternary system, a pseudo light key was used to develop a graphical representation of the system. Benzene and toluene represented the pseudo-light key. Figure 3 provides the equilibrium comparison for ideal and SRK with the different simulation packages. The ideal results for the different packages matched very well and the SRK results deviated a little but were similar. Overall, the results from ideal and SRK are similar. The ideal method was chosen for use in the further studies because it was slightly closer to the data provided in Wankat, as discussed above. Once the thermodynamic method was selected, simulation runs were performed to determine the optimum feed stage, minimum reflux ratio, and minimum number of stages. These can be obtained by following Kister s (1) procedure, which will be given below. A McCabe-Thiele diagram can verify the optimum feed stage obtained from following Kister s graphical technique. In addition, the McCabe-Thiele diagram can be used for the methanol water system, a binary system, to determine the minimum reflux ratio and minimum number of stages. For the minimum reflux ratio and minimum number of stages using the McCabe-Thiele Method, the actual equilibrium data along with basic graphical techniques for binary distillation were used rather than the simulation data to create the operating lines and stage results. Optimization of Feed Stage To determine the optimum feed stage, simulation runs were performed at several different feed positions. In the simulation runs, the material balance, reflux ratio, and total number of stages were kept constant. Then two main plots were created. One plot was the McCabe-Thiele diagram and the other was a concentration versus feed stage diagram. The McCabe-Thiele diagram was plotted using the mole fraction data calculated for each stage by the simulation. The equilibrium data and the operating lines were determined from these data. The McCabe-Thiele diagram shows how an optimum feed stage versus a non-optimum feed stage looks when using the simulation data. For the methanol-water system, Figures 4 and 5 show McCabe-Thiele diagrams with a mislocated feed at stage 5 and 9 from the top, respectively. Figure 6 provides the diagram showing an optimum feed at stage 7 from the top. One can see how on the optimum stage diagram produces reasonably straight operating lines without any strange 9
10 curve when the top and bottom operating lines meet; yet the non-optimum stage has more curvature where the operating lines meet. This is also observed in the benzene/toluene/cumene system as shown in Figures 7, 8, and 9. Figures 7 and 8 show non-optimum feed stages (3 and 7 from the top) and Figure 9 shows the optimum feed stage (5 from the top) for this system. These diagrams show similar results as the binary system diagrams with one more distinction. In ternary and higher component systems, the curvature in the operating lines will also sometimes cause curvature in the equilibrium curve. This results from the discontinuity at the feed stage and the development of the equilibrium curves and operating lines from the same data. In the second type plot, the key component concentration in the product streams are plotted against the feed stage numbers. The minimum in the curve will represent the optimum feed stage. One can generally assume the ratio of optimum feed stage to total number of stages is independent of the number of stages. (1) In both case systems, the total number of stages is kept constant at 10. Also, if the distillate rate is increased, it is expected to move the feed stage up the column. Figure 10 shows the methanol-water system and Figure 11 shows the benzene/toluene/cumene system for determination of the optimum feed stage. Figure 10 shows the optimum feed stage to be around the 7 th or 8 th stage from the top of the column for the given methanol/water system. This result agrees with the McCabe-Thiele diagram result showing an optimum feed stage at 7 from the top. It also agrees with the binary graphical solution of the McCabe-Thiele diagram using real data, which is shown in Figure 12. If the distillate rate increases the feed stage number will move up in the column. If the distillate rate is increased by two percent the feed stage moves up to the 5 th stage form the top. If the distillate rate is increased by five percent, then the feed stage moves up to around the 3 rd or 4 th stage from the top. Figure 11 shows the optimum feed stage to be around stage 5 from the top for the benzene/toluene/cumene system. This result agrees with the pseudo-mccabe-thiele diagram result for the benzene/toluene/cumene system. These results show how graphical techniques with specific simulations can predict the optimum feed stage. Minimum Reflux Ratio and Minimum Number of Stages by use of Simulation To determine the minimum reflux ratio and the minimum number of stages, one develops a reflux-stage plot and extrapolates from it. To develop this plot, simulation runs are performed at different number of stages while keeping the material balance, product compositions, and the ratio of the feed stage to the number of stages constant. The reflux ratio is allowed to vary. Then a plot of the number of stages versus reflux or reflux ratio is plotted. The curve is extrapolated asymptotically to an infinite number of stages to obtain the minimum reflux ratio and asymptotically to an infinite reflux ratio to obtain the minimum number of stages. (1) Figure 13 is a demonstration of this graph for the methanol-water system and Figure 14 provides this diagram for the benzene/toluene/cumene system. Figure 13 shows that for a ratio of feed stage to total number of stages equal to 0.7 while maintaining the distillate rate and product compositions the minimum reflux ratio is approaching and the minimum number of stages is 7 or 8. The simulation would not run with 7 stages. These results for methanol and water are confirmed by Figure 12 in which a minimum reflux ratio was determined 10
11 to be and the minimum number of stages was determined to be 8. In Figure 14 with the feed stage to total number of stages equal to 0.5, it is shown that the minimum reflux ratio is and the minimum number of stages is 6 or 7. The simulation would not run with 6 stages. This graphical technique is a very easy one to do and ensures that the design is not approaching the minimum limits. Column Sizing Once the internal liquid and vapor traffic is obtained from the simulation model. The diameter of the column must be obtained. Most simulation packages have tower-sizing routine. These routines are fairly easy to use and yield quick results. However, these results should be verified by calculation. Column sizing is done on a trial and error basis. The first step is to set your design limits. The design limits are as follows: 1. Maximum Design rates Vapor/Liquid Traffic is needed at Maximum Operating rates. 2. Design rates - Vapor/Liquid Traffic is needed at Design Operating Conditions. 3. Minimum Design rates - Vapor/Liquid Traffic is needed at Minimum Operating rates. Sizing calculations need to be performed in areas of the column where the vapor/liquid traffic is expected to be highest and lowest for each section. For example, 1. The top tray and bottom tray in the column. 2. The feed tray. 3. Any product draw-off tray or heat addition/removal tray. 4. Trays where the vapor liquid loading peaks. For the case studies this publication will be examining the authors will be looking at the top tray in the column, the bottom tray in the column, and the feed tray including the trays above and below the feed when sizing the column. There are also shortcut methods to sizing a column, which involve using a flooding correlation. These methods minimize the amount of trial and error calculations. Using the method as outlined by Kister (1) the first step is to determine the C-Factor at the most heavily loaded point in the column. Using an entrainment flooding correlation like the Kister and Haas correlation the C-Factor at flood can be calculated. 1. C SB = [d 2 H σ/ρ L ] [ρ G /ρ L ] 0.1 [S/ h ct ] 0.5 Kister and Haas (1) 11
12 Next the vapor velocity at flood based on net column area minus the tray downcomer area needs to be calculated. This calculation is done for the top and bottom section of the column (1). 2. u N = C SB [(ρ L - ρ V )/ρ V ] (1/2) Flooding Vapor Velocity, ft/s Next, the bubbling area required for the top and bottom sections of the column need to be calculated using equation 3. In new designs columns should be design for 80% flood (1). 3. A N = CFS/[(SF)(0.8)u N ] Bubbling Area Required (Column Cross Sectional Area less downcomer top area, ft 2 ) Next, the downcomer top area needs to be calculated using equation 4. This calculation is done for the top and bottom section of the column (1). 4. AD = GPM/VD dsg Downcomer Area. Once this has been completed the tower cross sectional area can be calculated using equation 5. The tower diameter can be calculated from the tower area. (1). 5. A T = A N + A D Tower Cross Sectional Area, ft 2 The following are the definitions of the parameters used in the above equations. C SB C-Factor at flood, ft/s d H Hole Diameter, in S Tray Spacing, in h ct - Clear liquid height at the transition from the froth to spray regime, in of Liq. ρ G, ρ L Vapor and Liquid Density, lb/ft 3 σ - Surface Tension, Dyne/cm SF Derating Factor or Foaming Factor GPM Tray Liquid Loading, GPM VD dsg Downcomer, GPM/ft 2 A N Tray Bubbling Area, ft 2 A D Downcomer Top Area, ft 2 A T Total Tower Cross Sectional Area, ft 2 Column Internals Design Once the preliminary tower diameter has been set the internals can be chosen. The task of choosing the type of tower internal to use is very important. The type of column internals used dictates a column s efficiency and capacity. All of the modeling and careful design work will mean nothing if the wrong type of column internals are chosen. There are basically two different kinds of internals that can be used packing or trays. 12
13 Packed Towers In recent years tower packings have become very popular especially in vacuum distillation applications. Structure packing has become the packing of choice these days. Structure packing is competitively priced these days and has proven to be very successful in many applications. However, there are a few things to remember when trying to decide if structured packing is correct for your application. The vapor and liquid loadings of the tower are important when considering structured packing. Generally structure packing performs well at low liquid and vapor loadings. At high flow parameters the capacity and efficiency of structured packings can be significantly reduced. Structured packing is generally most efficient in low-pressure distillation applications. Some other items to consider when trying to decide to use packing in a tower. 1. Is your application a fouling service? Usually structured packing does not perform well in heavy fouling applications. 2. Is your service highly corrosive? Structure packing has a low resistance to corrosion. 3. Is pressure drop a major consideration? Structured packing is a lowpressure drop device that provides high efficiency. This is why structured packing is extremely successful in low-pressure distillation applications. 4. Does the system your modeling have foaming tendencies? Structured packing performs extremely well in foaming applications (6). The most important part of a packed tower design is the distributors. Packed towers are more sensitive to liquid and vapor maldistribution than trayed towers. Therefore, it is critical that vapor and liquid enter packing evenly distributed. The performance of the packing depends heavily on the initial vapor and liquid distribution entering the packing. Poor vapor and liquid distribution to a packed bed can result in a loss of efficiency (7). Tray Towers Trays are the most commonly selected type of tower internal. Just like packed towers, tower vapor and liquid loadings are an important consideration for trayed towers. Generally trays perform well at high liquid and vapor loadings. At low flow parameters the capacity and efficiency of trays can be reduced. Some other items to consider when trying to decide to use trays in a tower. 1. Is your application a fouling service? Usually trays have downcomer capacity problems in heavy foaming services. 13
14 2. Is your service highly corrosive? Trays have a high resistance to corrosion. 3. Trays have higher pressure drop than structured packing or random packing. 4. Entrainment is an issue with trays. Trays usually have more entrianment than packings. Excessive entrainment can lead to efficiency loss. 5. Excessive vapor and liquid maldistribution can lead to a loss of efficiency in a tray tower. When comparing trays to packing it is always a good idea to get as much information as possible about the internals being considered. The tray vendors are a good source of information. There are many publications on the subject of distillation for example Distillation Design by Henry Kister (1). Talk with others in the industry to see what has been done before. Do as much research as possible before any decisions are made. Test Cases Once the simulation runs for the test cases were completed and the accuracy of the models were confirmed, each process simulation package was used to size the diameter of the column and design valve trays for the column. The default design factors were used as the basis of the tray design. The only design parameter specified was the flood factor. A flood factor of 0.8 was used in each simulation design case. The results from the process simulators for the methanol/water case are given in Table 2. Examining the results from the process simulation packages there is a large amount of variation in the results. Each package predicted about the same diameter column. The column diameter calculated by process simulator A was a ½ of a foot smaller that what process simulator B and C calculated. This may indicate a different sizing criteria from the other two simulation packages. The percent flood numbers for simulation packages A and B were very close. However, simulation package C reported a much lower percent flood number. The pressure drop per tray calculated by process simulator A is almost double of that calculated by process simulators B and C. 14
15 Table 2 Methanol-Water Test Case Column Internals Sizing Comparison Sizing Parameters Simulator A Simulator B Simulator C Internals Valve Trays Valve Trays Valve Trays Tower Diameter 6 ft 6.5 ft 6.5 ft Tray Spacing 24 inches 24 inches 24 inches % Flood % DC Backup Pressure Drop/Tray(in H 2 O) Weir Loading(gpm/in) Flow Paths The results from the process simulator runs for the benzene/toluene/cumene case are given in Table 3. Examining the results from the process simulation packages there is a large amount of variation in the results. Each package predicted the same column diameter. However, the percent flood number for simulation packages A, B, and C showed extensive variation. These results are suspect considering that each simulation package calculated the same column diameter. Diameter and tray spacing are the two key elements in determining the capacity of a column. Since the column diameter and tray spacing are the same for all three cases there must a differences in the calculation method or the geometric layout of the trays. With each simulator producing widely different results it is hard to be sure which is correct without performing external calculations to verify the results. There was also a wide variation in the pressure drop calculated by each process simulation package. The wide variation in calculated weir loadings may indicate the method used to perform the tray calculations varies from simulation package to simulation package. This is consistent with the wide variation seen in the percent flood numbers. The results also show a big difference in the % downcomer backup between simulators A and B and simulator C. Again, this may indicate drastically different calculation methods from one simulator to another. 15
16 Table 3 Benzene-Toluene-Cumene Test Case Column Internals Sizing Comparison Sizing Parameters Simulator A Simulator B Simulator C Internals Valve Trays Valve Trays Valve Trays Tower Diameter 5.5 ft 5.5 ft 5.5 ft Tray Spacing 24 inches 24 inches 24 inches % Flood % DC Backup Pressure Drop/Tray(in H 2 O) Weir Loading(gpm/in) Flow Paths When using a process simulator to size a new column and design internals for that column all designs should be verified by external calculations. Most process simulators only do hydraulic calculations for internals There can be big differences in tray and packing hydraulic calculations from simulation package to simulation package. This point was evident in the results for the three test cases presented. Many times different sizing calculation methods are used. This may even include the use of different hydraulic correlations. These differences could result in improperly sized columns and poor column internal designs. Estimating the efficiency of packing and trays is extremely difficult. Packing and tray efficiency varies from system to system. Without the proper information regarding efficiency could result in a tower that is either oversized or undersized for the application. Failure to properly size the column or the internals that go in the column could result in a tower that does not perform as expected. The best way to verify the design is to perform hand calculations based on recognized methods for column sizing. The tray vendors are a good resource to verify that the tray design is a good design. Most tray vendors have efficiency information on trays and packing in a wide variety of services. The tray vendors may even be able to recommend ways to optimize the design or suggest a different way to design the internals for the column. 16
17 Conclusions 1. Thermodynamic packages can vary from simulation package to simulation package. Whenever possible verify the accuracy of the thermodynamic data being used in your model. 2. Always verify any simulation design by using graphical analysis techniques. 3. There can be big differences in tray and packing hydraulic calculations from simulation package to simulation package. Verify your design by using hand calculations based on recognized methods for column and tray sizing. 17
18 REFERENCES 1 Kister, H. Z. Distillation Design, McGraw-Hill Book Company Inc., New York, Schad, R. C., Make The Most of Process Simulation, Chemical Engineering Progress, 21-27, Jan Chu, Ju Chin; Wang, Shu Lang: Levy, Sherman L.; Paul, Rajendra, Vapor-Liquid Equilibrium Data, J.W. Edwards, Publisher, Inc. Ann Arbor, Michigan, Perry, R. H., Green D. W., Perry s Chemical Engineering Handbook 7 th Edition, McGraw-Hill Book Company, New York, Wankat, Phillip C., Separations in Chemical Engineering-Equilibrium Staged Separations, Prentice Hall PTR, Englewood Cliffs, NJ, Bravo, J. L. Select Structured Packings or Trays?, Chemical Engineering Progress, 36-41, July Bonilla, J. A., Don t Neglect Liquid Distributors, Chemical Engineering Progress, 47-61, Mar
19 19
20 20
21 21
22 22
23 23
24 24
25 25
26 26
27 27
28 28
29 29
30 30
31 31
32 32
33 33
34 34