Process Strategy and Sustainability
|
|
|
- Hilda Glenn
- 5 years ago
- Views:
Transcription


1 7 Process Strategy and Sustainability PowerPoint presentation to accompany Heizer and Render Operations Management, 10e Principles of Operations Management, 8e PowerPoint slides by Jeff Heyl 7-1
2 Process Strategies The objective of a process strategy is to build a production process that meets customer requirements and product specifications within cost and other managerial constraints 7-2
3 Process Strategies How to produce a product or provide a service that Meets or exceeds customer requirements Meets cost and managerial goals Has long term effects on Efficiency and production flexibility Costs and quality 7-3
4 Process Strategies Four basic strategies 1. Process focus 2. Repetitive focus 3. Product focus 4. Mass customization Within these basic strategies there are many ways they may be implemented 7-4
5 Process Focus Facilities are organized around specific activities or processes to facilitate lowvolume, high-variety production General purpose equipment and skilled personnel High degree of product flexibility Typically high costs and low equipment utilization Product flows may vary considerably making planning and scheduling a challenge 7-5
 Arnold Palmer Hospital Many departments and many routings Figure 7.")
6 Process Focus Many inputs (surgeries, sick patients, baby deliveries, emergencies) (low volume, high variety, intermittent processes) Arnold Palmer Hospital Many departments and many routings Figure 7.2(a) Many different outputs (uniquely treated patients) 7-6
7 Repetitive Focus Definition: a production-oriented production process that uses modules Facilities often organized as assembly lines Characterized by modules with parts and assemblies made previously Modules may be combined for many output options Less flexibility than process-focused facilities but more efficient 7-7
 Few modules")
 Modules combined for many Output options (many")
8 Repetitive Focus Raw materials and module inputs (multiple engine models, wheel modules) Few modules (modular) Harley Davidson Figure 7.2(b) Modules combined for many Output options (many combinations of motorcycles) 7-8
9 Product Focus Facilities are organized by product High volume but low variety of products Long, continuous production runs enable efficient processes Typically high fixed cost but low variable cost Generally less skilled labor 7-9
 Frito-Lay")
 Output variations in size, shape, and packaging (3-oz,")
10 Product Focus Few Inputs (corn, potatoes, water, seasoning) (low-volume, high variety, continuous process) Frito-Lay Figure 7.2(c) Output variations in size, shape, and packaging (3-oz, 5-oz, 24-oz package labeled for each material) 7-10


11 Product Focus D Nucor Steel Plant A Scrap steel Continuous caster E C Continuous cast steel sheared into 24-ton slabs Hot tunnel furnace ft B Ladle of molten steel F Electric furnace Hot mill for finishing, cooling, and coiling I H G 7-11

12 Mass Customization The rapid, low-cost production of goods and service to satisfy increasingly unique customer desires Combines the flexibility of a process focus with the efficiency of a product focus 7-12
 Many modules")
 Many output versions (custom PCs and notebooks)")
13 Mass Customization Many parts and component inputs (chips, hard drives, software, cases) Many modules (high-volume, high-variety) Dell Computer Figure 7.2(d) Many output versions (custom PCs and notebooks) 7-13
14 Mass Customization Imaginative and fast product design Rapid process design Tightly controlled inventory management Tight schedules Responsive supply chain partners 7-14
15 Changing Processes Difficult and expensive May mean starting over Process strategy determines transformation strategy for an extended period Important to get it right 7-15
16 Process Analysis and Design Is the process designed to achieve a competitive advantage? Does the process eliminate steps that do not add value? Does the process maximize customer value? Will the process win orders? 7-16
17 Process Analysis and Design Flow Charts - Shows the movement of materials Time-Function Mapping - Shows flows and time frame Value-Stream Mapping - Shows flows and time and value added beyond the immediate organization Process Charts - Uses symbols to show key activities Service Blueprinting - focuses on customer/provider interaction 7-17
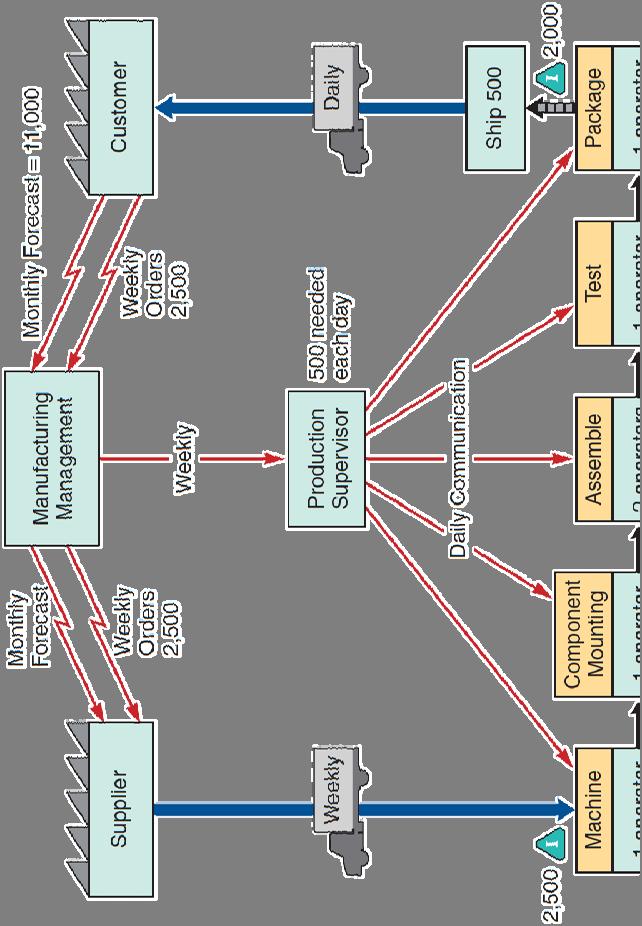
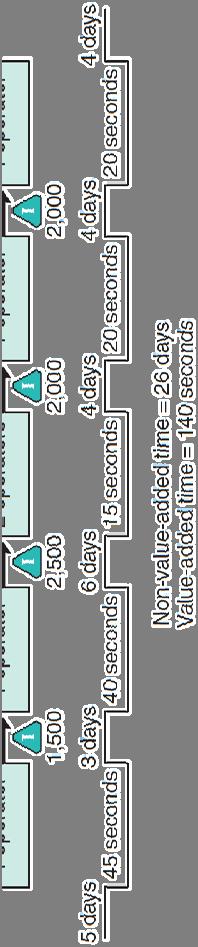
18 Value-Stream Mapping Figure


19 Process Chart Figure
20 Service Blueprinting Focuses on the customer and provider interaction Defines three levels of interaction Each level has different management issues Identifies potential failure points 7-20
21 Service Blueprint Personal Greeting Service Diagnosis Perform Service Friendly Close Level #1 Customer arrives for service. (3 min) Customer departs Level #2 F Warm greeting and obtain service request. (10 sec) Direct customer to waiting room. No Standard request. (3 min) Determine specifics. (5 min) Can service be done and does customer approve? (5 min) Notify customer and recommend an alternative provider. (7min) No Customer pays bill. (4 min) F F Notify customer the car is ready. (3 min) F F Yes F Yes F Level #3 Perform required work. (varies) F Prepare invoice. (3 min) Figure

22 Time-Function Mapping - Shows flows and time frame 7-22
23 Process Analysis Tools Flowcharts provide a view of the big picture Time-function mapping adds rigor and a time element Value-stream analysis extends to customers and suppliers Process charts show detail Service blueprint focuses on customer interaction 7-23
24 Special Considerations for Service Process Design Some interaction with customer is necessary, but this often affects performance adversely The better these interactions are accommodated in the process design, the more efficient and effective the process Find the right combination of cost and customer interaction 7-24
 Automated guided vehicles (AGVs) Flexible manufacturing systems (FMSs) Computer-integrated manufacturing (CIM)")
25 Production Technology Machine technology Automatic identification systems (AISs) Process control Vision system Robot Automated storage and retrieval systems (ASRSs) Automated guided vehicles (AGVs) Flexible manufacturing systems (FMSs) Computer-integrated manufacturing (CIM) 7-25
26 Machine Technology Increased precision Increased productivity Increased flexibility Reduced power requirements 7-26


27 Automatic Identification Systems (AISs) A system for transforming data into electronic form Improved data acquisition Reduced data entry errors Increased speed Increased scope of process automation Example Bar codes and RFID 7-27


28 Process Control Real-time monitoring and control of processes The use of IT to control a physical process Sensors collect data Devices read data on periodic basis Measurements translated into digital signals then sent to a computer Computer programs analyze the data Resulting output may take numerous forms 7-28

29 Vision Systems A system that use video cameras and computer technology in inspection roles Particular aid to inspection Consistently accurate Never bored Modest cost Superior to individuals performing the same tasks 7-29

30 Robots A flexible machine with the ability to hold move or grab items Perform monotonous or dangerous tasks Perform tasks requiring significant strength or endurance Generally enhanced consistency and accuracy 7-30
31 Automated Storage and Retrieval Systems (ASRSs) Computer-controlled warehouses that provide for the automatic placement of parts into and from designated places within a warehouse Automated placement and withdrawal of parts and products Reduced errors and labor Particularly useful in inventory and test areas of manufacturing firms 7-31
32 Automated Guided Vehicle (AGVs) Electronically guided and controlled carts Used for movement of products and/or individuals 7-32
33 Flexible Manufacturing Systems (FMSs) Computer controls both the workstation and the material handling equipment Enhance flexibility and reduced waste Can economically produce low volume at high quality Reduced changeover time and increased utilization Stringent communication requirement between components 7-33
34 Computer-Integrated Manufacturing (CIM) Extension of flexible manufacturing systems Backwards to engineering and inventory control Forward into warehousing and shipping Can also include financial and customer service areas Reducing the distinction between lowvolume/high-variety, and highvolume/low-variety production 7-34

 Figure 7.")
35 Computer- Integrated Manufacturing (CIM) Figure