California Statewide Interregional Integrated Modeling (SIIM) Framework. California STDM. HBA Specto Incorporated ULTRANS, UC Davis
|
|
|
- Erika Wiggins
- 5 years ago
- Views:
Transcription


")


1 California Statewide Interregional Integrated Modeling (SIIM) Framework California STDM HBA Specto Incorporated ULTRANS, UC Davis SIIM Advisory Group Meeting June 2010
2 model-wide economic / demographic conditions consumer surplus economic changes; migration development activity model-wide economic / demographic conditions activity totals activity allocations space prices space development space quantities activity allocations land use patterns transport generalised costs transport model changes in transport supply transport model year t year t+1 California STDM
3 CSTDM System Inputs Models Outputs
4 CSTDM System Inputs Models Outputs Zone System Road Network Transit Network Population Employment Commodity Production & Consumption Other Zonal Properties Estimated Model Parameters Calibration Factors Short Distance Personal Model (SDPM) Long Distance Personal Model (LDPM) Short Distance Commercial Vehicle Model (SDCVM) Long Dist. Comm. Veh. Model External Travel Model (ETM) Trip Tables Loaded Network Travel Times and Costs Summary Travel Statistics Maps Graphs
5 CSTDM Inputs Inputs Zone System Road Network Transit Network Population Employment Commodity Production & Consumption Other Zonal Properties Estimated Model Parameters Calibration Factors System of zones that divides California into areas; consistent with Census geography and PECAS LUZ Representation of road and highway network including freeways, expressways and most/all arterials, plus other roads needed for connectivity Representation of transit networks, including explicit coding of air and rail (intercity, commuter and urban transit) as well as a synthetic representation of urban bus networks Synthetic population representing every person and housing unit in California; also includes some zonal-level totals from this synthetic population; will accept PECAS outputs as marginals (as an option...)
6 Zone system 5191 internal zones 51 external zones Consistent with 524 PECAS LUZ
7
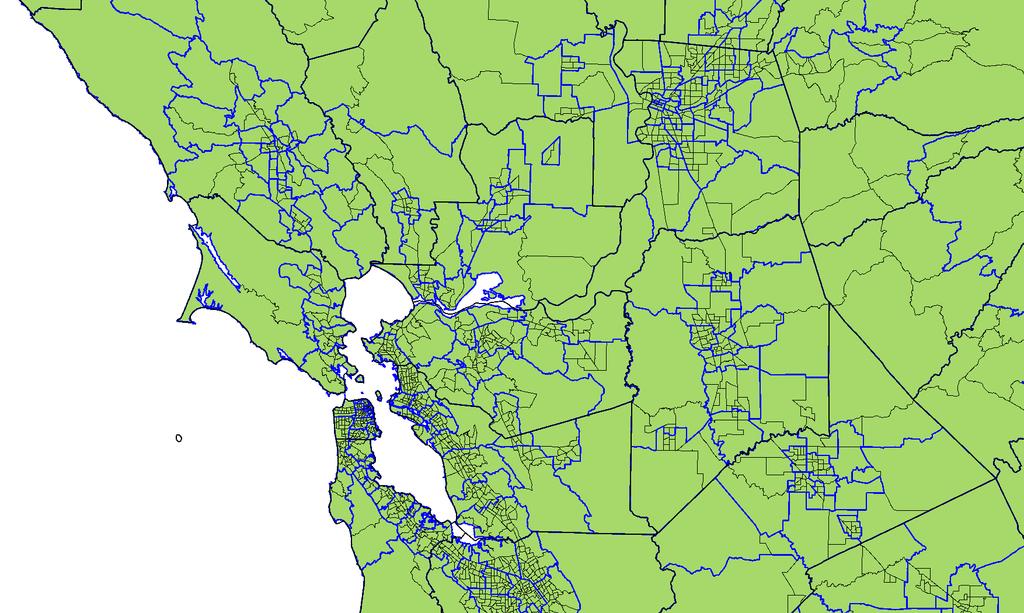
8
9 Synthetic population Based on Census PUMS and SF3 data 44 marginal targets: HH size 7 Housing type 5 HH income 7 Person age 10 Auto ownership 6 Employment by occupation 6 Student by level 3 Each PUMA uses local and nearby PUMAs Sampling and replacing technique Very good fits in short run times: 24 hours for whole state 7.5 hours for 10% sample Can easily be sped up 12,336,488 households
10 Model PUMA 8101; worst fitting PUMA (all attributes, 49 TAZ) Preliminary result Target
11 Network 86,000 nodes 235,000 links Multi-modal
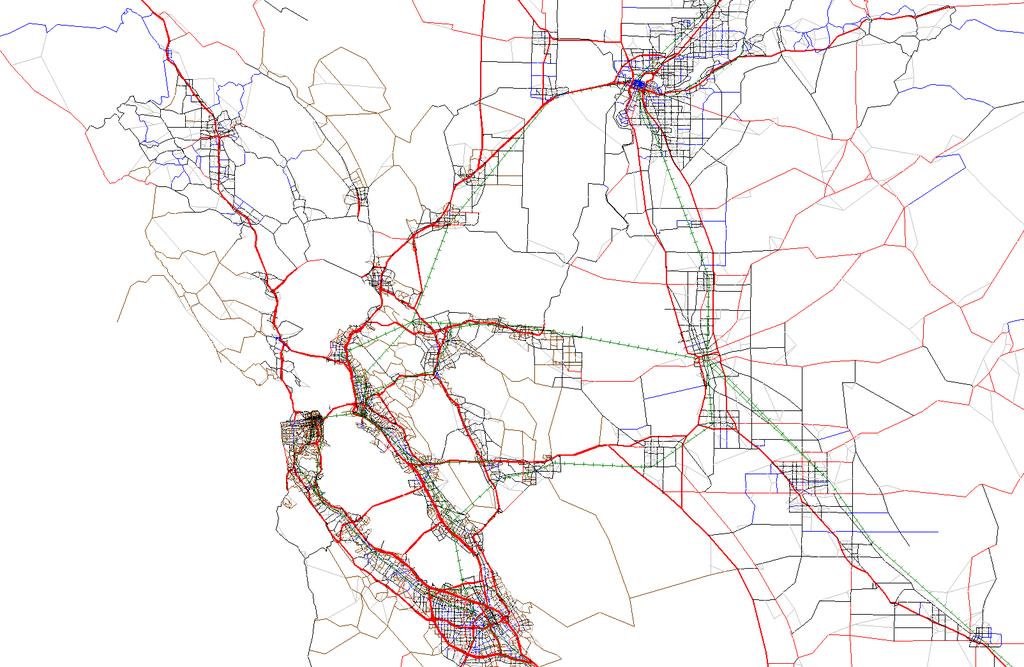
12
13 Modes in Model Mode Short Distance Personal Long Distance Personal Short Distance Commercial Long Distance Commercial External Travel Auto SOV Auto HOV 2 person Auto HOV 3+ person Transit (bus and rail) Bicycle Walk Air Rail Light commercial vehicle Single unit truck Multiple unit truck
14 Local Transit Representation Combine explicitly coded fixed guideway (rail) with algorithmically derived local transit (bus) Based on observed (Google Transit) data Produces in vehicle time (IVT) and out of vehicle time (OVT) Uses level of service variable for bus quality Reasonable transit representation for a statewide model with a fraction of the coding
15 Local transit functions IVT = 2.06 HOV3 time HOV3 time LOS HOV3 time OVT = 2.91 LOS LOS HOV3 distance ( Origin dens + Dest dens) LOS: Level of service (Population served / 1K annual revenue service miles) Transit policy variable; 40 for Muni (SF) to 200 for low quality rural areas
16 Skims needed Auto direct skim Orig. Dest. Walk to rail Auto to rail Auto from rail Walk from rail Rail network skim
17 With local transit function Auto direct skim Bus direct skim (from auto) Orig. Dest. Walk to rail Auto to rail Bus to rail (from auto) Bus from rail (from auto) Auto from rail Walk from rail Rail network skim
18 Walk Access Transit Orig. Dest. Walk to rail Walk from rail Rail network skim
19 Walk Access Transit Orig. Dest. Bus to rail (from auto) Walk from rail Rail network skim
20 Walk Access Transit Orig. Dest. Walk to rail Bus from rail (from auto) Rail network skim
21 Walk Access Transit Orig. Dest. Bus to rail (from auto) Bus from rail (from auto) Rail network skim
22 Walk Access Transit Bus direct (from auto) Orig. Dest.
23 Drive Access Transit Orig. Dest. Auto to rail Walk from rail Rail network skim
24 Drive Access Transit Orig. Dest. Auto to rail Bus from rail (from auto) Rail network skim
25 Drive Egress Transit Orig. Dest. Walk to rail Auto from rail Rail network skim
26 Drive Egress Transit Orig. Dest. Bus to rail (from auto) Auto from rail Rail network skim
27 Preliminary result In vehicle time: LA CBD

28 Preliminary result Out of vehicle time: LA CBD

29 In vehicle time: San Bernadino Preliminary result

30 Composite travel cost: LA CBD Preliminary result

31 Comp. travel cost: San Bernadino Preliminary result

32 San Diego CBD San Diego CBD Preliminary result Oakland CBD
33 CSTDM Inputs Inputs Zone System Road Network Transit Network Population Employment Commodity Production & Consumption Other Zonal Properties Estimated Model Parameters Calibration Factors Totals of employees in zones by industry and occupation Production and consumption of commodities (goods, services and labour); including both zonal level totals and economic flows PECAS output Other properties, like area, parking costs, area types, districts and counties, etc. Parameters and model forms reflecting behaviour as estimated in the production of the models; from observed behaviour (travel surveys) Adjustments to these parameters to better reflect the observed behaviour in the operating model system (travel surveys and count data)
34 CSTDM Models Models External Travel Model (ETM) Long Dist. Com. Veh. Model (LDCVM) Short Distance Commercial Vehicle Model (SDCVM) Long Distance Personal Model (LDPM) Common features: Disaggregate simulation aspect Produces a consistent trip list output Uses the same set of inputs where common data is needed (e.g. # of retail employees; travel skims) Short Distance Personal Model (SDPM)
35 External Travel Model Models External Travel Model (ETM) Long Dist. Com. Veh. Model (LDCVM) Short Distance Commercial Vehicle Model (SDCVM) Long Distance Personal Model (LDPM) Travel entering, exiting or through California Includes port traffic Cars, medium & heavy trucks Disaggregate simulation of exogenous crossing counts Based on models estimated elsewhere; calibrated using FAF / NHTS data Short Distance Personal Model (SDPM)
36 External Travel Model Estimated: Yes Implemented: Yes Calibrated: Yes, Initially

37 Border crossed: Oregon Nevada: North South Arizona Mexico 1 dot = 5 trips Preliminary result
38 Port: Oakland LA / Long Beach 1 dot = 5 trips Preliminary result
39 Models External Travel Model (ETM) Long Dist. Com. Veh. Model (LDCVM) Short Distance Commercial Vehicle Model (SDCVM) Long Distance Personal Model (LDPM) Short Distance Personal Model (SDPM) Long Distance Commercial Vehicle Model Travel by commercial vehicles > 50 mi Mostly goods, mostly heavy Uses PECAS AA flows, factored to represent vehicle trips Poisson sampling to establish individual vehicle movements
40 Long Distance Commercial Vehicle Model Estimated: Yes Implemented: Yes Calibrated: No
41 Long Distance Commercial Vehicle Model >23-Jun :56:00:272, INFO, Writing TripMatrices >23-Jun :56:00:272, WARN, Using default value of Infinity for property aa.roundexpectedvaluefortripsifhigherthan >23-Jun :56:00:272, WARN, Using default value of 10.0 for property aa.usenormalpoissonapproximationifhigherthan >23-Jun :56:03:818, INFO, Table TripCalculationsI exists in aa.base.data, read text file instead of JDBC input >23-Jun :56:03:818, WARN, Using default value of true for property aa.poissontrips >23-Jun :56:03:910, ERROR, Can't build TAZTripList without splitting quantities to TAZ; set aa.splitoutputtofloorspacezones to >true if aa.taztriplist is true >23-Jun :56:03:962, INFO, Poisson sampling of trip matrix animal_ldcv, origtrips: , newtrips: >23-Jun :56:04:007, INFO, Poisson sampling of trip matrix forest_ldcv, origtrips: , newtrips:965.0 >23-Jun :56:04:032, INFO, Poisson sampling of trip matrix fuel_ldcv, origtrips: , newtrips: >23-Jun :56:04:058, INFO, Poisson sampling of trip matrix machine_ldcv, origtrips: , newtrips: >23-Jun :56:04:084, INFO, Poisson sampling of trip matrix manuf_ldcv, origtrips: , newtrips: >23-Jun :56:04:109, INFO, Poisson sampling of trip matrix mining_ldcv, origtrips: , newtrips: >23-Jun :56:04:134, INFO, Poisson sampling of trip matrix misc_ldcv, origtrips: , newtrips:755.0 >23-Jun :56:04:160, INFO, Poisson sampling of trip matrix plant_ldcv, origtrips: , newtrips: >23-Jun :56:04:185, INFO, Poisson sampling of trip matrix ppcprgc_ldcv, origtrips: , newtrips: >23-Jun :56:04:211, INFO, Poisson sampling of trip matrix scrap_ldcv, origtrips: , newtrips: >23-Jun :56:04:236, INFO, Poisson sampling of trip matrix textile_ldcv, origtrips: , newtrips:734.0
42 Models External Travel Model (ETM) Long Dist. Com. Veh. Model (LDCVM) Short Distance Commercial Vehicle Model (SDCVM) Long Distance Personal Model (LDPM) Short Distance Personal Model (SDPM) Short Distance Commercial Vehicle Model Commercial vehicles <50 mi Includes goods and service Light, medium and heavy CV Tour-based disaggregate simulation Based on tour-based CVMs; to be calibrated to available data ~ 1 million tours ~ 4.5 million trips
43 Short Distance Commerical Vehicle Model Estimated: Yes Implemented: Yes Calibrated: Underway

44 Service Retail Fleet Allocator 1 dot = 1 tour start Preliminary result
45 1 dot = 1 tour start Preliminary result Transportation Wholesale Industrial (incl. primary)

46 Service Retail Fleet Allocator 1 dot = 1 tour start Preliminary result
 1 dot = 1 tour start Preliminary")
47 Transportation Wholesale Industrial (incl. primary) 1 dot = 1 tour start Preliminary result
48 Long Distance Personal Model Models External Travel Model (ETM) Long Dist. Com. Veh. Model (LDCVM) Short Distance Commercial Vehicle Model (SDCVM) Long Distance Personal Model (LDPM) Travel by individuals > 100 mi Auto, rail and air Initially: Cambridge Systematics (CSI) model for CHSRA work importance of new data Modify to work off common inputs (e.g. transit skims) and synthetic population Typical Fall Weekday Short Distance Personal Model (SDPM)
49 Long distance travel rates Purpose 0 Trips / Day 1 Trip / Day 2+ Trips / Day Business Commute Recreation Other Source: Table 3.1 Frequency of Trip Frequency in the Combined Surveys, HSR Model Development Report
50 Long Distance Personal Model Estimated: Yes Implemented: By 30 June Calibrated: No
51 Short Distance Personal Model Models External Travel Model (ETM) Long Dist. Com. Veh. Model (LDCVM) Short Distance Commercial Vehicle Model (SDCVM) Long Distance Personal Model (LDPM) Travel by individuals < 100 mi Includes commutes Considers walk, bike, transit Most detailed behavioral response Works off synthetic population Building from scratch Short Distance Personal Model (SDPM)
52 Short Distance Personal Model Estimated: Implemented: Yes in part. All by 30 June Yes in part. All by 30 June Calibrated: No
53 Major SDPM model dimensions 8 modes SOV HOV 2 person HOV 3+ person Walk access transit Auto access transit School bus Walk Bike 8 tour and destination purposes Work School Shop Personal Business Escort Eat Social Recreation
54 Time Periods in Model Start period Offpeak Early AM Peak Midday PM Peak Offpeak Late Definition 3 AM to 6 AM 6 AM to 10AM 10 AM to 3 PM 3 PM to 7 PM 7 PM to 3 AM
55 Day Pattern Pattern of activities, and the tours of trips connecting them Example (second most common pattern): O2W4O Day starts at home (O) AM peak trip (2) to work (W) PM return trip (4) to home (O)
56 Common day patterns Pattern Rank Prop. Description O % Stay at home all day O2W4O % Standard peak hour work commute O2S4O % Standard school with peak hour travel O2S3O % School, leaving before PM peak O2W5O % Work, leaving after PM peak O1W4O % Work, arriving before AM peak O2W4H4O % Work, with shop on way home O3H3O % Shop during midday O2W3T3W4O % Work, with subtour for lunch O2W3OO3W4O % Work, with travel home during midday and return O2W4OO5H5O % Work, with evening tour for shopping O Home W Work S School H Shop T Eat P Pers. Business C Escort L Social R Recreation 1 Offpeak Early 2 AM Peak 3 Midday 4 PM Peak 5 Offpeak Late
57 Home Work Primary Destination Shop Secondary Destination School
58 Home Work Primary Destination Subtour Shop Secondary Destination School
59 Home Work Primary Destination Subtour Shop Secondary Destination School
60 LT Decision Day patterns work, school Work and school long term locations using attractors by work and school type with simplified tour mode logsum; number of autos taken from synthetic hh; PECAS condition Whole day pattern (number, purpose, time of tours and stops on tours) taken from observed data conditioned by household type and... Tour mode Logit models: 8 modes; include HH income and auto ownership Based on work and school long term locations; Primary destination Assumed to be work and school long term locations; Subtour mode (Work and school tours with subtour only) Binary Logit model: tour mode vs. walk mode Secondary destination Secondary stops based on available attractors, added travel generalised cost Trip mode Based on tour mode adjusted with rules, logit models as appropriate
61 shop, personal business, eat, recreational, social, escort Day patterns Whole day pattern (number, purpose, time of tours and stops on tours) taken from observed data conditioned by household Tour Mode Logit models for 6 Other purposes; 8 modes; include HH income and auto ownership; Based on destination choice logsums by mode for each purpose; Primary Destination Logit models for 6 Other purposes, based on travel components for Tour Mode and size terms; some by income category Secondary destination Secondary stops based on available attractor size terms from Primary Destination, added travel generalised cost for Tour Mode Trip mode Based on tour mode adjusted with rules, logit models as appropriate
62 Simplified Work Tour Mode All tours Nonmotorized HOV Transit Walk Bike SOV HOV 2 person HOV 3+ person Walk access transit Auto access transit 28,912 observations ρ 2 w.r.t. 0: ρ 2 w.r.t. constants: Preliminary result to get logsums for long term location choices
63 Simplified Work Tour Mode Level of service parameters: Variables Coefficient T-statistic Value of Level of Service Money cost - Operation fee, parking, toll, fare ($) time Auto travel time (min): Low income (<$25K) $ Med. income ($25-100K) $ High income ($100K+) $ Transit in-vehicle time (min): Low income (<$100K) $ High income ($100K+) $ Transit out of vehicle time (min): Low income (<$100K) $ High income ($100K+) $ Walk / bike time (min): First 20 min Next 50 min Over 70 min Transit modes: destination density Nesting Parameter Sufficient Auto ownership Insufficient (cars < drivers) None SOV n/a HOV 2 person HOV 3+ person Walk access transit Drive access transit Alternative specific constants (by auto ownership level) Walk Bike All ASC t-statistics > 4.0 except walk (0.59) Note times and costs are round trip Preliminary result
64 Full Work Tour Mode All tours Nonmotorized Auto Transit Walk Bike SOV HOV Walk access transit Drive access transit HOV 2 person 28,849 observations ρ 2 w.r.t. 0: ρ 2 w.r.t. constants: HOV 3+ person Preliminary result uses destination choice logsums for modes and many personal characteristics as below
65 Full Work Tour Mode Incorporates many additional person, household and tour influences: Household size and composition Age and gender Worker occupation More density measures for transit, walk and bike Presence of secondary stops, esp. escort stops Departure time from home
 Fresno")
66 Preliminary result SOV destination choice logsum For Shop Purpose (midday outbound midday return) Fresno Area
 Fresno")
67 Preliminary result Walk destination choice logsum For Shop Purpose (midday outbound midday return) Fresno Area
 Central Bay")
68 Preliminary result SOV destination choice logsum For Shop Purpose (midday outbound midday return) Central Bay Area
 Central Bay")
69 Preliminary result Walk destination choice logsum For Shop Purpose (midday outbound midday return) Central Bay Area
70 proportion of trips Target Base run 0.04 Calib run A Home to Work network distance (miles)

71 Trips Typical fall weekday ~0.8 million ~100 million Approximate values


72 Emissions Approximate shares for illustrative purposes
73 CSTDM Outputs Outputs Trip Tables Loaded Network Travel Times and Costs Summary Travel Statistics Maps Graphs CSTDM will produce consistent travel times and costs for PECAS model Travel benefit measures Network performance measures Split by inter and intra regional geographies
74 Model building process Development Calibration Validation Documentation
75 Developmen t Calibration Validation Documentation Development: Produce base year networks & zones Prepare travel survey Estimate behavioural models Code software to run models Develop system to run whole set of models ( go.bat )
76 Development Calibration Validation Documentation Calibration: Year 2000 Develop standard inputs and output Match inputs for model development: Travel surveys Screenlines and cordons

77 Screenlines State divided into regions Identified 25 preliminary screenlines Flexible system
78 Development Calibration Validation Documentation Validation: Year 2008 Match observed behaviour: Screenlines Cordons Other data sources (e.g. ACS)
79 Development Calibration Validation Documentation Documentation How the model was developed What the model s assumptions are What is needed to run the model How to run the model Model s fit versus observed data
80 model-wide economic / demographic conditions economic policy economic changes; migration model-wide economic / demographic conditions space development land consumption activity allocations land use policy activity allocations activity benefits and production impacts transport model changes in transport supply transport model transport policy year t year t+1 transport impacts
81 Thank You