AGENDA ITEM 3 A Information Item. Brian James, Planning and Marketing Manager
|
|
|
- Leslie Hodges
- 5 years ago
- Views:
Transcription
1 AGENDA ITEM 3 A Information Item MEMORANDUM DATE: May 5, 2016 TO: FROM: SUBJECT: Brian James, Planning and Marketing Manager Draft Triennial Performance Audit for Fiscal Years 2012/13, 2013/14 and 2014/15 REQUESTED ACTION: BY MOTION, None. Item is for information only. BACKGROUND The El Dorado County Transportation Commission (EDCTC) is statutorily required by California Public Utilities Code to designate entities other than itself to conduct a Triennial Performance Audit of the activities of the Regional Transportation Planning Agency (RTPA) and the Transit Operator to whom it allocates Transportation Development Act (TDA) funds. The performance audit generally follows the guidelines established in the Performance Audit Guidebook for Transit Operators and Regional Transportation Planning Entities, published by the California Department of Transportation (Caltrans) Division of Mass Transportation. While meeting the legal requirements for conducting a performance audit is important, a performance audit also provides an opportunity for an independent, objective, and comprehensive review of the economy, efficiency, and effectiveness of the entity being audited. The audit provides additional benefits as well: Provides management with useful information to assess past activities and provides insight for future planning efforts Provides management with a review and evaluation of an agency s organization and operations Presents an opportunity to utilize auditor expertise which can supplement staff work Assures public accountability for the use of public funds DISCUSSION The El Dorado County Transportation Commission (EDCTC) retained LSC Transportation Consultants, Inc. to prepare the Triennial Performance Audits of El Dorado County Transit Authority (El Dorado Transit). The Draft Triennial Performance Audit of EDCTA is provided as Attachment B. May 5, 2016 Agenda
2 Below are findings and recommendations from the draft Triennial Performance Audit for Fiscal Years 2012/13, 2013/14 and 2014/15. Management response is included as Attachment A. FINDINGS With two minor exceptions, EDCTA was found to be in compliance with all performance related sections of the TDA public utilities code, as identified in Table 4. EDCTA submit annual reports to the State Controller less than five days after the deadline for two years of the audit period. Data collection has improved with RouteMatch software and mobile data terminals. With the ability to automatically download data and create reports, the process is less subject to human error. Despite a strong marketing program, ridership on EDCTA services system wide declined during the audit period. Low gas prices decreases the attractiveness of public transit and may have attributed to the decline. In July 2015, EDCTA implemented several service changes such as a revised US 50 Express and Cameron Park route designed to increase frequency and better meet the needs of US 50 corridor residents. Transit Services provided by El Dorado Transit meet all TDA requirements including the farebox ratio requirement. RECOMMENDATIONS EDCTA should work with the Fiscal Auditor to correctly exclude the El Dorado Air Quality Grant revenue when calculating farebox recovery. If management is confident with the financial outlook for EDCTA operating request, EDCTA should strive to narrow the gap between the LTF (Local Transportation Fund) allocation required for operating assistance and the maximum amount of LTF required for operating assistance. Genevieve Evans of will present the audit and receive comments and questions at the El Dorado County Transportation Commission meeting scheduled for 2:00 PM on May 5, Comments regarding the Draft Triennial Performance Audit are welcome and will be considered for incorporation prior to the document being finalized and submitted to Caltrans. The Final Triennial Performance Audit will be presented to El Dorado Transit Board at a subsequent meeting for approval. May 5, 2016 Agenda


3


4


5 Triennial Performance Audit for Fiscal Years 2012/13, 2013/14 and 2014/15 Draft Prepared for the El Dorado County Transportation Commission Prepared by
6
7 TRIENNIAL PERFORMANCE AUDIT of the EL DORADO COUNTY TRANSIT AUTHORITY for Fiscal Years through Draft Prepared for the El Dorado County Transportation Commission 2828 Easy Street Placerville, California Prepared by P.O. Box Lake Forest Road, Suite C Tahoe City, California April 22, 2016 LSC #167010
8
9 TABLE OF CONTENTS SECTION PAGE 1 EXECUTIVE SUMMARY... 1 Performance Audit Report and Organization... 1 Background... 1 EDCTA Operating and Financial Statistics... 1 Review of Compliance Requirements... 2 Status of Prior Audit Recommendations... 2 Detailed Review of Transit Operator Functions... 2 Findings... 5 Recommendations TRIENNIAL PERFORMANCE AUDIT RESULTS... 7 Background... 7 Performance Audit and Report Organization... 7 Transit Program Description... 7 EDCTA Operating and Financial Statistics Review of Compliance Requirements Status of Prior Audit Recommendations Detailed Review of Transit Operator Functions EDCTA CONLCUSIONS AND RECOMMENDATIONS Findings Recommendations LIST OF TABLES TABLE PAGE 1 El Dorado Transit Fixed Route Service Performance Measures El Dorado Transit Demand Response Services Performance Measures El Dorado Transit Services Systemwide Operating Data Summary El Dorado Transit Authority Compliance Requirements LIST OF FIGURES FIGURE PAGE 1 EDCTA Fixed Routes Services Operating Cost per Passenger-Trip EDCTA Demand Response Services Operating Cost per Passenger-Trip EDCTA Systemwide Operating Cost per Passenger-Trip EDCTA Fixed Routes Services Operating Cost per Hour EDCTA Demand Response Services Operating Cost per Hour EDCTA Systemwide Operating Cost per Hour Triennial Performance Audit Page i
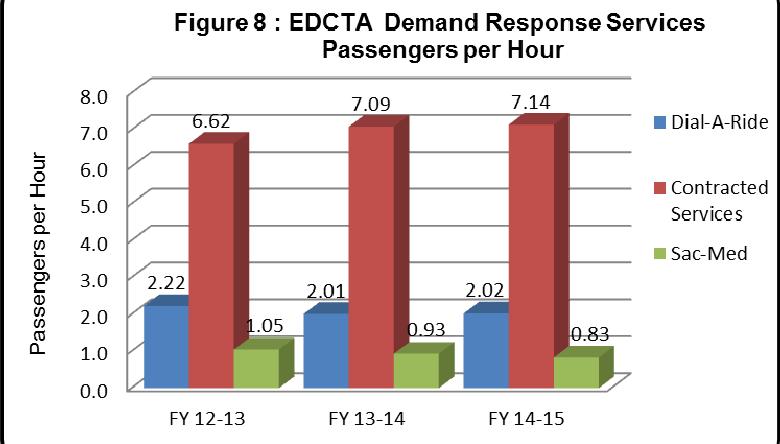
10 7 EDCTA Fixed Routes Services Passengers per Hour EDCTA Demand Response Services Passengers per Hour EDCTA Systemwide Passengers per Hour EDCTA Fixed Routes Services Passengers per Mile EDCTA Demand Response Services Passengers per Mile EDCTA Systemwide Passengers per Mile EDCTA Systemwide Hours per FTE EDCTA Fixed Routes Services Farebox Ratio EDCTA Demand Response Services Farebox Ratio EDCTA Systemwide Farebox Ratio El Dorado Transit Authority Organization Chart Page ii Triennial Performance Audit
11 Chapter 1 Executive Summary The California Public Utilities Code requires all transit operators that receive funding under Article 4 of the Transportation Development Act (TDA) be subject to a performance audit every three years. This document presents the findings from the performance audit of El Dorado County Transit Authority s (EDCTA) transit operations, which include fixed-route, commuter services, and Dial-A-Ride (DAR) programs. As the Regional Transportation Planning Agency responsible for TDA funding, these audits were performed under the authority of the El Dorado County Transportation Commission (EDCTC). This audit report covers Fiscal Year (FY) through FY , and was conducted by The field reviews and data collection efforts were conducted the spring of PERFORMANCE AUDIT REPORT AND ORGANIZATION This Audit followed the steps recommended in the Caltrans Performance Audit Guidebook: A review of pertinent documents such as the prior performance audits, annual fiscal audits, internal operating reports, adopted policies and procedures, and State Controller Reports. On-site interviews with the EDCTCA Executive Director, Operations Manager, Planning and Marketing Manager as well as other staff. BACKGROUND Western El Dorado County transit services are provided through a joint powers agreement between the County of El Dorado and the City of Placerville. The EDCTA is governed by a fivemember board of directors, with three members appointed by the County Board of Supervisors and two members appointed by the Placerville City Council. EDCTA operates a wide range of services in the western portion of the County (with service as far east as Pollock Pines) including local deviated fixed-routes, demand response, intercity commuter service, and contracted social service transportation. EDCTA s combined operations and maintenance facility is located in Diamond Springs at 6565 Commerce Way. EDCTA OPERATING AND FINANCIAL STATISTICS A series of tables and figures displaying EDCTA operating data and performance indicators during this period and the prior audit period are presented in Chapter 2. The analysis shows a small decline in performance during this audit period. This is most representative of a decrease in ridership while operating costs slowly increased at a rate slightly greater than inflation. Overall, EDCTA met TDA farebox ratio minimums and most standards adopted in the most recent Short Range Transit Plan (SRTP). Performance remained relatively steady throughout the audit period. Triennial Performance Audit Page 1
12 REVIEW OF COMPLIANCE REQUIREMENTS As an entity receiving TDA funds for transit purposes, EDCTA is required to comply with the state s financial and reporting guidelines detailed in the Performance Audit Guidebook for Transit Operators and Regional Transportation Planning Entities pursuant to TDA requirements. The guidebook identifies several specific requirements in TDA regulations that concern issues treated in performance audits. Table 4 of Chapter 2 outlines these compliance requirements. EDCTA met all the requirements with one minor exception: State Controller Reports were submitted two and three days after the required deadline in FY and FY STATUS OF PRIOR AUDIT RECOMMENDATIONS The prior TPA was prepared by PMC and contained the following recommendations: Address the exclusion of special services costs in the audited farebox ratio. Maintain consistency in farebox ratio calculations between the fiscal audit, the State Controller Report and the Administrative Operations Report. Fully implement the prior audit recommendation pertaining to directly comparing performance data against SRTP standards by mode in the year-end Administrative Operations Report. EDCTA implemented all the prior audit recommendations. DETAILED REVIEW OF TRANSIT OPERATOR FUNCTIONS This section presents a review of the various functions of El Dorado Transit. General Management and Organization All operations, administration and maintenance are performed at EDCTA s facility in Diamond Springs, California. EDCTA is operated by a staff of 72 in house employees. The management team includes five personnel: the Executive Director, Operations Manager, Fiscal Administration Manager, Human Resources/Administrative Services Manager, and Planning and Marketing Manager. Transit drivers are covered by a collective bargaining Memorandum of Understanding between EDCTA and the Operating Engineers Local No. 3 Union. Given the size of the El Dorado Transit program, its internal organization structure is appropriate. Lines of reporting are clearly defined and meetings are held regularly. EDCTA conducts sufficient administrative oversight. It regularly receives, reviews, and acts upon performance and financial information. EDCTA adopted a Personnel Policies & Procedures Manual in 2011 which clearly outlines sick leave, vacation, disciplinary actions, dress code etc. Page 2 Triennial Performance Audit
13 The Executive Director keeps a close eye on the transit operating budget and makes appropriately conservative budget forecasts. The EDCTA Board must approve substantial changes in the budget and/or spending. Financial information and performance indicators are compiled in spreadsheet format and presented to the EDCTA Board and the Transit Advisory Committee (TAC) every six months as the Administrative Operations Report. The report is also submitted to EDCTC staff. Unearned LTF revenues represent the amount of LTF allocation for operating purposes for which the transit operator is not eligible to receive, as the amount exceeds operating costs less fares, FTA grants and other adjustments. The level of unearned LTF revenues has increased during the audit period to a level where there appears to be sufficient funding available to implement operating elements of the adopted Short Range Transit Plan. The various accounting functions such as accounts payable and accounts receivable are assigned to different employees in an effort to reduce fraud. Petty cash is maintained and appropriately secure. During the audit period, EDCTA expanded a separate complimentary paratransit service for eligible ADA passengers needing door to door service within three-quarters of a mile of the local fixed routes. The Executive Director reviews the impact of service changes as part of the monthly operational review and compares results with previous expectations. In an effort to allow service changes to reach their full potential ridership, new services and demonstration projects are operated for one year before any necessary adjustments are made. Discussions with both EDCTA and EDCTC staff show that there is an effective and positive relationship between the two agencies. EDCTA also maintains a good relationship with other governmental agencies. Service Planning The EDCTC commissioned the Western El Dorado County Short and Long Range Transit Plan (SR/LRTP), which was completed by LSC Transportation Consultants in July The short range element of this plan covers FYs through while the long range element recommends transit service strategies through Several of the recommended plan elements were implemented in July 2015 (after the audit period). In terms of strategic planning, EDCTA has set clear, reasonable goals and objectives in the SRTP and LRTP. The Administrative Operations report provides the Executive Director and the Board with an easy to understand view of how EDCTA services measure up to adopted SRTP goals and standards. El Dorado Transit s entire fleet of revenue vehicles is wheelchair accessible. In an effort to ensure compliance with the Americans with Disabilities Act (ADA), EDCTA implemented paratransit service to complement the Diamond Springs, Pollock Pines and Cameron Park routes instead of offering off-route deviations. EDCTA is in compliance with ADA requirements. Triennial Performance Audit Page 3
14 EDCTA conducts public hearings and consults the Transit Advisory Committee prior to significant changes in service or fare structure. All El Dorado Transit meetings are open to the public, and are conducted in an accessible facility per the requirements of the ADA. Scheduling, Dispatch, and Operations EDCTA drivers are appropriately certified for the types of vehicles operated for El Dorado Transit and are trained to operate each vehicle in the fleet. EDCTA employs part time and extra help drivers to cover shifts for drivers on vacation or sick leave. DAR scheduling is performed using Route Match software. This software allows schedulers to easily access a database of passenger information, sort passenger-trip requests geographically, and provides several trip options for dispatchers to choose from. DAR no-show policies and subscription service forms are clearly outlined on the website. Subscription service does not present capacity constraints for DAR service. EDCTA uses a variety of means to recruit new drivers and provides all initial and on-going driver training on-site using EDCTA staff. EDCTA s Personnel Policies & Procedures Manual details its formalized employee discipline program and Drug and Alcohol policy. EDCTA is covered under the CalTIP vehicle liability insurance pool at an adequate level. Established procedures for processing and investigating accident/injury claims are currently in place. EDCTA is a component of the County Office of Emergency Services Emergency Preparedness plan. The El Dorado Transit facility in Diamond Springs provides adequate and secure office space for administrative and dispatching functions. The fare collection system includes a system of checks and balances which limit the opportunity for theft. Marketing and Public Information El Dorado Transit has a robust marketing program. In 2015, El Dorado Transit completed an update of the El Dorado Transit Assessment and Marketing Plan. EDCTA has implemented several recommendations such as rebranding and updating the website. An annual summary of customer complaints and compliments is included in the Administrative Operations Report so that the EDCTA and EDCTC board are aware of the public s opinion of the transit system. Maintenance The EDCTA fleet ranges from 5-passenger minivans used for demand response services to 45- passenger buses for commuter services. As the EDCTA fleet ages and vehicles are no longer covered by warranty, road calls and vehicle maintenance costs per hour rise. EDCTA maintenance staff use Squarerigger Fleet Maintenance software to track preventative maintenance repairs for the transit fleet. A preventive maintenance schedule is in place that Page 4 Triennial Performance Audit
15 meets the requirements of the bus manufacturers. The operations/maintenance facility appears to be sufficient for the varied types of vehicles operated. EDCTA has procured several vehicle maintenance related technologies such as Zonar and vehicle information management software which provide maintenance staff with a greater level information pertaining to fleet management. FINDINGS The Auditor s analysis of EDCTA indicates that, in terms of operations, the system was efficiently run and well managed during the audit period. With two minor exceptions, EDCTA was found to be in compliance with all performance related sections of the TDA public utilities code, as identified in Table 4. EDCTA submitted annual reports to the State Controller less than five days after the deadline for two years of the audit period. Data collection has improved with Route Match software and mobile data terminals. With the ability to automatically download data and create reports, the process is less subject to human error. Despite a strong marketing program, ridership on EDCTA services systemwide declined during the audit period. Low gas prices decreases the attractiveness of public transit and may have attributed to the decline. In July 2015, EDCTA implemented several service changes, such as a revised US 50 Express and Cameron Park route, designed to increase frequency and better meet the needs of US 50 corridor residents. Transit services provided by El Dorado Transit meet all TDA-requirements including the farebox ratio requirement. RECOMMENDATIONS Recommendation: EDCTA should work with the Fiscal Auditor to correctly exclude the El Dorado Air Quality Grant revenue when calculating farebox ratio. In FY , farebox ratio was calculated differently than the first two years of the audit period. The fiscal auditor included revenue received from the El Dorado County Air Quality Grant to operate the Fair Shuttle as fare revenue. The California State Controller classifies this type of local cash grant as non-operating revenue (Class ) and therefore it should not be included in farebox ratio calculation. The local match for the El Dorado Air Quality Grant provided by the Fair Association is classified as Special Transit Fares, as it is revenue given to guarantee a special route for which the Fair Association is a beneficiary of the service. Special Transit Fares can be included in farebox ratio calculation. The TDA local match provided by EDCTA is not considered fare revenue. EDCTA should work with the fiscal auditor to ensure that farebox ratio is calculated correctly. Note that other internal documents not submitted to the State Controller can address this grant income differently. Triennial Performance Audit Page 5
16 Recommendation: If management is confident with the financial outlook for EDCTA operating requirements, EDCTA should strive to narrow the gap between the LTF allocation request for operating assistance and the maximum amount of LTF required for operating assistance. According to the fiscal and compliance audits, there were unearned LTF allocations in the amount of $363,177 in FY , $817,641 in FY and $1,253,413 in FY Unearned LTF revenues represent the amount of LTF operating allocation for which the transit operator is not eligible to receive because the allocated amount exceeds operating costs less fares, FTA grants and other adjustments ( unspent funds). It is not unusual to have an unearned LTF balance at the end of the year. During this audit period, EDCTA was appropriately conservative with budgeting for unknown operating costs increases such as labor costs resulting from a new union contract and a salary scale adjustment. These cost increases actually occurred in a later fiscal year than budgeted; thereby contributing to a difference in the allocation request and actual operating expenses. Since July 2015, EDCTA has implemented service changes such as the El Dorado Hills Taxi Voucher program and revised US 50 Express/Cameron Park routes which will also increase the annual operating budget over the prior year. Transit budgeting always has a degree of uncertainty. During the recession of , for example, many transit agencies were forced to cut service due to a sudden drop in sales tax revenue. For this reason, it is prudent to maintain some level of LTF reserve. The new EDCTC LTF reserve policy will help to provide that financial cushion along with a conservative transit operating budget. However, the unearned LTF balance has grown to a level where there appears to be sufficient funding available to implement additional operating elements of the adopted SRTP. It also appears that both revenues and costs can now be estimated with a greater degree of certainty that over the past few years. In evaluating the financial outlook for EDCTA, management should consider both the operating and long term capital requirements of the system and request LTF funds in an amount which is closer to actual costs. Page 6 Triennial Performance Audit
17 Chapter 2 Triennial Performance Audit Results BACKGROUND The Transportation Development Act (TDA), also known as the Mills-Alquist Deddeh Act, provides two major sources of funding for public transportation providers in California: the Local Transportation Fund (LTF) and the State Transit Assistance (STA). The LTF is derived from 0.25 percent of the 7.25 percent retail sales tax collected statewide and can be used for a variety of transportation purposes according to a set of priorities detailed in the Act. The State Board of Equalization returns the LTF to each county according to the amount of tax collected in that county. STA funds are derived from statewide sales tax on diesel fuel, and are allocated to each county based on the following formula: 50 percent according to population, and 50 percent according to operator revenues from the prior fiscal year. STA funds can only be used to pay for transit planning, capital projects, and operations. TDA law requires that a Triennial Performance Audit (TPA) be conducted for all transit operators and Regional Transportation Planning Agencies. A performance audit is a systematic process of evaluating an organization s effectiveness, efficiency, and economy of operations under management control. The objectives of the audit are to provide a means for evaluating an organization s performance and to enhance the performance by making recommendations for improvements. In addition, the audit evaluates the adequacy of an organization s systems and the degree of compliance with established policies and procedures. PERFORMANCE AUDIT AND REPORT ORGANIZATION This performance audit included the following steps as recommended in the Performance Audit Guidebook: Review of compliance with certain performance related TDA statutes and requirements Follow-up review of prior performance audit recommendations Performance indicator analysis of EDCTA services On site interviews with several EDCTA staff to discuss transit operator functions Preparation of the Draft Audit report TRANSIT PROGRAM DESCRIPTION Modern public transit services have been available in western El Dorado County since the late 1970s. Service was provided to the elderly and disabled population of greater Placerville until 1980, when it was opened to the general public. In recent years, a well-established public transit system has developed, serving both the Placerville area and regionally. The creation of the EDCTA in 1993 has proven to be an important milestone in the provision of an effective and well-accepted public transit system. Western El Dorado County transit services are provided through a joint powers agreement between the County of El Dorado and the City of Placerville. The EDCTA is governed by a five- Triennial Performance Audit Page 7
18 member board of directors, three members appointed by the County Board of Supervisors and two members appointed by the Placerville City Council. Additionally, a Transit Advisory Committee (TAC), made up of nine members representing transit disadvantaged groups, human service providers, and non-profit organizations, is responsible for reviewing the operation of the transit system, monitoring levels of service as they fall within funding constraints, and providing advice to the Executive Director. Agencies and groups represented on the TAC include El Dorado County Transportation Commission, Chamber of Commerce, 50 Corridor Transportation Management Association, senior representative, disabled representative, low income representative, and commuter representative. The TAC meets every other month to provide input on transportation issues. Funds for El Dorado Transit come from many sources, including those allocated by the EDCTC, which consists of voting members from El Dorado County and the City of Placerville, and advisory members from Caltrans and the City of South Lake Tahoe. EDCTA operates a wide range of services including local deviated fixed-routes, demand response, intercity commuter service, and contracted social service transportation. The following describes each of the existing services. El Dorado Transit Local Routes Placerville Route 20 This route travels along the US Highway 50 (US 50) corridor in the City of Placerville between the Missouri Flat Transfer Station and the Placerville Transfer Station. Diamond Springs Route 30 The Diamond Springs route begins and ends at the Missouri Flat Transfer Center and serves a loop around Diamond Springs. Service is provided to the Folsom Lake College El Dorado Campus. Cameron Park Route 40 This route loops around Cameron Park and Shingle Springs, providing transfers to the 50 Express and Sacramento Commuter Routes. 50 Express Route This route provides hourly service between the Missouri Flat Transfer Center, Folsom Iron Point Light Rail Station and Folsom Lake College. This route recently (July 2015) replaced the previous Iron Point Connector Commuter service. Pollock Pines Route 60 The Pollock Pines route travels in an east and west direction along the US 50 corridor between the Missouri Flat Transfer Center in Diamond Springs and Pollock Pines. ADA Complimentary Paratransit Door to door public transit service is available to qualified passengers within a ¾ mile radius of the local fixed routes: Placerville, Diamond Springs, Pollock Pines and Cameron Park. This is a new service during the audit period. Page 8 Triennial Performance Audit
19 El Dorado Transit Commuter Routes Sacramento Commuter El Dorado Transit provides weekday commuter service to downtown Sacramento during the morning and afternoon commute periods. Eleven runs are offered to Sacramento in the morning with eleven return runs in the afternoon. Reverse Commuter Additionally, El Dorado Transit offers two roundtrips per day as Reverse Commute service, from Sacramento to Placerville. These are provided by Commuter buses, which would be running in the off-peak direction in any case. El Dorado Transit Demand Response Services Dial-A-Ride (DAR) Reservation service is offered to the general public seven days a week in the greater Placerville, Camino, Diamond Springs, and Cameron Park area, with priority service for seniors and persons with disabilities. Service to El Dorado Hills, Garden Valley, Pollock Pines, and Nashville is also available to elderly and disabled passengers. DAR uses a zone fare based system. SAC-MED This demand response type service is a non-emergency medical transportation service for the general public with medical appointments in Sacramento County. Service is offered twice weekly. Grizzly Flat Flex Route The Grizzly Flat Route operates a reservation service one day a week between Placerville and Grizzly Flat in rural southern El Dorado County. A minimum of five reservations two days prior are required to operate this route. El Dorado Hills Taxi Voucher To supplement DAR in the community of El Dorado Hills, a subsidized tax voucher program is available to seniors and persons with disabilities. Contracted Social Services EDCTA contracts with M.O.R.E. and Senior Day Care to provide subscription DAR service between program participant homes and program facilities in Placerville. Alta Regional Center provides funding for M.O.R.E clients. Special Services El Dorado County Fair Shuttle This service provides transportation for fair-goers between parking lots and the fair grounds and is funded through an El Dorado County Air Quality grant. Apple Hill Shuttle In FY and FY , EDCTA operated a free shuttle service from Placerville to the Apple Hill farms in the Camino area. This service was funded through an El Dorado County Air Quality grant. The Shuttle was discontinued in FY as traffic congestion made the shuttle ineffective. Triennial Performance Audit Page 9
20 EDCTA OPERATING AND FINANCIAL STATISTICS The following section quantitatively analyzes the performance of EDCTA services. Operating data and financial statistics are presented in Tables 1-3 and Figures Operating data was obtained from EDCTA annual operations reports while financial data was obtained from annual Fiscal and Compliance Audits. EDCTA data by service type is presented in Tables 1and 2 while Table 3 presents a summary of systemwide data. Operating data from the Administrative Operations reports was compared to data reported to the State Controller. The figures in each report were generally consistent, within one percent. The only exception was for the FY State Controller report, it appears that the page presenting operating data for demand response services was accidently omitted. This caused the operating data totals to be incorrect. Data Collection Methods As part of the TPA process, the auditor must collect and verify the following transit operator statistics are recorded in accordance with established TDA definitions: n n n n Passenger Counts Operating Cost Vehicle Service Hours Vehicle Service Miles n n Fare Revenue Employee Hours in Full-Time Equivalents Passenger Counts TDA defines passenger counts as one-way unlinked trips. EDCTA s counting of passengers is consistent with this definition. As described in the functional review section, EDCTA employs computer tablets to record operating statistics such as passengers, hours, and miles. Table 3 presents annual ridership data for EDCTA services during the audit period, as well as data from the previous three-year period (for purposes of comparison). Ridership steadily decreased during the audit period by a total of 9.8 percent. It is likely that the downward trend in gas prices had a negative impact on transit ridership. As can be seen in Table 1, local fixed route ridership experienced a 9.7 percent decline in FY while commuter ridership (which is a reflection of state worker hiring trends and housing patterns) grew by 5.7 percent during the same year. Special services ridership declined by over 70 percent during the audit period due to the discontinuation of the Apple Hill Shuttle in FY As shown in Table 2, DAR ridership declined along with fixed route ridership but the Sac-Med service saw an increase of 88 annual trips in FY Operating Costs Per TDA, operating costs include the annual cost of running a transit operation exclusive of depreciation, capital expenditures, vehicle lease costs, and direct costs of providing charter service. EDCTA follows this definition. As can be seen in Table 3, systemwide operating costs increased by 5.2 percent between FY and FY This rate of increase is slightly higher than the rate of inflation during this time period as per the growth of the Consumer Price Index (3.0 percent). Operating costs for Page 10 Triennial Performance Audit
21 TABLE 1 : El Dorado Transit Fixed Route Services Performance Measures Local Fixed Routes Commuter Routes Special Services Performance Measures One-Way Passenger-Trips 171, , , , , ,465 37,725 33,867 10,525 % Change from Previous Year % -0.3% % -1.7% % -68.9% Vehicle Service Hours 15,738 15,871 15,605 11,048 11,102 11, % Change from Previous Year % -1.7% % 0.8% % -66.2% Vehicle Service Miles 276, , , , , ,446 8,069 6,685 1,283 % Change from Previous Year % -0.5% % -0.6% % -80.8% Operating Costs $1,735,772 $1,835,347 $1,880,061 $1,427,434 $1,540,497 $1,584,096 $109,893 $109,467 $31,336 % Change from Previous Year % 2.4% % 2.8% % -71.4% Farebox Revenues $191,661 $171,661 $166,157 $779,384 $827,863 $839,799 $6,600 $6,600 $5,240 % Change from Previous Year % -3.2% % 1.4% % -20.6% Operating Cost per One-Way Passenger-Trip % Change from Previous Year % 2.8% % 4.6% % -7.9% Operating Cost per Vehicle Service Hour $ $ $ $ $ $ $ $ $ % Change from Previous Year % 4.2% % 2.0% % -15.3% Passengers per Vehicle Service Hour % Change from Previous Year % 1.4% % -2.5% % -8.0% Passengers per Vehicle Service Mile % Change from Previous Year % 0.2% % -1.1% % 61.9% Farebox Recovery Ratio 11.0% 9.4% 8.8% 54.6% 53.7% 53.0% 6.0% 6.0% 16.7% % Change from Previous Year % -5.5% % -1.4% % 177.4% Triennial Performance Audit Page 11
22 TABLE 2 : El Dorado Transit Demand Response Services Performance Measures Dial-A-Ride Contracted Services Sac-Med Performance Measures One-Way Passenger-Trips 26,488 24,831 24,466 33,804 36,739 34, % Change from Previous Year % -1.5% % -7.4% % 16.8% Vehicle Service Hours 11,921 12,351 12,096 5,106 5,185 4, % Change from Previous Year % -2.1% % -8.1% % 31.3% Vehicle Service Miles 246, , , , , ,772 16,618 16,063 20,739 % Change from Previous Year % -6.0% % -10.9% % 29.1% Operating Costs $1,368,563 $1,484,133 $1,492,948 $604,468 $649,633 $611,858 $72,034 $77,108 $101,841 % Change from Previous Year % 0.6% % -5.8% % 32.1% Farebox Revenues $70,801 $67,652 $66,020 $460,354 $512,723 $521,820 $4,906 $4,440 $5,600 % Change from Previous Year % -2.4% % 1.8% % 26.1% Operating Cost per One-Way Passenger-Trip % Change from Previous Year % 2.1% % 1.7% % 13.1% Operating Cost per Vehicle Service Hour $ $ $ $ $ $ $ $ $ % Change from Previous Year % 2.7% % 2.5% % 0.6% Passengers per Vehicle Service Hour % Change from Previous Year % 0.6% % 0.8% % -11.0% Passengers per Vehicle Service Mile % Change from Previous Year % 4.9% % 3.9% % -9.6% Farebox Recovery Ratio 5.2% 4.6% 4.4% 76.2% 78.9% 85.3% 6.8% 5.8% 5.5% % Change from Previous Year % -3.0% % 8.1% % -4.5% Page 12 Triennial Performance Audit
23 TABLE 3 : El Dorado Transit Services Systemwide Operating Data Summary Previous Audit Period Current Audit Period Performance Measures One-Way Passenger-Trips 398, , , , , ,723 % Change from Previous Year % 2.7% -2.2% -2.7% -7.3% Vehicle Service Hours 43,851 44,441 44,412 44,968 45,581 44,567 % Change from Previous Year % -0.1% 1.3% 1.4% -2.2% Vehicle Service Miles 996,189 1,023,239 1,027,860 1,009,071 1,000, ,256 % Change from Previous Year % 0.5% -1.8% -0.9% -3.2% Operating Costs $4,893,552 $5,065,945 $5,415,360 $5,476,262 $5,764,633 $5,758,468 % Change from Previous Year % 6.9% 1.1% 5.3% -0.1% # Employees in FTEs % Change from Previous Year % 0.0% 1.7% 0.0% 0.0% Farebox Revenues $1,303,605 $1,406,657 $1,496,916 $1,513,603 $1,589,115 $1,609,426 % Change from Previous Year % 6.4% 1.1% 5.0% 1.3% Operating Cost per One-Way Passenger-Trip % Change from Previous Year % 4.1% 3.4% 8.2% 7.8% Operating Cost per Vehicle Service Hour $ $ $ $ $ $ % Change from Previous Year % 7.0% -0.1% 3.9% 2.2% Passengers per Vehicle Service Hour % Change from Previous Year % 2.8% -3.4% -4.0% -5.2% Passengers per Vehicle Service Mile % Change from Previous Year % 2.2% -0.4% -1.8% -4.3% Vehicle Service Hours per FTE % Change from Previous Year % -0.1% -0.4% 1.4% -2.2% Farebox Recovery Ratio 26.6% 27.8% 27.6% 27.6% 27.6% 27.9% % Change from Previous Year % -0.4% 0.0% -0.3% 1.4% Note: Previous audit period data obtained from prior performance audit. Triennial Performance Audit Page 13
24 most EDCTA services did not increase more than 5 to 7 percent in one year with the exception of Sac-Med where service levels also increased significantly on a percentage basis. Vehicle Service Hours Vehicle service hours include that time during which a revenue vehicle is available to carry fare-paying passengers, and which includes only those times between the time or schedule time of the first passenger pickup and the last passenger drop-off during a period of the vehicle s continuous availability. EDCTA records vehicle service hours correctly. Drivers are instructed to key in separate commands into the tablets for start route and start run. This allows for the proper recording of vehicle service hours and deadhead hours. Systemwide service levels remained relatively constant throughout this audit period (Table 3). More significant changes in service levels occurred for Special Services (Table 1) as the Apple Hill Shuttle was discontinued and Demand Response Services (Table 2) where the Sac-Med service was increased. Vehicle Service Miles TDA defines vehicle service miles as those miles traveled by revenue vehicles during their vehicle service hours. As indicated in the Vehicle Service Hours discussion, EDCTA records vehicle service miles correctly. Systemwide vehicle service miles decreased by around 4.0 percent during the audit period. The change reflects the service level changes identified above as well as a decrease in DAR vehicle service miles. The Fare Revenue data presented in Table 3 was obtained from annual Fiscal and Compliance Audit reports. Fare revenue by service was obtained from Administrative Operations Reports. There were minor differences between fare revenue in Administrative Operations Reports and the Fiscal and Compliance audit but this is not unusual as the Administrative Operations Reports use unaudited data. TDA PUC Section states that fare revenues are defined as revenue in object classes 401, 402, and 403, as specified in Section of Title 49 of the Code of Federal Regulations: Object class 401 revenues include full adult, senior, student, child, handicapped, Park-and- Ride lot revenues (must be operated by transit operator), special and reduced fares collected from passengers. Object class 402 revenues include guaranteed revenues collected from an organization rather than a rider for rides given along special routes. Object class 403 revenues include revenues collected from schools for providing service to children to and from school. Fare revenue also includes the amount of revenue received by an entity under contract for transit services not yet transferred to the claimant. Additionally, the definition of fare revenues includes fares collected (1) for a specified group of employees, members, or clients, or (2) to guarantee a minimum revenue on a line operated especially for the benefit of the paying entity (e.g. an Page 14 Triennial Performance Audit
25 employer, shopping center, university, etc.), or (3) cash donations made by individual passengers in lieu of a prescribed fare. Fare revenue does not include other donations or general operating assistance, whether from public or private sources. Charter revenues can be included in the fare revenue category. EDCTA calculates and reports fare revenue correctly to the State Controller. The Employee Hours data presented in Tables 1 to 3 was obtained from internal reports. The Full-Time Equivalent (FTE) definition currently used by EDCTA is consistent with the definition presented in Appendix B of the Performance Audit Guidebook which is the number of person hours worked by persons employed in connection with the public transit system divided by 2,000. Full-Time Equivalent employees remained constant during this audit period and increased by 1 since the prior audit period. During this audit period, the driver bid was changed to include more full time positions. Essentially, the number of drivers has stayed the same but there was an increase in the number of hours worked. EDCTA records for 2016 show that FTEs returned to 59.0 in Calculation and Evaluation of Performance Indicators Performance indicators are frequently used to quantify and review the efficiency and effectiveness of a transit operator s activities. Such indicators can provide insight on current operations as well as on the operator s performance over a period of time. Using the data described above, the following performance indicators were calculated as required in Section 99246(d) of the Public Utilities Code: Operating Cost per Passenger Operating Cost per Vehicle Revenue Hour Passengers per Vehicle Revenue Hour Passengers per Vehicle Revenue Mile Vehicle Revenue Hours per Employee In addition, the Farebox Recovery Ratio is calculated and evaluated herein, as required in Section et seq. of the Public Utilities Code. The Operating Cost per (One-way) Passenger-Trip data is presented in Tables 1 to 3 and Figures 1 to 3. This performance measure is a key indicator of a transit system s cost effectiveness. According to the available data, the operating cost per one-way passenger-trip increased steadily over the audit period from $13.22 to $ This also represents an increase over the prior audit period. The decline in this performance indicator is largely due to a decrease in ridership while operating costs increased with inflation. The Operating Cost per Vehicle Revenue Hour data is presented in Tables 1to3 and Figures 4 to 6. This performance measure is a key indicator of a transit system s cost efficiency. The operating cost per vehicle revenue hour increased from $ to $ during this audit period and is significantly greater than the operating cost per hour of $ in FY Since FY vehicle service hours only increased by 1.6 percent whereas operating costs rose at a greater rate than inflation. Triennial Performance Audit Page 15
26 The Passengers per Vehicle Revenue Hour (commonly referred to as productivity ) is presented in Tables 1 3 and Figures 7-9. Although productivity experienced a decline during this audit period, it is on par with the level of decrease in ridership. The adopted Short Range Transit Plan (SRTP) includes a list of goals and standards for EDCTA services by type of service. Commuter services passenger trips per hour Local route services = 5.0 passenger trips her hour Rural services (Grizzly Flat Route) = 2.5 passenger trips per hour Demand response services = 2.0 passenger trips per hour All these productivity standards were met during the audit period. The Passengers per Vehicle Revenue Mile data is presented in Table 1 to 3 and Figure 10 to 12. As presented, passengers per vehicle revenue mile has remained relatively steady during the audit period with a slight decrease in FY This was due to a decrease in vehicle service miles for DAR, special services, and contracted services. The Vehicle Service Hours per Employee data is presented in Tables 1 to 3 and Figure 13. As presented, the number of vehicle revenue hours per Full Time Equivalent (FTE) decreased slightly during the audit period from to but has remained relatively steady since FY Farebox Recovery Ratio - Transit operators who make claims under Article 4 of the TDA in rural counties must maintain a minimum farebox recovery ratio of 10 percent, unless they achieved a higher ratio in the base year FY , while transit operators in urbanized areas must maintain the greater of a 20 percent farebox ratio or the ratio attained FY El Dorado County includes both rural and urbanized areas as defined by the US Census Bureau. Therefore, EDCTA is subject to a blended farebox recovery ratio. The Sacramento Urbanized Area boundary has expanded over the past two decennial census to include a larger portion of western El Dorado County. As such, EDCTC changed the adopted blended farebox ratio from 11.5 percent to percent in June of 2014, to be consistent with 2010 Census urbanized area boundaries. EDCTA farebox ratio data is presented in Tables 1 to 3 and Figures For the first two years of the audit period, EDCTA was required to meet a blended farebox ratio of 11.5 percent. EDCTA s farebox ratio was 27.6 percent for those years. The farebox recovery ratio of percent in FY far surpasses the required minimum farebox ratio of 12.2 percent for EDCTA services that year. This is largely due to high farebox ratios for the commuter services and contracted services. Over the past six years systemwide farebox ratio has remained in the 26 to 27 percent range. The SRTP s adopted farebox ratio standards by service type are as follows: Commuter Services = 50% Local Services = 10% Page 16 Triennial Performance Audit


27 Rural Services = 5% Demand Response Services = NA Commuter Services and Rural Services met the standard but Local Services fell below the 10 percent farebox ratio in FY and FY The Fiscal and Compliance auditor is responsible for the official farebox ratio calculation. In FY , the fiscal and compliance auditor included revenue from the El Dorado County Air Quality Grants as fare revenue for the farebox ratio calculation. This did not occur for the other two years of the audit period. The air quality grant funds fall under the non-operating revenue category Local Cash Grants and Reimbursements- General Operating Assistance and therefore should not be included in the farebox ratio calculation. Performance Indicator Summary The performance declines seen during this audit period are most representative of a decrease in ridership while operating costs slowly increased at a rate slightly greater than inflation. Trends in transit ridership can be difficult to pinpoint but are often related to gas prices, as well as shifts in population demographics. Interestingly, the commuter services experienced an increase in ridership while local fixed routes and DAR experienced decreases. With a rebound in the economy, the state has rehired some of its workforce. This may have boosted commuter service ridership. Overall, EDCTA met TDA farebox ratio minimums and most internal standards. Performance remained relatively steady throughout the audit period. Figure 1: EDCTA Fixed Routes Services Operating Cost per Passenger-Trip Operating Cost per Pax-trip $14.00 $11.83 $12.16 $12.00 $10.10 $9.92 $10.13 $10.60 $10.00 $8.00 $6.00 $4.00 $2.91 $3.23 $2.98 $2.00 $0.00 FY FY FY Local Fixed Routes Commuter Routes Special Services Triennial Performance Audit Page 17


28 Page 18 Triennial Performance Audit


29 Triennial Performance Audit Page 19


30 Page 20 Triennial Performance Audit

31 Triennial Performance Audit Page 21


32 Page 22 Triennial Performance Audit


33 Triennial Performance Audit Page 23


34 Page 24 Triennial Performance Audit

35 Recommendations on Data Collection Operating data reported to the State Controller in the Transit Operators and Non-Transit Claimants Annual Reports very closely match that found in the Annual Administrative Operations Reports. The only exception was for FY where it appears that the demand response input page was accidently omitted from the report. The overall data collection and recording process for EDCTA is good. EDCTA uses Route Match software to collect and report transit operating data. Drivers are provided with a computer tablet for recording operating data such as passengers, hours and miles. Using the tablets, the driver s record: the beginning of the route, beginning of the run, type of passenger etc. The data is automatically downloaded to the cloud, allowing operating statistics reports by route to be easily be produced. The Executive Director receives copies of these reports periodically and maintains the reports in a binder for easy reference. These reports are used by the Fiscal Administration Manager to prepare the Administrative Operations Reports. Each day a dispatcher verifies the driver data input from the prior day in case of driver or software error. EDCTA has discovered some errors in the Route Match data collection process for the fixed routes, likely due to lost connection issues. Therefore, fixed route drivers use both the tablets and paper entry. The Route Match software allows for fewer opportunities for human error than if operating data were manually entered using a counter board or paper manifest. Triennial Performance Audit Page 25