MOTOR MPO CONGESTION MANAGEMENT PROCESS (CMP)
|
|
|
- Joel Gibson
- 5 years ago
- Views:
Transcription

1 MOTOR MPO CONGESTION MANAGEMENT PROCESS (CMP) Background: Metropolitan Planning Organizations that have been designated as a Transportation Management Area (TMA) are required to develop a Congestion Management Process within 18 months of that designation. MOTOR MPO was designated a TMA in July 2012 by the Governor and, therefore, must develop a CMP by January The purpose of the CMP is to improve the transportation system performance and reliability by reducing adverse impacts of congestion on the movement of people and goods. A CMP network will be established to reflect corridors that are currently experiencing congestion as well as corridors where congestion is anticipated. The CMP is a tool that will be used in the MTP project selection process. Elements of the CMP are outlined below: Develop CMP goals and objectives and performance measures Define CMP network Develop a monitoring plan Collect data Analyze data/identify congestion problems and needs Identify and assess strategies Monitor and evaluate project implementation effectiveness The CMP is a dynamic document that will be updated as data is obtained and evaluated. Therefore, the initial CMP lays the framework for the process and will include some of the elements outlined above; however, elements such as data collection and analysis, and strategy implementation and evaluation, will occur in subsequent stages. Schedule: November 14, TAC recommendation to approve an initial draft November 18, PB approval of draft January 16, TAC recommendation to approve final draft of the CMP February 10, PB approval of CMP October 20, Amended Congestion Monitoring Network Map & MAB. 1 P age
2 Public Comment Form MOTOR MPO Name: Title: Agency: Phone: Cell: Address: Comments: For more information, please contact: MOTOR MPO P.O. Box Midland, TX Phone: (432) Fax: (432) P age
3 1.0 Introduction Congestion management is the application of strategies to improve transportation system performance and reliability by reducing the adverse impacts of congestion on the movement of people and goods. A congestion management process (CMP) is a systematic approach for managing congestion that provides accurate, up-to-date information on transportation system performance and assesses alternative strategies for congestion management that meet state and local needs. The CMP is intended to move these congestion management strategies into the funding and implementation stages. The CMP, as defined in federal regulations, is intended to serve as a systematic process that provides safe and effective integrated management and operation of the multimodal transportation system. The process includes: Development of congestion management objectives Establishment of measures of multimodal transportation system performance Collection of data and system performance measurement to define the extent and duration of congestion and determine the causes of congestion Identification of congestion management strategies Implementation of activities, including identification of an implementation schedule and possible funding sources for each strategy Evaluation of the effectiveness of implemented strategies A CMP is required in all Transportation Management Areas (TMAs). Federal requirements also state that in all TMAs, the CMP shall be developed and implemented as an integrated part of the metropolitan transportation planning process. The Congestion Management System (CMS) was first introduced by the lntermodal Surface Transportation Efficiency Act (ISTEA) of 1991 and was continued under the successive transportation authorization laws, including the current law, Moving Ahead for Progress in the 21st Century (MAP-21). Whereas previous laws referred to this set of activities as a "congestion management system" (CMS), the Safe, Accountable, Flexible, Efficient Transportation Equity Act: A Legacy for Users (SAFETEA-LU) refers to a "congestion management process, reflecting that the goal of the law is to utilize a process that is an integral component of metropolitan transportation planning. While the CMS was often treated as a stand-alone data analysis exercise or report on metropolitan area traffic congestion, the CMP is intended to be an on-going process; one that is fully integrated into the metropolitan transportation planning process. The CMP is a "living" document, continually evolving to address the results of performance measures, concerns of the community, new objectives and goals of the MPO, and up-to-date information on congestion issues as they become applicable across all transportation modes. 3 P age

4 2.0 MOTOR MPO Congestion Management Process The Midland Odessa Transportation Organization Metropolitan Planning Organization (MOTOR MPO) is the region's metropolitan planning organization (MPO). The estimated population within MOTOR MPO planning area, as per 2010 US Census, is 225,832 persons. More recent estimates completed in 2013 by MOTOR MPO member agencies indicate that there are over 325,000 persons in the Metropolitan Area Boundary (MAB), shown in Figure 1 below. Population growth in the MAB has occurred record setting paces for both Midland and Odessa; both cities have issued residential building permits that surpass previous records. This growth trend is anticipated to continue over the next twenty years. Within this boundary, MOTOR MPO has the responsibility of coordinating safe and efficient mobility for cyclists, pedestrians, transit providers and passengers, air traffic, and automotive/truck transportation. Figure 1: MOTOR Metropolitan Area Boundary 4 P age
5 MOTOR MPO has further described congestion management steps identified below. The steps are in progressive order. Develop CMP Goals and Objectives- It is important to understand and state within MOTOR documents, "What is the desired outcome?" and "What does MOTOR want to achieve with its CMP efforts? It may not be feasible or desirable to eliminate all congestion, and therefore it is important to define objectives for congestion management that achieve the desired outcome. Define the Congestion Monitoring Network- This process involves answering the question, "Which roadways will be monitored for current and future congestion (including non-auto)? and involves defining both the metropolitan area boundary and system elements (e.g. freeways, major arterials, transit routes) that will be analyzed in the CMP. Develop Performance Measures- The CMP will address, ''How does MOTOR define and measure congestion?" This process involves developing performance measures that will be used to measure congestion on both a regional and local scale. These performance measures should relate to, and support, regional objectives. Determine Data Types/Sources and Collect Data/Establish Baseline Database- The CMP will consider numerous types of data as well as data sources including crash data (frequency and duration), travel time data, intersection and corridor congestion data, Bluetooth data, total vehicle and vehicle classification data. After performance measures are defined, data should be collected and analyzed to determine, "How does the transportation system perform? Data collection may be on-going and involve a wide range of data sources and partners. Identify Congestion Problems and Needs- Using data analysis techniques, results from public workshops, and staff and Technical Advisory Committee (TAC) input, the CMP should address the question, "What congestion problems are present or anticipated in the region?" Identify and Assess Strategies- Working together with its partners, the CMP should address the question, "What strategies or best practices may be incorporated to mitigate congestion?" This action involves identifying and assessing potential strategies, including project selection. Program and Implementation Strategies- This process involves answering the question, How and when will solutions be implemented?" It typically includes strategies and project selection in the MTP, determining funding sources, prioritizing strategies, allocating funding in the TIP, and ultimately, implementing these strategies. 5 P age
6 Monitor Strategy Effectiveness - Finally, efforts should be undertaken to assess, "What has MOTOR MPO learned about implemented strategies? and How have they affected the transportation system? This process will be closely tied to the monitoring system performance and is designed to inform future decision makers about the effectiveness of transportation strategies. Vision, Goals and Objectives As with any process, it is important to establish the vision, goals and objectives early on. Generally, the vision, goals and objectives used for this process are the same as those adopted by the Policy Board in early 2013 as shown below; however some specific objectives are included as part of Goal 3 and Goal 4 in order to establish measureable performance standards. These measureable objectives are listed on page 17. The goals state what is important to the MPO and affected stakeholders as part of the CMP process and the objectives define what MOTOR MPO wants to achieve regarding congestion management. They are an essential part of an objectivesdriven, performance-based approach to planning for operations. These objectives will also serve as one of the primary points of connection between the CMP and the Metropolitan Transportation Plan (MTP). A Vision and a set of Goals and Objectives of MOTOR MPO s CMP was developed based on review of existing MOTOR MPO planning documents and using the best practice research as a guide. MOTOR MPO will work to promote projects that support the stated vision, goals and objectives contained in the Metropolitan Transportation Plan. Vision To have an affordable system of transportation infrastructure and services that safely connects the regional community and fosters economic prosperity and quality of life. Goals and Objectives Goal 1: Be the leader of transportation planning Objectives: Understand transportation trends and needs Identify attainable solutions Goal 2: Obtain collaborative input Objectives:. Foster broad public participation Make informed decisions through cooperative forums 6 P age
7 Goal 3: Incorporate safety consideration in transportation planning Objectives: Reduce fatalities and crashes Understand safety matters Goal 4: Connect transportation infrastructure and services Objectives: Reduce network gaps and conflicts Incorporate multiple modes of transportation in planning Raise public awareness of available resources 2.1 Congestion Network The CMP must identify where congestion occurs and what its causes are; by completing this task, a clearer focus can be applied to transportation planning efforts. The majority of congestion in the MOTOR MAB is most likely experienced by car and truck drivers and transit services on the designated congestion network map shown on page 9. The main focus of this CMP will be on road and transit impacted congestion; however, other modes of transportation may also be reviewed as data becomes available to MOTOR. Federal regulation 23 CFR defines congestion as "the level at which transportation system performance is unacceptable due to excessive travel times and delays." According to the Federal Highway Administration (FHWA), roadway congestion is comprised of three key elements: severity, extent, and duration. The blending of these elements will determine the overall effect of congestion on roadway users. The severity of congestion refers to the magnitude of the problem at its peak. The extent of congestion describes the geographic area or number of affected motorists, while the duration describes the length of time that users experience congested conditions. Because these elements have a direct relationship, any increase in one will subsequently result in an increase in the others. Therefore, as roadway congestion continues to build (increased severity), more travel will occur under congested conditions (increased duration) affecting an increasing number of motorists and roadway facilities (increased extent). The MOTOR Policy Board will consider existing and future congestion identified through the Congestion Management Process when prioritizing and funding projects and programs. Congestion occurs due to a number of foreseeable and unforeseeable events either in isolation or in combination. Congestion can be generally classified as either recurring or non-recurring. Different foreseeable and unforeseeable types of congestion are: 7 P age
8 o Recurring Congestion Peak period Freight Intersection Freeway corridor Arterial Corridor School related Central Business District Bottleneck or hot spot Railroad crossing Parking related o Non-Recurring Congestion Incident related Special Event Traffic The MOTOR congestion management process will focus on the freeways and major arterial streets including intersections, interchanges, and corridor segments that make up the CMP Network. Efforts to improve traffic conditions in the region will begin on the CMP Network, with MOTOR MPO identifying and prioritizing congested roadways. Identifying the Congested Network In April and May 2013, MOTOR MPO held a series of public workshops to collect public input on various transportation topics: perceived congestion, bicycle and pedestrian travel, transit, safety, trip patterns, and other transportation issues. The workshops were conducted throughout the region with four of eight meetings being held in each of the MOTOR MPO cities. Maps of the regional road network were made available to attendees in order to collect their perceptions of congested locations, safety concerns, and a general consideration of what the participants typical commute involves i.e. regularly travelled corridors for daily commutes and for other purposes. In this exercise, participants were asked to place color-coded stickers on the maps based on the following: accidents, too many vehicles, signal timing or speed limits, driver behavior (distracted or aggressive), road design issues or unavailable gap space and turn lanes, major employers, entertainment, shopping areas, and other. In addition to the working maps, participants were asked to comment in a general manner on travel and traffic related issues. This input, combined with recommendations from MOTOR s Technical Advisory Committee and staff discussions, led to the identification of current and potentially congested corridors across the region, as shown in Figure 2 below. MOTOR MPO intends to continue this coordinated effort. 8 P age

9 Figure 2: Congestion Monitoring Network The data shown below is a summary of public comments received by MOTOR including comments received via the MOTOR website and from the public workshops held in the Spring of In addition, Appendix B is a list of eighty specific public comments. 9 P age
10 10 P age
11 11 P age
12 12 P age
13 13 P age
14 14 P age
15 15 P age
16 16 P age
17 2.2 Performance Measures Developing performance measures to identify, assess, and communicate to others about congestion is a critical element of the CMP. One key to the effectiveness of the CMP is the ability of the MPO staff to adequately assess system performance in order to identify problem areas and communicate this information to the public and decision-makers, thereby affecting future projects. A performance measure is a quantifiable measure to assess how well the MOTOR MPO region is meeting the established congestion management goals and objectives as they apply to the two primary and readily measurable transportation modes mentioned (roads and transit) herein. Performance measures serve as indicators to better understand the usage of a transportation facility or the characteristics of travelers using the transportation system. Performance measures can also be assessed over time to indicate whether congestion management strategies are successful and are producing meaningful and/or desired outcomes. By monitoring performance and the outcomes from implemented improvement strategies, the quality of decision-making in the planning process can be improved and limited financial resources can be expended more effectively. The requirement for on-going assessment of the performance measures leads to the need to identify measures that are quantifiable, without placing a heavy burden on time, cost, or training of MOTOR MPO staff. This CMP establishes a set of performance measures that can be calculated from real world data on an annual basis and that will provide MOTOR MPO with useful information and trends to encourage better transportation investment decisions. Identifying Specific Performance Measures The Federal CMP requirements do not mandate specific performance measures that must be used during the process. Identifying appropriate congestion performance measures is up to each MPO. Although a wide range of performance measures is available, those selected for the MOTOR MPO CMP must be understandable, outcome oriented, and supported by regularly available data. Two specific and measureable performance objectives to be established and monitored by MOTOR MPO are: 1) To reduce traffic delays on network freeways and arterial streets identified as having the most serious travel delays; and 2) To reduce transit travel delays on routes having serious schedule delays. Over time, specific measures will be identified and used. Subsequently, it will be determined if they are successful methods of addressing congestion and if not, funding and scheduling priority amendments will be reconsidered by the MOTOR Policy Board. In addition to addressing the two specific objectives above, the following six performance measurement tools will be used by MOTOR MPO to monitor network congestion. 17 P age

 methodologies Travel Speed - urban streets, using HCM methodologies Figure 3: Level of Service Definition Excellent Free Flow Very low vehicle delay, free traffic flow, signal")
18 Corridor Level of Service Level of Service (LOS) is defined as a qualitative measure from A (best) to F (worst) describing operational conditions within a traffic stream, generally described in terms of speed and travel time, freedom to maneuver, traffic interruptions, driving comfort and convenience, and safety. Figure 3 illustrates the level of service definitions between LOS A and LOS F. Level of Service along a corridor may be based on a number of parameters, including: Volume-to-Capacity ratios from travel demand models Density of on-freeway mainline segments, using Highway Capacity Manual (HCM) methodologies Travel Speed - urban streets, using HCM methodologies Figure 3: Level of Service Definition Excellent Free Flow Very low vehicle delay, free traffic flow, signal progression extremely favorable, most vehicles arrive during given signal phase. Good Good traffic flow, good signal progression, more vehicles stop and experience higher delays than for LOS A. Average Stable traffic flow, fair signal progression, significant number of vehicles stop at signals. Acceptable Noticeable traffic congestion, longer delays and unfavorable signal progression, many vehicles stop at signals. Congested Unstable traffic flow, poor signal progression, significant congestion, traffic near roadway capacity, frequent traffic signal cycle failures. Severely Congested Unacceptable delay, extremely unstable flow, heavy congestion, traffic exceeds roadway capacity, stop-and-go conditions. Severe Congestion 18 P age
19 Volume-to-Capacity Ratios Measuring roadway congestion intensity along a corridor can be accomplished by examining volume-to-capacity (V/C) ratios. This measure is popular because data on existing traffic volumes are relatively easy to obtain and the measures (traffic volumes and roadway capacities) can be projected by the area's travel demand model (TDM). V/C ratio is defined as the ratio of demand flow rate to capacity for a traffic facility. When using the V/C ratio as a performance measure, it is important to use a consistent definition of the concept of "capacity". The "capacity'' of a road can be defined in many ways and for different purposes. Consequently a single road may be described as having different values of capacity, depending upon the context and use being discussed and whether driveways, intersections and other traffic flow impediments exist. The design hour capacity used by an engineer will be different from the capacity of the road under LOS condition E used by a planner, which will be different again from the planning level value associated with LOS C. The capacity value most commonly used in the planning context is that used as an attribute of the road in the regional transportation planning model or the travel demand model. Travel Time Measures Travel time measures focus on the time needed to travel along a selected portion of a highway corridor or arterial street. Common variations of travel time measures include the following: Travel time - the amount of time needed to traverse a corridor segment Travel speed - the length of a segment divided by the travel time Average delay - the difference between travel time and acceptable or free-flow travel time Travel time index- ratio of peak-period to non-peak-period travel time These travel time measures can be used for specific roadway segments, intersections, or corridors. Intersection Delay The amount of delay time for unsignalized and signalized intersections is based on control mechanisms. In general, control delay is the difference between the travel time actually experienced to the travel time experienced under ideal conditions in the absence of traffic control, geometric delay, incidents and other vehicles. At signalized intersections, delay time is defined for the intersection as a whole or individual approaches based on average control delay. Control delay reflects the combined impact of a number of variables including cycle length, deceleration and acceleration delay, stopped delay, and the volume to capacity ratio for the lane group or approach in question. Table 1 below, is shown for illustrative purposes so the reader may better understand 19 P age
20 the relationship between LOS and intersection delay time. Table 1: Signalized Intersection Traffic Flow Characteristics and Average Delays Level of Service Average Delay (Seconds Per Vehicle) A <10 Traffic Flow Characteristics Most vehicles arrive during the green phase and do not stop B >10 - <20 More vehicles stop, causing higher delay C >20 - <35 D >35 - <55 Vehicle stopping is significant, but many still pass through the intersection without stopping Many vehicles stop and the influence of congestion becomes more noticeable E >55 - <80 Very few vehicles pass through without stopping F >80 Source: Highway Capacity Manual (HCM) Considered unacceptable to most drivers. Intersection is not necessarily over capacity, even exceed capacity of lane groups. The following are conditions that affect intersection delay: Traffic Conditions: Approach volumes (left, right, and through movements) Vehicle type Location of bus stops Pedestrian crossing flows Parking movement Roadway Conditions: Number and width of lanes Grades Lane use (Including parking lanes) Signal Conditions: Signal phasing Signal timing Type of control Signal progression 20 P age
21 Crash Measures Crash measures identify if there is a high concentration of crashes at a particular location along a corridor or at a particular turning movement at an intersection or cross street. Crashes certainly impact travel conditions and can be the cause of non-recurring congestion along corridors and intersections. Identifying "hot spot" crash locations and examining the location in the field can assist in identifying potential projects to improve the safety and function of the roadway corridor or intersection. Common improvements could include improving sight distance, adding turn lanes, adding traffic signals, implementing traffic calming devices, etc. Crash measures in the MOTOR MPO area could include the following: Number of crashes along a specified corridor Number of crashes at a particular intersection Type of crashes along a specified corridor Type of crashes at a particular intersection Number of crashes per million vehicle-miles over a section of roadway. There are some constraints to using crash measures to alleviate congestion. For instance, the type of crashes and the way they are recorded make it difficult to measure congestion from reviewing crash data. There may also be reporting inconsistencies in the crash data that is documented by local enforcement agencies. For instance, all crashes are not reported and documented and the exact crash location is not always accurate or even documented. While examining crash data is important in the overall planning process, the inconsistencies within the crash data itself may detract from the usefulness in identifying congested corridors. Transit Travel Condition Measures Transit travel condition measures provide information on the conditions experienced by public transit users. Aspects of transit travel conditions include vehicle ridership vs. load capacity and ontime performance reliability. Thus, transit travel condition measures in the MOTOR MPO area include the following: Transit ridership Transit capacity along congested corridors Transit availability Transit scheduling delays due to congestion Two of the main factors in deciding a mode of travel include the availability and the reliability of transit. Because automobiles provide both availability and reliability, most trips are completed using cars. Examining transit ridership and capacities along congested corridors will assist in identifying potential route extensions and modifications that may encourage more transit "choice" ridership. If 21 P age
22 public transportation is not available along a congested corridor, this may be a potential corridor to review alternatives to improve congestion. 2.3 Selected Performance Measures Based on the performance measure review, and in summary, the measures recommended for consideration in the MOTOR MPO CMP include the following: Level of Service Volume/Capacity ratios Travel Time and Speed Transit Travel Condition Number of crashes Traffic counts 2.4 Monitoring Strategies A key part of effective transportation planning decisions is the use of accurate and viable transportation data. All project planning and programming and subsequent monitoring should be completed using viable and current data. Relevant data allow decision makers to complete a needs assessment and consider project development involving the Metropolitan Transportation Plan (MTP) and/or the Transportation Improvement Program (TIP) as applicable. Prioritization of funding should include review of available data as these relate to the identified specific performance measures in Section 2.2. Measurement of results will follow project implementation. Data collection will be accomplished in cooperation with MOTOR s member agencies and other agencies as required. Some of the funding required for data collection efforts will be through MPO funds; however, much of the traffic count data, LOS measurement, and accident data are provided by MOTOR s member agencies. MOTOR will conduct travel time studies and monitor congestion locations in the MAB; a portion of the transportation data collection will be from public input obtained at public involvement meetings and through other public input. An annual data collection effort is required to measure how effectively the region is managing congestion. An outline of the data collection effort recommended to address each of the performance measures is provided below, along with the agencies responsible data collection. The system-wide effort will be focused on the CMP congested corridors and transit system, as shown in Figure 2 and where appropriate for the particular performance measure. If the Policy Board determines that project funding is not effectively addressing congestion, then priorities will be reexamined. 22 P age
23 Traffic Counts Volume to capacity ratios should be calculated based on the average daily traffic (ADT) on CMP network segments and planning-level capacities as estimated in the regional travel demand model. TXDOT has automatic traffic recorders (ATR) at numerous locations in the MOTOR MPO region. A counter collects the number of vehicles in intervals of 15 minutes and/or one hour per 24-hour period. The data are compiled and processed annually; the database is managed by TXDOT. MOTOR MPO will work with TXDOT in obtaining this data for the required location. This established data collection mechanism ensures that data necessary for the CMP Performance Monitoring is available. Analysis of the collected data will be conducted to coincide with the CMP updates. MOTOR MPO will utilize Geographic Information System (GIS) to analyze the data. To supplement these ATR counts, periodic 24-hour tube counts shall be recorded at the other facilities in coordination with local agencies. This 24-hour count will also help the MPO in establishing the peak hour for each CMP network. Travel Time Travel time studies should be conducted along the CMP corridors during the peak periods and nonpeak periods. Travel time is recommended to be collected once a year, possibly in April or September, to understand the congestion characteristics of the corridor. It is also recommended that travel time is collected at a minimum of three days in a week without any public holidays. Travel time runs should be conducted on Tuesday, Wednesday, and Thursday of the selected week during the following peak hours. The exact peak hour timings will be established though the 24-hour count. 1. AM peak hour 2. Mid-day off-peak hour 3. PM peak hour Numerous methods have been documented and tested for obtaining travel time information to support transportation systems monitoring. In summary, these methods include: Bluetooth-based travel time measurement involves identifying and matching the Median Access Control (MAC) address of Bluetooth-enabled devices carried by motorists as they pass a detector location. The floating car method uses a test car to float in the traffic stream by passing as many vehicles that pass the test car. The follow car method involves using test car drivers who select representative vehicles in the traffic stream in which to follow. The license plate method positions surveyors at the start and end of a test section (roadway segment or corridor). Surveyors record the time when vehicles pass the start and end points including the last few numbers of the license plate of each vehicle passing the observation points. 23 P age
24 The photographic method uses video surveillance equipment to record traffic traveling on a test section. The interview method uses surveyors to ask commuters to record the origin, destination, start time, and end time of their daily trip. Bluetooth-based travel time measurement in the MOTOR MPO region may be available in the future. The floating car method was recommended to collecting data to supplement the Bluetoothbased travel time measurement in the MOTOR MPO region. The follow car method is not recommended as it may result in an inaccurate representation of traffic conditions if the test car follows a vehicle driving much faster or slower than prevailing traffic. The license plate and photographic method are not recommended as it may require specialized equipment. While the interview method can be used to collect a large amount of information, it was not recommended for this study because there is little control over data collection procedures, which may result in unreliable data. The travel time may be collected using a test car to drive from a starting point to an ending point along a designated route. Surveyors in the test cars use Global Positioning System (GPS) units to record the travel times at starting, ending, and intermediate points along the given routes. Number of Crashes The number of crashes is a measure for non-recurring congestion; accidents along the CMP network may result in expected delays and unreliable travel times. Crash data are maintained by the TXDOT for all roadways. Although there tends to be a lag time of one to three years in reporting accident data, the most current accident data should be compiled for all CMP networks. MOTOR MPO will work with TXDOT in obtaining the latest data for the region. MOTOR MPO will utilize GIS and spread sheet calculations to analyze the data and analysis of the collected data will be conducted to coincide with the CMP updates. This data may be used to identify crash hot spots and crash rates for the network. Transit Ridership Transit ridership data are commonly used by transit agencies to measure the effectiveness of transit services. The number of transit trips in the MOTOR MPO region should be monitored on a regular basis. 24 P age
25 2.5 Congestion Mitigation Strategies The CMP is a tool to be utilized in the MOTOR MPO region to address persistent congestion problems and prioritize transportation investments. There are many congestion management strategies and each strategy differs in terms of effectiveness, cost, complexity, and difficulty of implementation. Congestion management strategies are not one size fits all. Rather, congested roadways and intersections have to be properly examined to evaluate which congestion mitigation strategy will effectively improve the congestion related problems. The CMP framework identifies numerous congestion mitigation strategies that can individually or collectively improve the operational efficiency of the MOTOR MPO transportation system. When suitable strategies are implemented, the improvements impact auto, transit, pedestrian, and bicycle usage. The following sections identify several proven congestion management strategies that can be used to mitigate congestion in the MOTOR MPO region. Operations and Management Strategies Enhancing the efficiency of the transportation system can be achieved by implementing traffic operational and management strategies. These strategies can be redesigned to allow more effective management of the supply and use of existing roadway facilities. It can increase effective capacity by optimizing traffic operations without constructing additional general purpose lanes. These strategies are typically low cost, require minimal right-of-way, and can be constructed or implemented quicker than other congestion management strategies. Following are examples of the operations and management strategies. Access Management As defined by FHWA, access management is the proactive management of vehicular access points to land parcels adjacent to all manner of roadways. Thus, access management strategies control the entrance and exit of vehicles on the roadway to remove potential conflict points between vehicles. Access management strategies include the following: Access Spacing: Increasing the distance between traffic signals improves the flow of traffic on major arterials, reduces congestion, and improves air quality for heavily traveled corridors. Driveway Spacing: Driveways spaced further apart improve traffic flow, and reduce merging conflict points along roadways. 25 P age
26 Safe Turning Lanes: Dedicated left and right-turn, indirect left-turns and U-turns, and roundabouts keep through traffic flowing. Median Treatments: Two-way left-turn lanes (TWLTL) and non-traversable, raised medians are examples of some of the most effective means to regulate access and reduce crashes. Right-of-Way Management: Preserving right-of-way for future capacity improvements, sight distance improvements, and other access-related improvements. Transportation Systems Management (TSM) TSM strategies optimize the efficiency of the transportation system by improving vehicle flow. The TSM approach to congestion mitigation seeks to identify operational improvements to enhance the capacity of existing transportation systems. TSM improvements are designed to improve traffic flow and the movement of vehicles and goods, which in turn improves air quality, system accessibility, and safety. TSM strategies may include the following: Highway geometric improvements Traffic signal improvements Way finding and signage improvements Incident Management Strategies These strategies are implemented as responses to roadway incidents, such as crashes that may cause non-recurring congestion. Incident management strategies may include the following: Strategies to improve response times Strategies to reduce clearance time Intelligent Transportation Systems (ITS) ITS strategies use information technology to improve the functionality of the transportation system. ITS strategies may include the following: Ramp metering Traveler information and rerouting systems Electronic commercial vehicle clearance and tolls Bluetooth enabled travel time measurement Permian Basin Regional ITS Architecture: Traffic data gathered through ITS technologies will be used to help mitigate or limit congestion by notifying travelers of congested areas or road conditions or traffic accident information. Knowledge of such data (by the recipient) allows for alternate route decisions or cancellation of unnecessary trips on the multi-modal network. 26 P age
27 2.6 Travel Demand Management Strategies Travel Demand Management (TDM) measures are aimed at affecting travel demand by reducing the need for travel, increasing vehicle occupancy or the use of alternative modes, or shifting the timing of trips to periods outside of the peak travel times. TDM strategies can improve system performance by reducing and/or re-distributing the demand for single occupancy vehicle (SOV) travel. TDM measures are typically targeted to influence peak travel times by reducing either the number of total work trips or the number of SOV work trips taken during the most congested travel period. Thus, TDM strategies may be a catalyst to increase the efficiency of the transportation system by promoting alternative travel modes, such as ridesharing, vanpooling, transit, bicycling, and walking. Increasing Rideshare Rideshare strategies encourage carpooling and vanpooling. Typically, ridesharing has minimal costs because it makes use of empty vehicle seats, and it is most suitable for work commute trips. Increasing rideshare strategies include the following: Initiating and managing a Rideshare Program Constructing park-and-ride facilities Connecting public transportation routes to park-and-ride facilities Constructing High Occupancy Vehicle (HOV) lanes Alternative Work Time These strategies try to reduce the number of commuters traveling at peak morning and afternoon periods. Educating and supporting local businesses is essential when identifying alternative work strategies. Alternative work strategies include the following: Flexible work hours Telecommuting Satellite offices For these strategies to effectively work, MOTOR MPO will need support from government agencies and the local business community. Alternative Commute Mode These strategies encourage the use of public transportation, bicycling, or walking as a commute mode. Thus, these strategies can address congestion by reducing the number of vehicle trips. Specific measures include the following: Bicycle paths or lanes Sidewalks Pedestrian signals 27 P age
28 Bicycle racks These measures may be applied at the facility or at corridor levels. In addition to physical improvements, these strategies may include policy-oriented measures, such as a requirement that new or reconstructed roads include sidewalks. 2.7 Land Use Planning Strategy Managing growth directly impacts how the transportation system operates and it also influences how commuters select their travel mode. Typically, SOV travel is used when densities are low, land uses are separated, and when transit services, bicycle facilities, and pedestrian accommodations are inadequate. Integrating land use planning and transportation planning is essential to effectively managing growth and mitigating congestion. This can be accomplished through the following tools. Zoning Land use allocation Urban design techniques that integrate land use planning, site planning, and landscaping with the transportation system 2.8 Physical Roadway Capacity Strategies Federal regulations state that any project proposing an increase in single occupancy vehicular capacity should show that congestion management strategies have been considered. Thus, if the above mentioned strategies do not adequately mitigate congestion, then physical roadway capacity strategies should be carefully reviewed. Increasing roadway capacity is a common strategy for addressing recurring delay. Roadway capacity increases may be needed along congested corridors for several reasons including bottleneck removal, safety improvements, economic development, and other reasons. However, increased roadway capacity is typically ineffective in addressing nonrecurring congestion. Physical roadway capacity strategies include constructing the following improvements to mitigate congestion. Intersection turn lanes Roundabout intersections Acceleration/deceleration lanes Grade-separated railroad crossings Grade-separated intersections New location roadways 28 P age
29 2.9 Congestion Management Process Toolbox The congestion mitigation strategies identified in this report provide effective ways to mitigate different types of congestion. Each congested facility on the MOTOR MPO CMP network will be evaluated to identify particular strategies that have the potential for mitigating congestion. To assist in identifying strategies to mitigate congestion an operational and policy matrix may be developed during the development of the CMP. These matrices may show how each strategy can assist in mitigating different types of recurring and non-recurring congestion. All the different strategies will be graded based on the effectiveness of reducing congestion and the associated cost to implement. The congestion mitigation strategies identified in the operation and policy matrices can provide effective ways to mitigate different types of congestion. The matrices can be used to identify viable CMP projects. The operation and policy matrices may be used during the development of any transportation planning study in the region. While all congestion mitigation strategies identified may not be appropriate to implement now in the MOTOR MPO region, it is important to note that as the region grows, new and expanded strategies will need to be identified and evaluated Programming of Projects and Implementation Strategies An annual CMP Performance Report should provide a summary of the projects within the CMP network that have been selected for funding in the Transportation Improvement Program (TIP), including documentation of CMP consistency. For the CMP projects that have been implemented within the fiscal year, the before and after data collection and performance measures should be documented in the CMP report. Over time, the database or project types and before and after performance measures will allow the MPO to identify the types of projects that are most effective at relieving congestion and improving mobility. This process is part of the monitoring of the CMP to determine the effectiveness of transportation planning, funding, and project construction over time. Additionally, the CMP performance report will document all local agency projects that have been implemented on CMP network, although before and after data collection and performance measures may not be available for these projects. 29 P age
30 3.0 NEXT STEPS The CMP is a dynamic document which will be updated as data is obtained and evaluated. MOTOR MPO will develop an Action Plan that outlines specific objectives and actions to be undertaken to achieve the stated goals and objectives in the CMP. An annual Performance Report will be developed after the close of each fiscal year to report on the status of the Action Plan. This in turn will help identify appropriate revisions to the CMP to ensure congestion management is an ongoing process and may include various elements such as new objectives, performance measures, the congestion network, strategies for mitigating congestion, etc. Amendments to the CMP will be completed after appropriate public review and comment. Public-Defined Areas of Congestion Appendix A During the public participation workshops held in the Spring of 2013, participants were asked to identify the areas that they felt were congested in the region. The participants were provided with different colored stickers and were asked to place them on segments on roadways they felt were congested. The sticker color represented different causes of congestions as follows: accidents; too many vehicles; signal timing or speed limits; driver behavior (distracted or aggressive); construction areas; road design or turn lanes; major employers, entertainment, shopping areas; other/unsure. In addition to the public comments written at public meetings, the TAC has also identified intersections and roadway segments that are included in the congestion management network, shown in Figure 2, page 9. Specific comments made by interested members of the public as well as stakeholders are shown below in Appendix B. Transit-Defined Areas of Congestion The MPO will reach out to the public transit provider and other transit providers to assist with further development of the congestion network. TxDOT-Defined Areas of Congestion None of the corridor and intersection congestion areas identified in the MOTOR MPO network are among the top 100 Texas congestion areas at this time. Potential Congested Corridors MOTOR MPO staff and member agencies will identify potentially congested corridors and include these within the study. 30 P age
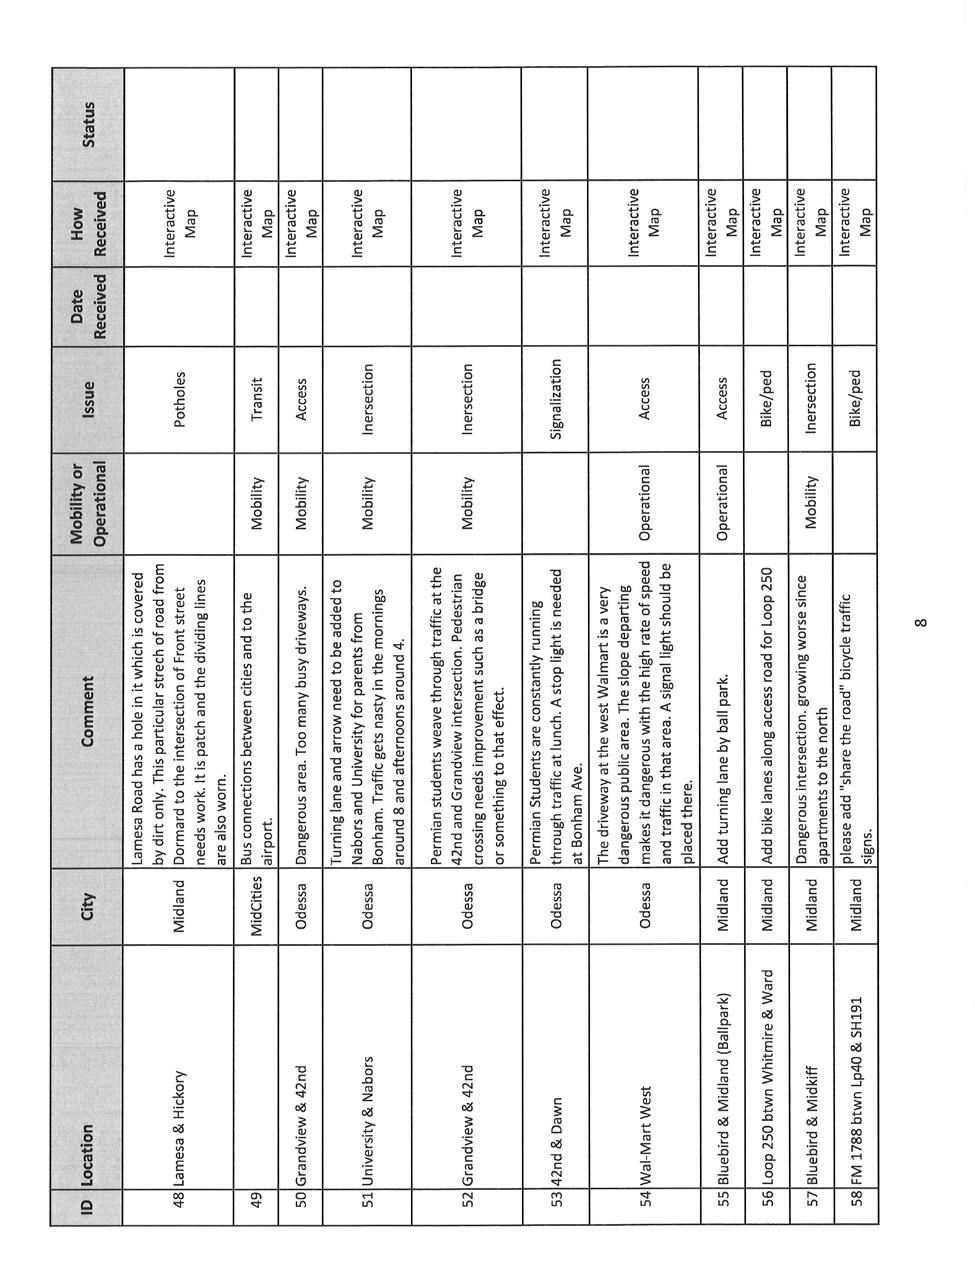
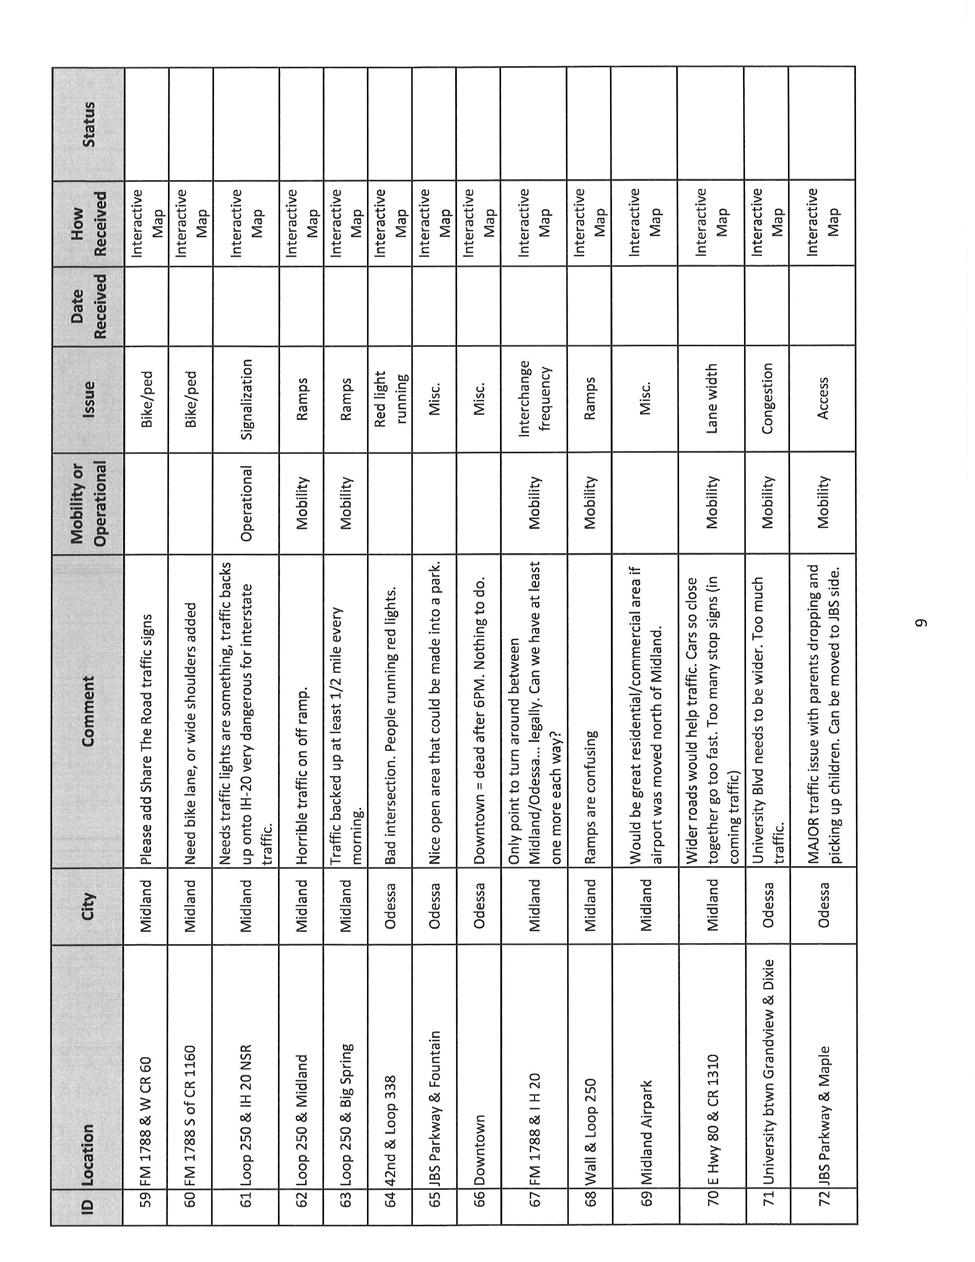
31 Appendix B Public Comments & Issues 31 P age
32 32 P age
33 33 P age
34 34 P age
35 35 P age
36 36 P age
37 37 P age
38 38 P age
39 39 P age
40 40 P age
41 41 P age