2019 LEGISLATIVE AND POLICY AGENDA
|
|
|
- Geoffrey Garrison
- 5 years ago
- Views:
Transcription
1
2


 Metrorail and the")


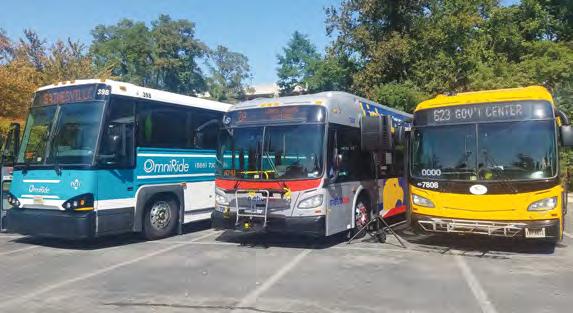
3 2019 LEGISLATIVE AND POLICY AGENDA Northern Virginia s economic growth and global competitiveness are directly tied to the region s transit network. With nearly 60 percent of jobs within a quarter-mile of a rail station or bus stop, Northern Virginia is among the nation s most transitaccessible areas. High-quality transit not only brings economic benefits to Northern Virginia but to the entire Commonwealth. The high-capacity service offered by the Washington Metropolitan Area Transit Authority s (WMATA) Metrorail and the Virginia Railway Express (VRE) provides more than $600 million per year to the Commonwealth of Virginia in sales and income tax revenues 1. This reflects a more than 250 percent return on investment to the Commonwealth for its support of these transit systems. Each work day, 550,000 Northern Virginians commute via transit, saving the region 35.5 million hours of congestion-related traffic delays annually. VRE riders, nearly 19,000 daily, take the equivalent of two lanes of traffic one each on I-66 and I-95 off the highways during rush hour. With six bus systems extending from Loudoun County to the City of Alexandria and commuter- and fixed-rail systems, Northern Virginia continues to explore ways to better connect businesses, residents and visitors. Transit Systems that Serve NVTC s Communities State Legislative Priorities: Identify Future Revenues to Address Statewide Transit Capital Shortfall Restore Regional Transportation Revenues Preserve the Dedicated Funding for WMATA and VRE Federal Legislative Priorities: Reauthorize Federal Funding for WMATA Ensure Labor Arbitration Commitments Reflect Budget Realities Incorporate Transit in a Federal Infrastructure Package Reauthorize the Federal Transit Program and Fully Fund the Mass Transit Account Continue the Commitment to Commuter Tax Benefits 1 NVTC, The Value of Metrorail and the Virginia Railway Express to the Commonwealth of Virginia, September

4 STATE LEGISLATIVE PROGRAM 1. Identify Future Revenues to Address Statewide Transit Capital Shortfall NVTC supports a statewide solution to stem the future loss in revenues that fund transit capital statewide. An urgent and immediate threat to transit systems across the state will begin when the Commonwealth Transportation Board allocates the last revenues received from the 2007 Transportation Capital Project Revenue Bonds. These bond proceeds have been a key element in Virginia s funding for transit capital, representing 40 percent of the available revenue for transit capital investments across the state. This loss of funding will be disastrous for Northern Virginia transit providers, affecting the reliability and service performance of our transit systems. With less state financial support, funding for transit will need to compete with core local services. The loss of state funds will affect all transit providers in Northern Virginia, including the six local bus systems and VRE commuter rail. The transit shortfall will affect systems throughout the Commonwealth. More than 41 transit agencies across the state rely on these funds to maintain safe and reliable transit operations. In areas with limited local resources, a loss of more than 20 percent in state transit capital funding will be devastating. This year, NVTC will work with fellow stakeholders to identify options for long-term, sustainable funding for the Commonwealth s transportation needs. These are imperative if we are to avoid the collapse of Virginia s transit capital program and, with it, transit operations. 2. Restore Regional Transportation Revenues NVTC supports efforts in the future to restore regional (70%) revenues and local (30%) distribution revenues available to the Northern Virginia Transportation Authority (NVTA) repealed as a result of HB 1539/SB 856 (2018). NVTA is the entity in Northern Virginia responsible for allocating regional revenues for transportation projects including transit projects - that reduce congestion. Due to the loss of 70% revenue funds, several regional transit projects or projects that increase improve access to transit received partial or no funding in NVTA s FY Six Year Program, including the City of Alexandria s West End Transitway, Fairfax County s Frontier Drive Extension, and Arlington County s Ballston Metrorail Station West Entrance and improvements to the Crystal City Metro Station. In addition, NVTC jurisdictions saw a marked reduction in their 30% revenues, which, in many cases, support transit operations. NVTC supports restoration of these funds as they are instrumental for multimodal regional and local transportation projects across Northern Virginia. 3. Preserve the Dedicated Funding for WMATA and VRE Internet Sales Revenue for Transit? A critical factor this session could be changes in tax law and how Virginia could collect taxes on internet sales after the US Supreme Court s decision in the Wayfair case. In 2013, the General Assembly had explicitly earmarked funds stemming from the passage of any federal Marketplace Fairness Act for transportation and transit. While that is not what has happened, if the spirit of the intent remains, a portion of the new funds coming to Virginia should still be dedicated to transportation, including statewide transit capital. WMATA: In 2018, the General Assembly, the Governor and the Northern Virginia region collaborated on a dedicated funding and reform package to ensure that WMATA s transit service would continue to serve as the backbone of the Washington, D.C. region s transportation network. All three jurisdictions Virginia, Maryland and the District of Columbia were able to dedicate the revenues that WMATA identified as essential for it to begin chipping away at decades of the aging system s unfunded capital needs. NVTC, in its expanded oversight
5 Proposed NVTC 2019 Federal and State Legislative and Policy Agenda role, will continue to work with its local jurisdictions, the Governor and the General Assembly as funds become available to ensure strong stewardship, appropriate oversight, annual reporting, and future cost-saving strategies. VRE: A second, critical part of the 2018 transit funding bill was regional dedicated funding for VRE. A new fund, the Commuter Rail Operating and Capital Fund (C-ROC), was created and $15 million dollars annually will be deposited into the Fund from the new floor on the regional gas tax. The C-ROC was modeled after Virginia s Intercity Passenger Rail Operating and Capital fund (IPROC) and designed to meet the financial needs that VRE identified in its long-term financial plan. In creating the C-ROC and dedicating funds, the legislature acknowledged that VRE is a critical piece of the Northern Virginia transportation system FEDERAL LEGISLATIVE PROGRAM Facilitating efficient surface transportation, including public transportation, has long been recognized as a federal responsibility and is critical to U.S. global economic competitiveness. According to the American Public Transportation Association, 87 percent of the 35 million public transportation trips taken each day directly impacts the U.S. economy because Americans ride public transit to work or spend money at retail businesses and entertainment venues. In Northern Virginia, federal funding for public transportation supports capital investments in WMATA and VRE, as do allocations made by the Commonwealth and local jurisdictions. Also, the tax benefits provided to large employers most notably the federal government play a key role in supporting commuters who utilize transit, which benefits all the transit providers in our region. 1. Reauthorize Dedicated Federal Funding for WMATA NVTC strongly supports continued dedicated federal funding of WMATA, to support critical safety and state of good repair projects, that matches or exceeds the current 10-year commitment under the Passenger Rail Investment and Improvement Act of 2008 (PRIIA). WMATA is critical to the federal government. More than half of Metrorail stations serve federal facilities and approximately 40 percent of morning peak-period customers are federal employees. Further, WMATA enables special events in the Washington metropolitan region, such as festivals, sporting events, and inaugurations. Metrorail also allows for the evacuation of more than 120,000 people per hour during an emergency. In 2008, Congress authorized a total of $1.5 billion over 10 years to WMATA under PRIIA, leveraged by an equal match of funds from Virginia, Maryland and the District of Columbia. These funds have been crucial in supporting the major maintenance and capital rehabilitation activities that were necessary to restore the safety and reliability of the aging transit system. 2. Ensure Labor Arbitration Commitments Reflect Budget Realities To control costs at WMATA, NVTC endorses an amendment to the federal Wolf Act (National Capital Area Interest Arbitration Standards Act of 1995, Pub L ) to require arbitrators in WMATA contract mediations to consider fiscal restrictions, such as the three percent cap in growth of annual operating subsidies, in all cases. Currently, the Wolf Act permits but does not mandate arbitration awards based upon financial condition. 3
6 Strengthening this language would allow management to keep labor costs aligned with the financial condition of the transit agency and its funding jurisdictions. 3. Incorporate Transit in Federal Infrastructure Package Since 2017, the President and Congress have discussed a $1 trillion package to restore and renew infrastructure across the nation. Should Congress take up consideration of an infrastructure package, NVTC supports a strong transit component. 4. Reauthorize the Federal Transit Program and Fully Fund the Mass Transit Account The Fixing America s Surface Transportation (FAST) Act of 2015 provides $61.1 billion over five fiscal years for programs administered by the Federal Transit Administration (FTA) and is authorized through NVTC supports Congressional reauthorization of the FAST Act in a timely manner to provide certainty and stability of federal funds to transit agencies in Northern Virginia, including WMATA and VRE. The law, which will expire at the end of FY2020, currently authorizes up to $12.6 billion nationwide per year for federal transit programs. It funds important transit programs that are used by systems in Northern Virginia, including Urbanized Area Formula Grants, grants for the Enhanced Mobility of Seniors & Individuals with Disabilities, Bus and Bus Facilities Grants Program, discretionary grant programs, and State of Good Repair Formula Grants. It also authorizes the Capital Investment Grants program, which supports new major transit expansion activities such as future bus rapid transit routes within Northern Virginia. The legislation also authorizes the Transportation Infrastructure Finance and Innovation Act (TIFIA) and the Railroad Rehabilitation and Improvement Financing programs, as well as the multimodal Surface Transportation Program (STP) and Congestion Mitigation and Air Quality Program (CMAQ), all used on programs and projects currently active in Northern Virginia. Close to 80 percent of the FTA s funds comes from the Mass Transit Account of the Highway Trust Fund, with resources derived primarily from federal gas tax revenues. Congress has not increased the federal gas tax since 1993, leading to a projected shortfall of the Highway Trust Fund (HTF) in the coming years. As solvency of the HTF is critical to funding a federal transportation authorization bill, NVTC supports Congressional efforts to address the long-term sustainability of the HTF. 5. Continue Commitment to Commuter Tax Benefits Nearly 90 percent of VRE passengers and 65 percent of Metro s Virginia riders rely on the commuter tax benefit, the tax relief program that was restored in 2015 to serve employees of federal agencies and private sector companies across the country. NVTC supports continuation of transit commuter benefits that are on par with the tax incentive provided for parking. Commuter tax benefits make transit service more attractive to commuters who currently drive alone. Further, NVTC encourages federal programs that support the use of carpools, vanpools, rideshare, bike share, and transportation demand management (TDM) as effective tools to eliminate traffic congestion. 4
7 DRAFT 2019 Legislative Agenda With six individual jurisdictions coming together to speak as one voice under the name of the Potomac and Rappahannock Transportation Commission, it is critical to outline key policy-level priorities state and federal initiatives. Virginia DRPT Performance Measurement Program PRTC supports performance measurements to provide accountability and support for highperforming transit systems; however, OmniRide is unique in the Commonwealth in that the vast majority of services are commuter-based with longer-distance travel in one of the most congested areas of the United States Performance measurements that do not have a standard for congestion mitigation or throughput is inconsistent with the policy goals outlined under the Commonwealth s proudest accomplishments, specifically the I-95/395/495 HOT lanes and the Transform I-66 Project. A $435K +/- loss is expected in FY2020 (begins July 1, 2019). Action: Amend HB 1539/SB 856 (2018): Allow DRPT additional time to develop a performance measurement program with defined policy outcomes that match defined program concerns (i.e., congestion mitigation, throughput, timely expenditures of allocated capital funds) and allow for new statewide data collection/reporting. Allow all transit systems the opportunity to conduct the state mandated strategic planning process and adjust to the new performance measurement system before taking revenues. Encourage reconsideration of immediate zero-sum approach to resource allocation; require phased implementation with transitional assistance so local communities have time to choose to eliminate services or add resources. Future Revenues to Address the Virginia Transit Capital Shortfall PRTC supports a statewide-approach to resolving the loss of revenues that fund transit capital projects. This becomes a critical issue when the Commonwealth Transportation Board (CTB) allocates the last revenues received from the 2007 Transportation Capital Project Revenue Bonds, which make up almost 40% of funds for transit capital investments across Virginia. The loss of state funds will directly impact OmniRide, who is particularly reliant on state funds because the vast majority of regional federal capital funds (98%) flows directly to WMATA/VRE.

8 Action: PRTC will work closely with fellow stakeholders to identify options for long-term, sustainable funding for the Commonwealth s transportation needs. These are imperative if we are to avoid the collapse of Virginia s transit capital and operational programs. Continue to communicate the impact of the very small amount of federal transit capital funds that flow into the PRTC jurisdictions and the impact of state funds to maintain high reliability of transit in one of the most highly congested areas in the entire United States. High Occupancy Toll Lane (HOT Lane) Loss of Revenues As outlined jointly by PRTC & NVTC in December 2015, PRTC lost federal funds when a new FTA policy no longer gave credit to transit systems operating on High Occupancy Toll (HOT) lanes, only High Occupancy Vehicle (HOV) lanes. Real Impact, Right Now: OmniRide felt a $265K loss in federal funds this year, with over $1M lost over the next five years on I-95 alone. Real Impact, 2022: As I-66 is converted from HOV lanes to HOT lanes, OmniRide will see another loss of $615K in annual federal credits that are used for supporting capital needs. Action: PRTC and NVTC will jointly evaluate the federal policy climate to determine if seeking a policy reversal is appropriate. When considering the future impacts of funding losses forthcoming on I-66, this may be the time to pursue the ability to earn revenues for operating high intensity motorbus services in these congested corridors. Things to Watch NVTA Revenues: Restoring NVTA revenues for continued funding/implementation of multimodal projects (including transit) that support the regional economy and reduce congestion. This will subsequently help transit in all of its forms. Restored NVTA revenues will support new and expanded capacity for all transportation projects (including transit) through the 70% revenues as well as operational costs through the 30% local funds. Likewise, this will benefit the transit environment. Internet Sales Revenue for Transit: A critical factor this session could be changes in tax law and how Virginia could collect taxes on internet sales after the US Supreme Court s decision in the Wayfair case. In 2013, the General Assembly had explicitly earmarked funds stemming from the passage of any federal Marketplace Fairness Act for transportation and transit. While that is not what has happened, if the spirit of the intent remains, a portion of the new funds coming to Virginia should still be dedicated to transportation, including statewide transit capital. DRAFT 2019 Legislative Agenda

9 Contacts Bob Schneider Executive Director m o Hon. Ruth Anderson Board Chair o Jeff Gore & Stan Tretiak, State Legislative Consultants o
10 2019 STATE LEGISLATIVE ISSUES COMMUTER RAIL OPERATING AND CAPITAL (C-ROC) FUND/DEDICATED FUNDING The creation of the C-ROC fund and annual $15 million allocation of regional gas tax revenue was a clear acknowledgement of the critical role VRE plays in the regional transportation system and is an important first step in securing long term, dependable funding to maintain and increase commuter rail service. Staff is conducting an in-depth financial analysis that will inform how much additional funding is needed for VRE s financial security and which capital projects would best be considered for C-ROC funding in VRE s Capital Improvement Program. Action: Communicate to key legislators, administration officials, and staff members our appreciation for the creation and funding of C-ROC along with explaining how C-ROC funding is likely to be used in the short term based on the financial analysis. Defend against any attempts to decrease the $15 million annually allocated to C-ROC. FUTURE TRANSPORTATION FUNDING The Commonwealth s Transit Capital Funding Program is facing a 40 percent decrease in revenues leaving an unfunded need of more than $130 million annually in transit capital funding according to the Transit Capital Projects Revenue Advisory Board s recent report to the General Assembly. VRE relies on the Transit Capital Funding Program to match Federal funding for state-of-good-repair and expansion projects. VRE has developed a Financial Plan for implementation of its System Plan 2040 that identifies future capital and operating requirements needed to implement the plan. A key finding in the Financial Plan is the need for increased funding, even without any major expansion of service. VRE has developed a Financial Plan for implementation of its System Plan 2040, which is currently being updated, that identifies future capital and operating requirements needed to implement the plan. A key finding in the Financial Plan is the future need for increased funding, beyond the new $15M in C- ROC, especially for any major expansion of service. Action: VRE will join other transit providers and stakeholders in seeking future sustainable funding sources to shore up the Commonwealth s Transit Capital Funding Program. Stress the necessity that the General Assembly identify and secure long-term, dependable, state-wide funding sources for future commuter rail operating and capital costs. Advocate for the creation of an informal working group of House Appropriations and Senate Finance staff to investigate possible revenue sources for future additional dedicated commuter rail funding. VRE Contacts Doug Allen CEO, , dallen@vre.org Joe Swartz Chief of Staff, jswartz@vre.org Aimee Perron-Seibert State Legislative Consultant, aimee@commonwealthstrategy.net 1500 King Street, Suite 202, Alexandria, VA 22314;

11 LONG BRIDGE CORRIDOR PROJECT The expansion of the Long Bridge is critical not just to VRE s future, but to the long-term operation of freight and intercity passenger rail along the East Coast. VRE is working closely with other stakeholders including CSX, DRPT, DDOT, and federal agencies on this project. Preliminary design and environmental work on the Long Bridge Corridor project is nearing completion and work on final design, which is already partially funded, will soon begin. Federal funding for the construction phase of the project will be an essential component of a complete funding package. It is critical for stakeholders to formulate a management and funding plan for the construction and operation of an expanded Long Bridge corridor as part of any request for federal funding. Action: Support and participate in the coalition of public and private stakeholders in the formulation of a management and funding plan for the expanded Long Bridge corridor.
 serves as a regional forum for discussion and analysis of transit")


12 2300 Wilson Boulevard Suite 620 Arlington, VA Tel (703) Fax (703) Role in the Region The Northern Virginia Transportation Commission (NVTC) serves as a regional forum for discussion and analysis of transit issues that are critically important to Northern Virginia s economy and quality of life. NVTC s efforts include: Funding and stewardship of Metro and Virginia Railway Express Managing state and regional funding for six bus systems Working across jurisdictional boundaries to coordinate transit service Administering the Commuter Choice program Directing efforts for new fare box technologies Analyzing regional transit ridership to identify trends and opportunities Providing Northern Virginia focused transit research and technical expertise Statutory Requirements NVTC was established to manage and control the functions, affairs, and property of the Northern Virginia Transportation District by the 1964 Acts of Assembly of the Commonwealth of Virginia, Chapter 630, and the Transportation District Act. The purpose of the Act is to facilitate planning and developing a transportation system for Northern Virginia and for the safety, comfort and convenience of its citizens and for the economical utilization of public funds. The duties and powers of the commission are set in Sections through of the Virginia Code. NVTC administers the regional motor vehicle fuels tax, Section , which provides dedicated capital and operating funds for WMATA. Commission Membership WMATA Funding & Oversight NVTC enjoys a special relationship with the Washington Metropolitan Area Transit Authority (WMATA), as it is charged with the funding and stewardship of Metro. NVTC serves as Virginia s voice on the WMATA Board of Directors through its appointments to the panel, which determines agency policy and provides oversight for funding, operations, and transit facility expansion. Virginia s 2018 transit omnibus legislation expands NVTC s role and relationship with WMATA by adding new responsibilities. Oversight responsibilities require that NVTC certify receipt of certain documents and reports from WMATA. Reporting responsibilities require that NVTC provide an annual report to the Governor and General Assembly on the performance and condition of WMATA. The bill also directs NVTC to share strategies that WMATA can use to reduce costs and make its operations more efficient. Transit Systems Serving NVTC Jurisdictions


13 Programs and Initiatives FINANCIAL MANAGEMENT NVTC manages about $250 million annually in state transit assistance for WMATA, VRE and five bus systems. In addition, NVTC administers the regional motor vehicles fuel tax, totaling $35.6 million in fiscal year 2018, to support WMATA operating and capital needs. NVTC awards around $10 million each year to multimodal projects through its Commuter Choice program. NVTC also manages and conducts compliance reviews of federal transit grant funds on behalf of several Northern Virginia jurisdictions. FINANCIAL & POLICY ANALYSIS Sustained federal, state and local funding is essential for highquality, high-capacity transit to flourish in Northern Virginia. To ensure such funding, NVTC performs financial analyses of transit projects, documents transportation funding needs, and works with the commonwealth to develop new funding sources. NVTC also analyzes policy options and serves on the state s Transit Service Delivery Advisory Committee (TSDAC). FARE COLLECTION TECHNOLOGY NVTC works with local transit agencies and regional partners to maintain an operational, costeffective, regional fare-collection system that meets current and future needs. NVTC is coordinating regional upgrades to extend the useful life of the existing fare collection program (SmarTrip ) and analyzing future regional fare collection needs and options. COMMUTER CHOICE To move more people more efficiently and reliably through both the I-66 (inside the Beltway) and I- 395/I-95 corridors, NVTC funds various transit and roadway enhancement projects. The Commuter Choice program supports projects that move more people, increase opportunities to connect from one mode of travel to another, improve transit service, reduce roadway congestion, and increase travel options. Tolls provide the revenue necessary to fund new projects well into the future. These projects are specifically designed to benefit toll payers. ENVISION ROUTE 7 BRT NVTC manages Envision Route 7, an initiative to deploy financially sustainable new transit along Route 7 between Alexandria and Tysons. NVTC has recommended bus rapid transit (BRT), which is expected to attract 9,500 new daily transit riders to Route 7. BRT is proposed to run 11 miles between the Spring Hill Metrorail station and the Mark Center, with a connection to the East Falls Church Metrorail station. NVTC is engaged in a conceptual engineering study as the next step toward providing faster and more reliable service. RESEARCH & DATA ANALYSIS NVTC performs cutting-edge research and data analysis to inform policy and budgetary decisions and transit service planning. Many of its reports, such as the economic value of rail transit to Virginia, are widely cited. NVTC s adaptation of a transit planning tool, known as TBEST, allows staff to estimate transit demand for its member jurisdictions and bus systems. REGIONAL BUS AGENDA To ensure access to safe, efficient, quality bus service throughout Northern Virginia, NVTC identifies opportunities for enhanced or new service that often transcend jurisdictional boundaries in order to connect communities. Using GIS, NVTC develops tools to help localities plan, create and implement innovative regional bus investment strategies. REGIONAL TRANSIT RESPONSE COORDINATION NVTC serves as a convening body for regional transit responses to Metrorail station closures and other service disruptions. During Safe- Track, NVTC facilitated the movement of people from Metrorail to alternatives, such as bus and VRE, during track closures. It currently is coordinating Northern Virginia s response to the planned closure of six Metrorail stations south of National Airport in summer 2019 for platform repairs. NVTC also supports periodic updates to stationspecific plans to ensure the safe evacuation of Virginia s 25 Metrorail stations in an emergency. NVTC Factsheet Fall 2018


14 Transit Matters How Transit Helped Northern Virginia Land Amazon A cornerstone of Northern Virginia s successful bid for Amazon s second headquarters was the emphasis on existing public transportation as well as a promise of additional transit investment. National Landing, which encompasses parts of Crystal City in Arlington County and the City of Alexandria, is served by commuter and heavy rail, bus rapid transit, local and commuter buses and bike share. Transportation and mobility were among Amazon s key criteria for a new headquarters and Northern Virginia checked the boxes: direct access to mass transit, an international airport no more than 45 minutes away, and major highways or arteries within a few miles. Transportation officials in Northern Virginia expect that most of Amazon s employees will utilize public transit, walk, bike, or carpool on their commutes each day. The reason is two-fold. In Seattle, Amazon employees transit costs are fully covered by company-subsidized passes. In the Commonwealth of Virginia, a review of available transportation services and facilities indicates that regional and local transit systems have significant unused capacity, even during peak travel periods.
15 E x i s t i n g T r a n s i t i n N a t i o n a l L a n d i n g N Map created from various sources by the Northern Virginia Transportation Commission. (December 2018) The framework for a future world-class transit network is in place and pledged improvements will bring the region closer to that goal. Virginia, Arlington and Alexandria together will spend more than $760 million, much of it on existing projects, to support the influx of 25,000 jobs to National Landing. The projects include an additional entrance to the Crystal City Metro station and a second entrance to the planned Potomac Yard station on Metro s Yellow and Blue lines between the Braddock Road and Ronald Reagan National Airport stations. A pedestrian bridge from the airport to Crystal City and the expansion of Metroway, the region s only bus rapid transit system, are among other improvements.

")


 524-3322 facebook.")
16 E c o n o m i c V a l u e o f M e t r o r a i l a n d V i r g i n i a R a i l w ay E x p r e s s Long credited with fueling economic development in Northern Virginia, Metrorail and Virginia Railway Express (VRE) also provide financial benefits to the state, according to a NVTC study. The additional 85,000 households and 130,500 jobs that the two rail systems make possible in Northern Virginia generate over $600 million each year in sales and income tax revenues. Download the full report here. Published: December Wilson Boulevard, Suite 620 Arlington, VA (703) facebook.com/novatransit twitter.com/novatransit


 and 2040 (projected population 559,000) Now Express Lanes construction is under way on I-66.")
17 GET TO KNOW OMNIRIDE OUR SERVICE OmniRide is the service name of the Potomac and Rappahannock Transportation Commission. PRTC s governing body oversees its transportation services and funding. OmniRide includes local and express bus routes, vanpools, and ride-matching services for Prince William County, Manassas and Manassas Park. Key destinations for OmniRide include the Pentagon, Washington, D.C., and Tysons, with connections to Virginia Railway Express (VRE) and WMATA Metrorail stations. Local service offers connectivity in the urban areas of Manassas, Manassas Park, and eastern Prince William County; the ability to move across the county; and easy access to VDOT s regional Park & Ride locations. PRTC also co-sponsors VRE in partnership with the Northern Virginia Transportation Commission (NVTC). The VRE provides commuter rail service along the Fredericksburg and Manassas Lines, connecting to transit providers at stations in Virginia and the District of Columbia. OUR FOCUS Northern Virginia roadways already are overwhelmed by singleoccupant vehicles, and gridlock will get even worse as our population increases. Express and HOT Lanes on I-95 and I-395 have helped make vehicle trips in that corridor more reliable, but commuters and those whose businesses rely on moving goods through our region still face long delays under the best of conditions. 39% The expected population growth in Prince William County between 2010 (population 402,000) and 2040 (projected population 559,000) Now Express Lanes construction is under way on I-66. These lanes Source: Prince William County website and the toll money they generate will help to create a new culture of commuting in Gainesville, Haymarket and areas further west. They will encourage carpools, vanpools, slugging and mass transit, but we will never be able to add enough lanes, and the tolls will never be low enough to satisfy drivers. The solution is to increase throughput getting more people through the same number of lanes by increasing the number of people in each vehicle.


18 OUR INITIATIVES OmniRide has several new commuting options coming online in 2019 to increase throughput on area roads. These initiatives would not have been possible without the assistance of NVTC, VDOT, VDRPT and the action of the Virginia General Assembly in 2018 to pass a regional gas tax floor. The new initiatives are: Haymarket Rosslyn/Ballston OmniRide Express service. This new route started on December 17, 2018, providing residents of western Prince William with direct bus service to Arlington for the first time. Flexible Vanpooling Coming in spring commuters, even those not registered with a vanpool, will use an app to find a vanpool with space for a one-time ride. This will enable regular vanpoolers to switch vans as needed and encourage others to try vanpooling. On-demand shuttles Coming in summer residents of Gainesville and Haymarket will use an app to summon a free on-demand shuttle to nearby commuter lots where they can connect with transit, carpools or vanpools. In addition, OmniRide will break ground on a new maintenance facility near I-66 and Balls Ford Road in Manassas on January 23, The facility is vital to adequately maintain OmniRide s bus fleet, provide parking for new buses and reduce operational costs as the level of bus services in the I-66 corridor expands. OUR PROMISE OmniRide will offer reliable and affordable transit options to meet the needs of individuals and will provide residents and employers with information and support on the best ways to travel around and beyond the Prince William area. Bob Schneider Executive Director bschneider@omniride.com OmniRide.com

19 What s New One of the first tasks that resulted from our Commission s approval of our strategic plan was to rebrand and refresh the look of the agency. We knew G E T T H E R E S M A R T E R 2018 Facts & Figures that our OmniRide brand had high name recognition, but many in the community were confused by all our various service names. The services were rebranded under the OmniRide umbrella, the PRTC logo and dated teal agency color were retired, and the service logo got a refreshed two-tone treatment. OMNIRIDE G E T T H E R E S M A R T E R Our buses got a new look too Our Impact In 2018, OmniRide removed nearly 17,000 car trips from regional roadways every day: +2.4 million customer trips across almost 3 million revenue miles Over 670 active vanpools in the Vanpool Alliance, with more than 1.7 million vanpool & carpool riders More than three dozen area employers worked with us to expand commuting options for their employees $36M annual operating budget with a capital projects budget of $6-12M annually depending on program needs 159 Buses: 99 long-haul commuter-style and 60 transit buses of 30, 35 & 40 lengths


20 Our Members Stafford County, Spotsylvania County and the City of Fredericksburg only sponsor VRE. Prince William County and the Cities of Manassas and Manassas Park sponsor both OmniRide bus services and VRE. PRTC member jurisdictions are eligible to collect a 2.1% motor fuels tax for transportation programs within their local jurisdictions to include bus and rail transit, park & ride facilities, and sidewalk projects. Manassas Park Manassas Prince William Stafford Fredericksburg Spotsylvania Funding PRTC funding comes from a combination of local, state and federal dollars, along with passenger fares. The member jurisdictions use the 2.1% motor fuels tax to meet their respective subsidy obligations. State dollars primarily come from the Department of Rail and Public Transportation (DRPT). Federal dollars primarily come from the Federal Transit Administration (FTA). PRTC has seen a reduction of 55% in federal funding over the last six years, mainly because of the elimination of fixed-guideway formula funding for buses and because providing services on HOT lanes no longer qualifies for federal funding. FY18 Budget $36,115,100 Operating $24,137,100 Capital 55% $60,252,200 Total Budget OMNIRIDE.com (703) G E T T H E R E S M A R T E R


21 I-66 Commuter Choice ANNUAL REPORT Fiscal Year 2018

 between the Northern Virginia Transportation Commission (NVTC) and the Commonwealth of Virginia authorizing")

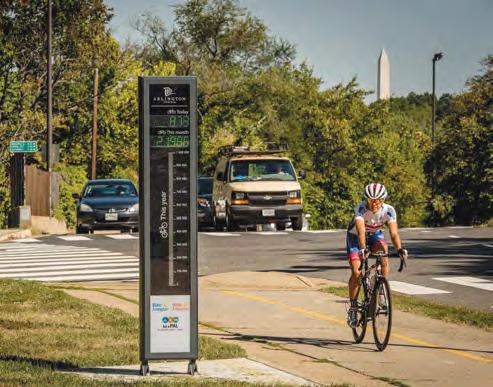
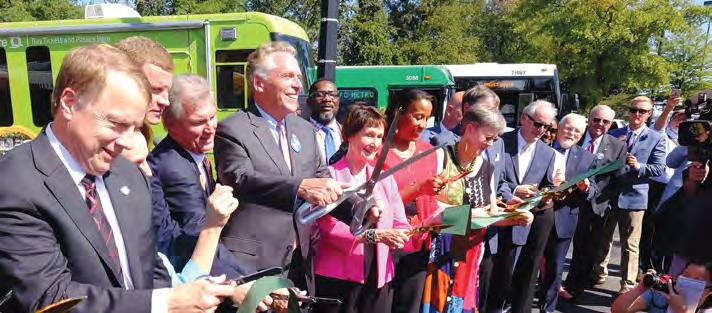
22 OVERVIEW Annual Report Fiscal Year 2018 Designed to improve the reliability and efficiency of commuting along what former Virginia Governor Terry McAuliffe called one of the nation s most congested interstate corridors, the I-66 Commuter Choice program is moving more people, increasing opportunities to connect from one mode of travel to another, improving transit service, reducing roadway congestion, and increasing travel options. The I-66 Commuter Choice program is the result of a 40-year Memorandum of Agreement (MOA) between the Northern Virginia Transportation Commission (NVTC) and the Commonwealth of Virginia authorizing NVTC to use revenues from I-66 inside the Beltway to fund multimodal transportation projects that benefit the interstate s toll payers. The first project funded through I-66 Commuter Choice began operating in December Others soon followed. In September 2017, Gov. McAuliffe and then Virginia Transportation Secretary Aubrey Layne joined NVTC and a host of dignitaries to celebrate the launch of the I-66 Commuter Choice program. Flanked by buses, bike share and a transit information display, the Governor spoke to the importance of the partnership between the Commonwealth and NVTC in improving the commutes of tens of thousands of Northern Virginians. While new and enhanced bus service has been key to alleviating congestion, other I-66 Commuter Choice projects which include a new park-and-ride lot, transit information screens, and transportation demand management initiatives play a pivotal role in improving travel in the corridor. I-66 Commuter Choice funds are available to all Virginia Planning District 8 jurisdictions and public transportation providers. The I-66 Commuter Choice program s first round of projects, approved by the Commonwealth Transportation Board (CTB) in July 2016, resulted in the funding of 10 projects, totaling $9.8 million. These projects are highlighted in this report. A second round of projects, which the CTB approved in June 2018, resulted in the funding of 13 projects, along with programmatic support, totaling $12 million. These projects are listed in this report. NVTC reviewed and approved all projects and the programmatic support prior to CTB consideration. The MOA requires that NVTC provide an annual report to the CTB. In keeping with the requirement, NVTC offers this accounting of projects funded through I-66 Commuter Choice.
23 Table of Contents ARLINGTON FAIRFAX COUNTY Fairfax Connector Government Center Downtown DC, Route 699 LOUDOUN COUNTY Stone Ridge Enhanced Transit ARLINGTON COUNTY Peak Period Service Expansion to Metrobus Route 2A, Washington Boulevard-Dunn Loring PRTC/OMNIRIDE Gainesville to Pentagon Commuter Service LOUDOUN COUNTY Transportation Demand Management COUNTY Bus Stop Consolidation and Accessibility Improvements Lee Highway and Washington Blvd. CITY OF FALLS CHURCH Expanded Transit Access, Bike Share ARLINGTON COUNTY Peak Period Service Expansion to ART Bus Route 55 ARLINGTON COUNTY Expanded TDM Outreach to the I-66 Corridor ARLINGTON COUNTY Multimodal Real-Time Transportation Information Screens NVTC I-66 COMMUTER CHOICE Projects Funded in Fiscal Year 2019 NVTC I-66 COMMUTER CHOICE Eligible Applicants


24 FAIRFAX COUNTY Fairfax Connector Government Center Downtown DC, Route % Funding Through I-66 Commuter Choice $ 3,336,836 Began operating on December 4, 2017 Route 699 provides express bus service from the Fairfax County Government Center, where free parking is available, to major regional employment and educational centers including The George Washington University campus, U.S. Department of State, and World Bank in Washington, D.C. This Fairfax Connector bus service provides 10 morning rush-hour inbound trips and 10 afternoon rush-hour outbound trips, with departures roughly every 20 minutes. Project Support Funds from I-66 Commuter Choice support both the purchase of four new buses and two years of operating costs. Toll Payer Benefits By moving more people more efficiently along the interstate, this service is decreasing demand on I-66 inside the Beltway and ensuring consistent travel speeds for toll payers. Project Status Route 699 is seeing strong ridership in its first year. Branded buses, featuring an oversize graphic announcing 699 on 66, catch the attention of drivers on the interstate. Social media and marketing initiatives have been effective in attracting new riders. 4 I-66 Commuter Choice 2018 Annual Report


25 LOUDOUN COUNTY Stone Ridge Enhanced Transit 74% Funding Through I-66 Commuter Choice $ 1,940,939 Began operating on July 10, 2017 This 300-space park-and-ride lot serves commuters in and around Aldie, which is among the fastest growing suburbs in the Washington, D.C. region. The new lot triples the capacity of the original Stone Ridge lot. Amenities such as bike lockers help resolve first- and last-mile issues, which occur when homes are too far away for commuters to comfortably walk to a transit stop. Each of the two new Motor Coach Industries buses, which run between Aldie and downtown D.C., provides one morning inbound trip and one afternoon outbound trip. Project Support Funds from I-66 Commuter Choice support the construction of the lot, purchase of two buses, and two years of operating costs. Toll Payer Benefits Improved access to commuter buses and increased bus service combine to reduce the number of single-occupancy vehicles on I-66 inside the Beltway, ensuring more consistent travel speeds for toll payers. Project Status The Stone Ridge park-and-ride lot nears capacity on a regular basis. The new bus service is being utilized and has attracted new riders. The amenities are well used. 5


26 ARLINGTON COUNTY Peak Period Service Expansion to Metrobus Route 2A, Washington Blvd.-Dunn Loring 100% Funding Through I-66 Commuter Choice $ 1,000,000 Began operating on June 25, 2017 Increased bus frequency and shorter route run times are designed to make the Metrobus 2A route more attractive to commuters. Currently half of commuters in the 2A service area are destined for jobs in Washington, D.C., according to the Metropolitan Washington Council of Governments Household Travel Survey. The 2A operates on US 29 and Washington Boulevard, adjacent to I-66, and connects three jurisdictions with three Metrorail stations. The 2A now runs every 10 minutes, as opposed to 15, during the morning and afternoon rush hours. Project Support Funds from I-66 Commuter Choice support two years of operating costs for the expanded bus service. Toll Payer Benefits Additional rush-hour bus service and reduced travel times on corridors that parallel I-66 inside the Beltway provide passengers with more commuting options and predictability, thereby increasing ridership and removing cars from both the interstate and adjacent roads. A decrease in single-occupancy vehicles on I-66 will allow for more consistent travel speeds for toll payers. Project Status Metrobus 2A s expanded service is being utilized by commuters. The 2A will benefit from the completion of Arlington s bus stop consolidation and shelter improvements, also funded through I-66 Commuter Choice, which will increase bus speed along the route. 6 I-66 Commuter Choice 2018 Annual Report


27 PRTC/OMNIRIDE Gainesville to Pentagon Commuter Service 100% Funding Through I-66 Commuter Choice $ 887,900 Began operating on December 12, 2016 This express bus service connects the rapidly growing community of Gainesville with the Pentagon. The popular service began with eight daily trips, four inbound during morning rush hour and four outbound during afternoon rush hour. After a year, an additional inbound and outbound trip were added. In May 2018, as construction ramped up on I-66 express lanes outside the Beltway, fares on the Gainesville to Pentagon buses were cut in half with funding from the Virginia Department of Transportation. Project Support Funds from I-66 Commuter Choice support two-and-a-half years of operating costs, route marketing, communication, and the leasing of additional park-and-ride facility spaces. Toll Payer Benefits The shifting of single-occupant vehicle trips to transit trips reduces congestion on I-66. This service is decreasing demand on I-66 inside the Beltway and ensuring consistent travel speeds for toll payers. Project Status The Gainesville to Pentagon commuter bus service is among OmniRide s most successful. The route has experienced steady ridership growth since its inception. Ridership received a bump when half-price fares took effect. The service is also attracting new riders, many of whom have become regulars. Gainesville Pentagon 7


28 LOUDOUN COUNTY Transportation Demand Management 100% Funding Through I-66 Commuter Choice $ 623,000 This expansion of a successful transportation demand management (TDM) program targets commuters bound for locations along the I-66 corridor inside the Beltway and in Washington, D.C. Currently 83 percent of Loudoun commuters using transit, vanpools or carpools are destined for those locations, according to Metropolitan Washington Council of Governments Household Travel Survey. The TDM program, called I SHARE 66, provides incentives such as reduced fares on express buses into D.C. or to Orange and Silver Line Metrorail stations, a SmarTrip card promotion for new Metrorail riders, and financial rewards for new carpools and vanpools to get commuters out of their singleoccupant vehicles. Began implementation in late 2017 Project Support Funds from I-66 Commuter Choice support program marketing and commuter incentives. Toll Payer Benefits By creating incentives to use transit, this program reduces the number of single-occupant vehicles on I-66 inside the Beltway and alleviates congestion, ensuring more consistent travel times for toll payers. Project Status I SHARE 66 s Metro Connection bus subsidy program which offered free rides to the Wiehle-Reston East Metrorail station from April 16 to June 2, 2018 saw ridership climb. Newspaper ads and social media alerted residents to the free ride program. I SHARE 66 has helped establish new carpools, rewarding drivers and passengers with gasoline gift cards. The TDM program has distributed SmarTrip cards to new Loudoun County Transit bus riders, many of whom continue to take transit. Its newly launched website provides transit information and resources to commuters. 8 I-66 Commuter Choice 2018 Annual Report


29 ARLINGTON COUNTY Bus Stop Consolidation and Accessibility Improvements, Lee Hwy. and Washington Blvd. 100% Funding Through I-66 Commuter Choice $ 462,000 Implementation underway The consolidation of underutilized and closely spaced bus stops along the Lee Highway and Washington Boulevard corridors is designed to reduce travel times and attract new bus riders. Up to 30 bus stops are being retrofitted with bus stop pads and pedestrian facilities such as sidewalks, curb ramps, and crosswalks that are compliant with the Americans with Disabilities Act, and enhanced passenger amenities, including shelters, benches and lighting. Project Support Funds from I-66 Commuter Choice will cover all capital costs. Toll Payer Benefits Streamlined bus service, which reduces both the amount of time a bus sits at a stop and the number of stops it makes, will increase bus speed through the corridor, making transit a more attractive commuting option. More accessible bus stops will encourage those with disabilities to use transit. The result will be a reduction in cars on I-66 and parallel roadways. Project Status When the project is fully implemented, riders on the Arlington Transit 55 and Metrobus 2A, 3Y, 15L, 38B, 42 and 77 routes will see improvement in bus run times, which will allow them to reach their destinations sooner and the bus routes to increase ridership. 9


, W Broad")
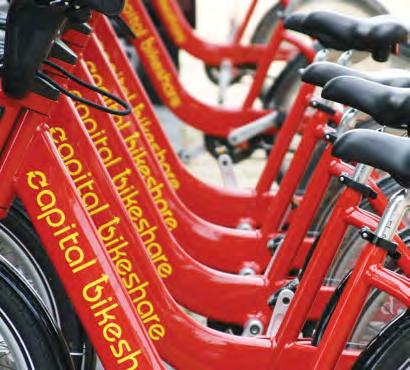
30 CITY OF FALLS CHURCH Expanded Transit Access, Bike Share 18% Funding Through I-66 Commuter Choice $ 462,000 Implementation underway The addition of up to 16 bike share stations, several adjacent to Metrorail stations, will help solve first- and last-mile issues, which occur when homes and offices are too far away for commuters to comfortably walk to a transit stop, and feed new riders into existing transit services. These bike share docks, designed to fill a gap in the regional bike share network, will expand the distance that commuters will travel to reach a transit station, increase travel options, and reduce pressure on the regional highway system. Project Support Funds from I-66 Commuter Choice support five years of operating assistance and maintenance for bike share stations along N Washington and S Washington streets (Route 29), W Broad Street (Route 7), and the W&OD Trail in the City of Falls Church. Toll Payer Benefits By providing a new option for accessing Metrorail stations, commuters will have an alternative to driving alone. The result will be decreased demand on I-66 inside the Beltway, which will ensure more consistent travel speeds for toll payers. Project Status An extensive stakeholder outreach effort which included meetings, pop-up events, and crowdsource mapping was used to identify Capital Bikeshare locations in the City of Falls Church. Procurement of bikes and docks is underway. 10 I-66 Commuter Choice 2018 Annual Report


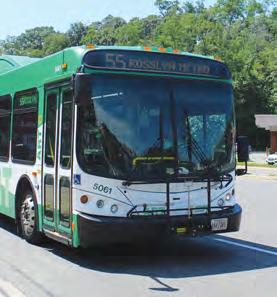
31 ARLINGTON COUNTY Peak Period Service Expansion to ART Bus Route % Funding Through I-66 Commuter Choice $ 450,000 Began operating on June 25, 2017 Adding buses to Arlington Transit s 55 route during the morning and afternoon rush hours provides an extra 3.5 round trips daily. The improved frequency is designed to attract new riders, roughly half of whom are destined for jobs in Washington, D.C., according to the Metropolitan Washington Council of Governments Household Travel Survey. The route, which runs along Lee Highway, connects commuters to the East Falls Church and Rosslyn Metrorail stations. Project Support Funds from I-66 Commuter Choice cover the rehabilitation of a bus and operating costs for two years. Toll Payer Benefit Additional rush-hour bus service on roadways that parallel I-66 inside the Beltway will encourage commuters to use transit, thereby removing cars from both the interstate and adjacent roads. A decrease in single-occupancy vehicles will allow for more consistent travel speeds for toll payers. Project Status Buses providing the additional daily round trips are attracting riders heading to both the East Falls Church and Rosslyn Metrorail stations and points in between. 11
 program, now called Co")


32 ARLINGTON COUNTY Expanded TDM Outreach to the I-66 Corridor 90% Funding Through I-66 Commuter Choice $ 350,000 Began implementation in late 2017 This expansion of a successful transportation demand management (TDM) program, now called Commute66, targets commuters bound for locations along the I-66 corridor inside the Beltway and Washington, D.C. Robust employer and residential outreach, which explain transit options and incentive programs, are designed to reduce single-occupant car trips through the corridor. These initiatives provide convenient connections to existing transit, helping to resolve first- and last-mile issues, which occur when homes and offices are too far away to comfortably walk to a transit stop, and feeding new riders into existing transit services. Project Support Funds from I-66 Commuter Choice support part-time marketing staff and incentives. Arlington Transportation Partners provides, in kind, a.25 full-time equivalent residential outreach person to complement the grant-funded contract staff. Toll Payer Benefits By working with employers and building management firms to create incentives, this project will reduce the number of singleoccupancy vehicles on I-66 inside the Beltway, Commute 66 helps alleviate congestion, ensuring more consistent travel times for toll payers. Project Status A baseline survey, done in coordination with the Metropolitan Washington Council of Governments Commuter Connections, identified both current commuting patterns and the types of amenities and programs that would entice commuters out of their cars. Survey responses have allowed Commute66 to target its efforts on initiatives and incentives that will drive results. Through its partnership with Commuter Connections, Commute66 and Arlington County have become engaged in a larger, regional program. Commute66 s new website serves as a commuter resource. 12 I-66 Commuter Choice 2018 Annual Report


33 ARLINGTON COUNTY Multimodal Real-Time Transportation Information Screens 85% Funding Through I-66 Commuter Choice $ 250,000 Implementation underway Real-time information on transit arrivals, Capital Bikeshare and Zipcar availability, and I-66 travel times and toll rates complements Arlington County s successful transportation demand management program. Multimodal real-time transportation screens, which provide dynamic information, are planned for Metrorail stations, high-utilization bus stops, and residential and office buildings in the Rosslyn-Ballston corridor. Project Support Funds from I-66 Commuter Choice support the purchase of up to 30 screens and one year of annual costs. Toll Payer Benefits Comprehensive, up-to-the minute information allows commuters to make informed travel choices, increasing transit use. By reducing the number of single-occupant vehicles on I-66 inside the Beltway, this project helps alleviate congestion, ensuring more consistent travel times for toll payers. Project Status To date, screens have been installed at the Ballston Commuter Store and Arlington Central Library. A Memorandum of Agreement (MOA) that will allow the installation of a screen has been signed with a condominium in the corridor and other MOAs are pending. Arlington County is working with the Metropolitan Washington Council of Governments Commuter Connections program to monitor the impact the screens have on travel behavior in the corridor and reduce the use of single-occupant vehicles for commuting. 13
34 NVTC I-66 COMMUTER CHOICE Projects Funded in Fiscal Year 2019 Project Funding* Overview Toll Payer Benefits FAIRFAX COUNTY Fairfax Connector Express Bus Service Between Vienna/Fairfax-GMU and Pentagon Metrorail Stations $3,452,618 (93%) Links the Vienna/Fairfax-GMU Metrorail station to the Pentagon Transit Center via express bus service. Four new buses will provide eight inbound and eight outbound trips. Providing an alternative to single-occupant vehicles will help reduce peak period congestion on I-66 inside the Beltway, resulting in lower tolls. LOUDOUN COUNTY $1,706,040 Loudoun County Transit (100%) Metro Connection Route 88X Extension to Dulles South Extends Loudoun County Transit's 88X service to a new western terminus in the Dulles South area. Two new buses will be added to continue the existing level of service. Providing an alternative to single-occupant vehicles will help reduce peak period congestion on I-66 inside the Beltway, resulting in lower tolls. PRTC/OMNIRIDE On-Demand Commuter Lot Shuttles in Prince William County $1,087,796 (100%) Links Gainesville/Haymarket neighborhoods to nearby commuter lots via free, ondemand shuttles. Funding will cover the purchase of vehicles, on-board vehicle hardware, transit operation, and promotion. Linking neighborhoods with area commuter lots will encourage and reinforce rush hour ridesharing by removing single-occupant vehicles from I-66 inside the Beltway during rush hour. LOUDOUN COUNTY Transit Metro Connection from New Purcellville Park and Ride $1,065,960 (100%) Links the Town of Purcellville and Wiehle- Reston East Metrorail station via new bus service. Includes the leasing of at least 80 commuter parking spaces and operation of three buses providing nine morning and afternoon trips. Providing an alternative to single-occupant vehicles will help reduce peak period congestion on I-66 inside the Beltway, resulting in lower tolls. CITY OF FAIRFAX CUE Access and Technology Improvements $965,000 (100%) Improves access and comfort at CUE bus stops through the installation of shelters, benches, signage, and real-time transit information displays. A marketing campaign will increase awareness of CUE. Improving access to Metrorail via CUE will encourage more people to ride transit, thereby removing cars from I-66 and the parallel commuting routes. CITY OF FALLS CHURCH Metrobus Route 3T Extension and Service Expansion $845,754 (100%) Restores direct Metrobus service between West Falls Church-VT/UVA and East Falls Church Metrorail stations. The expanded 3T route will feature bi-directional, peakperiod service with 24-minute headways. Restoring direct bus service between two Metrorail stations will make transit more attractive. This service will encourage residents and workers to use transit, rather than driving, thereby helping to reduce tolls on I-66. FAIRFAX COUNTY I-66 Corridor Vienna/ Merrifield Bike Share Expansion $497,100 (100%) Adds 10 new bike share stations, connecting residents to the Vienna/ Fairfax-GMU and Dunn Loring-Merrifield Metrorail stations and regional trails. Providing easy and low-cost access to mass transit will decrease the number of single-occupant vehicles both inside and outside the Beltway, thereby reducing congestion for toll payers. * Amount funded through I-66 Commuter Choice (% of total project funded through I-66 Commuter Choice) 14 I-66 Commuter Choice 2018 Annual Report
35 Project Funding* Overview Toll Payer Benefits ARLINGTON COUNTY I-66 Corridor Intelligent Transportation System Enhancements $400,000 (100%) Improves Arlington County's real-time traffic monitoring system so the county can better respond to special events and incidents in the corridor. Collecting and sharing traffic data will help improve incident management and response in the corridor, reducing congestion and lowering tolls. ARLINGTON COUNTY Traffic Management Center $400,000 (100%) Upgrades to Arlington County's Traffic Management Center will allow the county to maximize its new intelligent transportation system capabilities and respond to incidents as observed in real time. Increasing resources for the Traffic Management Center will improve operations throughout the I-66 corridor and aid with incident management. The result will be reduced congestion and lower toll prices. ARLINGTON COUNTY Expanded TDM Outreach to the I-66 Corridor $350,000 (100%) Expands Arlington County's transportation demand management program, which provides transit incentives to commuters. Funding would cover the hiring of two staff. Providing information, incentives and encouragement will allow solo drivers to choose from other commuting options, removing vehicles from the I-66 corridor and lowering tolls. PRTC/OMNIRIDE Flexible Vanpool Program $317,600 (100%) Develops and provides rostering and fare payment software to allow riders registered with one vanpool to ride with another and unregistered riders to catch a one-time ride. Increasing rush hour ridership would help remove single-occupant vehicles from the corridor during rush hour and lower tolls on I-66 inside the Beltway. PRTC/OMNIRIDE OmniRide Linton Hall Metro Direct Bus Service Enhancement $134,200 (100%) Adds one morning and afternoon trip between Linton Hall and the Tysons Corner Metrorail station to serve more riders during I-66 construction and support transit and transportation demand management plans. Increasing rush hour ridership would help remove single-occupant vehicles from the corridor during rush hour and lower tolls on I-66 inside the Beltway. CITY OF MANASSAS Bicycle Parking Improvements at Manassas VRE Station $55,000 (100%) Adds new sheltered bike racks, up to 10 bicycle lockers, and a bicycle repair stand to provide safe and convenient longterm bicycle parking, making bikes more attractive as a first- and last-mile option for Virginia Railway Express and Amtrak riders. Providing safe and convenient long-term bicycle parking will improve access to VRE s Manassas Line, thereby encouraging I-66 commuters to take the train. The result would be reduced congestion and lower tolls on the interstate. NORTHERN VIRGINIA TRANSPORTATION COMMISSION I-66 Commuter Choice Marketing and Outreach $400,000 (100%) Adds a dedicated manager to allow NVTC to coordinate I-66 Commuter Choice outreach and marketing efforts across jurisdictions. Coordinating marketing and outreach will allow NVTC and its jurisdictions to reach additional audiences with information about transportation alternatives in the corridor, helping to reduce the number of single occupant vehicles in the I-66 corridor. NORTHERN VIRGINIA TRANSPORTATION COMMISSION I-66 Commuter Choice Program Administration, Evaluation, and Oversight $400,000 (100%) Adds a dedicated program manager to allow NVTC to assume the administration, evaluation and oversight efforts necessary to ensure the success of the I-66 Commuter Choice program. Increasing evaluation and oversight will ensure that funded projects meet their goals, helping to move more people more efficiently through the I-66 corridor. 15

 n n NVTC")
 524-3322 facebook.com/novatransit twitter.")
36 Eligible Applicants Town of Leesburg Loudoun County Town of Herndon City of Fairfax Town of Vienna Arlington County City of Manassas Park City of Manassas Transit Agencies Prince William County Fairfax County Town of Dumfries City of Falls Church City of Alexandria Virginia Railway Express PRTC/OmniRide Washington Metropolitan Area Transit Authority (Metrobus/Metrorail) n n NVTC Jurisdiction Non-NVTC Jurisdiction Non-Eligible Jurisdiction Published: October 31, Wilson Boulevard, Suite 620 Arlington, VA (703) facebook.com/novatransit twitter.com/novatransit


37 Report on the Performance and Condition of the Washington Metropolitan Area Transit Authority Submitted to the Governor and the General Assembly November 2018
38 November 1, 2018 On behalf of the Northern Virginia Transportation Commission (NVTC), I am pleased to submit this Report on the Performance and Condition of the Washington Metropolitan Area Transit Authority (WMATA). This is the first report to respond to NVTC s new responsibilities as established by the Omnibus Transit Funding Bill [House Bill 1539/Senate Bill 856 (2018)] In addition to fulfilling our new reporting requirements, NVTC continues to provide funding oversight and stewardship of WMATA on behalf of its member jurisdictions through the management of state assistance to the transit agency and its appointments to the WMATA Board of Directors. This initial report presents data vital to understanding the performance and conditions of Metrorail and Metrobus and serves as a baseline for future years. It also identifies potential strategies to reduce the growth in WMATA s costs and to improve the efficiency of its operations. NVTC developed these strategies in coordination with our local jurisdictions, which are responsible for funding WMATA. The dedicated funds authorized by the Omnibus Transit Funding Bill will support WMATA s capital investments, which are designed to improve both safety and state of good repair. These improvements are critical to the economic health of the Commonwealth and Northern Virginia. NVTC looks forward to reporting annually on the performance and condition of WMATA. Best regards, Paul C. Smedberg Chairman
39 Table of Contents Introduction Safety & Reliability Safety Reliability On Time Performance Mean Distance between Delays/Failures Metrorail Financial Performance Metrorail Farebox Recovery Metrorail Service per Rider Cost per Metrorail Service Hour Metrobus Financial Performance Metrobus Farebox Recovery Metrobus Service per Rider Cost per Metrobus Service Hour Strategies to Reduce the Growth in Costs and Improve Operational Efficiency Section Overview Crosscutting Strategies Rebuild Rail and Bus Ridership Enhance Efficiency of Metrobus and Metrorail Operations Control Cost Escalation for Labor and Contracted Services Optimize Revenue Collection Increase Non Fare Revenues Enhance Efficiency of the Workforce and Contractors Use of Dedicated Capital Funds Metrorail & Metrobus Ridership Unlinked Passenger Trips Metrorail Unlinked Passenger Trips Metrobus Unlinked Passenger Trips Passenger Miles Traveled Metrorail Passenger Miles Traveled Metrobus Passenger Miles Traveled Conclusion Appendix Definitions Report on the Performance and Condition of the Washington Metropolitan Area Transit Authority 3
40 Table of Figures Table 1: Data Sources and Years Presented in this Report... 6 Table 2: Metrorail Safety (CY2017)... 9 Table 3: Metrobus Safety (CY2017)... 9 Table 4: On-Time Performance by Mode (FY2017) Table 5: Equipment Reliability for Metrorail and Metrobus (FY2017) Table 6: Metrorail Farebox Recovery (FY2017) Table 7: Metrorail Service per Rider (FY2017) Table 8: Cost per Metrorail Service Hour (FY2017) Table 9: Metrobus Farebox Recovery (FY2017) Table 10: Metrobus Service per Rider (FY2017) Table 11: Cost per Metrobus Service Hour (FY2017) Table 12: Metrorail Ridership, UPT (FY2017) Table 13: Metrobus Ridership, UPT (FY2017) Table 14: Metrorail Ridership, PMT (FY2017) Table 15: Metrobus Ridership, PMT (FY2017) Report on the Performance and Condition of the Washington Metropolitan Area Transit Authority 4
41 Introduction The Northern Virginia Transportation Commission (NVTC) 1 is charged with the funding and stewardship of the Washington Metropolitan Area Transit Authority (WMATA) on behalf of the jurisdictions of Arlington County, City of Alexandria, City of Falls Church, Fairfax County, City of Fairfax, and Loudoun County. Founded in 1964, in part to represent the interests of the Commonwealth during the creation of Metrorail, NVTC continues to serve as Virginia s voice on the WMATA Board of Directors 2 through its appointments to the board. NVTC also manages more than $154 million in state assistance to WMATA on behalf of its jurisdictions. Finally, NVTC conducts Northern Virginia s regional transit response program, coordinates regional transit fare collection efforts, and engages in regional transportation planning, data analysis, and reporting that provide direct benefits to WMATA and the related Northern Virginia transit network. Virginia s Omnibus Transit Funding Bill [House Bill 1539/Senate Bill 856 (2018)] increases NVTC s responsibilities regarding its role in WMATA oversight and reporting. It directs NVTC to report to the Governor and the General Assembly on the performance of WMATA, for both Metrorail and Metrobus, every year by November 1. This is the first report to respond to this new legislative requirement. Per statute, the report addresses six elements: 1. The safety and reliability of the rapid heavy rail mass transportation system and bus network 2. The financial performance of WMATA related to the operations of the rapid heavy rail mass transportation system, including farebox recovery, service per rider, and cost per service hour 3. The financial performance of WMATA related to the operations of the bus mass transportation system, including farebox recovery, service per rider, and cost per service hour 4. Potential strategies to reduce the growth in such costs and to improve the efficiency of WMATA operations 1 NVTC was established to manage and control the functions, affairs, and property of the Northern Virginia Transportation District, which was created by the 1964 Acts of Assembly of the Commonwealth of Virginia, Chapter 630, and the Transportation District Act. The purpose of the Act is to facilitate planning and developing a transportation system for Northern Virginia and for the safety, comfort and convenience of its citizens and for the economical utilization of public funds. The duties and powers of the Commission are set forth in Sections through of the Virginia Code. 2 The WMATA Board of Directors, established through an interstate compact between Virginia, Maryland and the District of Columbia, determines agency policy and provides oversight for funding, operations, and the expansion of transit facilities. Report on the Performance and Condition of the Washington Metropolitan Area Transit Authority 5
42 5. Use of the funds authorized by the legislation to improve the safety and condition of the rapid heavy rail mass transportation system 6. Ridership of the rapid heavy rail mass transportation system and the bus mass transportation system Much of the data used in this report is extracted from the National Transit Database (NTD) of the Federal Transit Administration (FTA). On an annual basis 3 NTD publishes safety, operating and financial data for each transit agency in the country that receives federal transit grant funding. For legislative requirements for which NTD data is unavailable, such as system reliability, data is extracted from the Metro Performance Report (MPR) published by WMATA on a quarterly basis. Table 1 summarizes the data sources for each category of the report, as well as the latest full fiscal or calendar year for which data is available. Table 1: Data Sources and Years Presented in this Report Legislative Item No. Report Category Year for which Data Is Publicly Available Data Source 1 Safety Calendar Year 2017 NTD Reliability Fiscal Year 2017 MPR 2,3 Financial Performance Fiscal Year 2017 NTD 4 Cost Reduction Strategies Developed by NVTC 5 Use of Funds To Be Provided in Future Years 6 Ridership Fiscal Year 2017 NTD For this report, data is generally provided for fiscal or calendar year The source of safety data is NTD. FTA publishes NTD safety data on a calendar year rather than a fiscal year basis 4. 3 Monthly for some data such as ridership. 4 There is a strong connection between operational and financial performance, which makes it important that the time periods of such data are aligned. The fact that safety data is not synchronized with financial performance data does not impact the analysis presented in this report. Report on the Performance and Condition of the Washington Metropolitan Area Transit Authority 6
43 This report includes six sections based on the six legislative requirements. Each section summarizes data in table format, with notes describing key information and definitions: Section 1: Safety and Reliability of Metrorail and Metrobus Section 2: Financial Performance of Metrorail Section 3: Financial Performance of Metrobus Section 4: Potential Strategies to Reduce Cost Growth and Improve Efficiency Section 5: The Use of Funds from the WMATA Capital Fund Section 6: Ridership of Metrorail and Metrobus Appendix: Definitions Report on the Performance and Condition of the Washington Metropolitan Area Transit Authority 7
44 1. Safety & Reliability Passenger and employee safety and security is the highest priority for WMATA. WMATA seeks to provide a safe and secure environment by minimizing the risk of death, injury, illness, and property damage. The American Public Transportation Association (APTA) reported that public transit is one of the safest modes of transportation. Fatalities of urban mass rail transit and buses are 0.33 and 0.2 per billion person miles respectively, whereas that of cars and light trucks (drivers and passengers) is The newly created Metro Safety Commission (MSC) 6 will provide independent safety oversight of WMATA, supporting the WMATA Board of Directors and General Manager s emphasis on system safety. Transit operators also seek to provide reliable service to passengers. Reliability can be measured in terms of a transit service s on time performance, as well as the frequency of equipment break downs Safety Transit systems seek to minimize the frequency of all safety events. The National Transit Database (NTD) measures transit safety by summarizing the total occurrences of certain safety events for rail and bus operations: 1. Collision 2. Derailment 3. Fatality 4. Fire 5. Injury 6. Security event [e.g. an occurrence of a bomb threat, bombing, arson, hijacking, sabotage, cyber security event, assault, robbery, rape, burglary, suicide, attempted suicide (not involving a transit vehicle), larceny, theft, vandalism, homicide, CBR (chemical/biological/radiological) or nuclear release, or other event 7 ] Table 2 summarizes the count of each type of Metrorail safety event in calendar year (CY) The NTD provides safety data on a calendar year basis, and not a fiscal year basis, unlike all 5 American Public Transportation Association (APTA). The Hidden Traffic Safety Solution: Public Transportation. September < Hidden Traffic Safety Solution Public Transportation.pdf> 6 Virginia Compacts Washington Metrorail Safety Commission Interstate Compact. < metrorail safety commission interstate compact/> 7 Federal Transit Administration (FTA). National Transit Database (NTD) Glossary. April 12, < transit database ntd glossary> Report on the Performance and Condition of the Washington Metropolitan Area Transit Authority 8
45 other data presented in this report. The official NTD definition for each term is provided in the Appendix. Table 2: Metrorail Safety (CY2017) NTD Category Safety Event Frequency Collision 2 Events Derailment 5 Security Event 45 Fire 101 Fatalities Fatality 2 Injuries Injury 323 Source: WMATA NTD Report, Form S&S 40 8 Table 3 summarizes the count of each Metrobus safety event in calendar year Table 3: Metrobus Safety (CY2017) NTD Categorization Safety Event Frequency Collision 165 Events Derailment N/A Security Event 38 Fire 8 Fatalities Fatality 0 Injuries Injury 505 Source: WMATA NTD, Form S&S 40 9 Additional Notes: The fatality and injury counts presented are the totals of subcategories (passenger, employee, and others) for each respective category Reliability There is no national standard for reporting transit reliability. The reliability of a transit system may be measured by its punctuality and equipment dependability. Reliability metrics used by WMATA include: 1. On time performance is the rate at which a transit system carries passengers to their destination on time. Per the Metro Performance Report (MPR) published by WMATA, this metric is used to evaluate the timeliness of travel for both rail and bus operations. 8 S&S 40 is the NTD Major Event Report Form. Reference S&S 40, Major Event Report in the Appendix. 9 Ibid Report on the Performance and Condition of the Washington Metropolitan Area Transit Authority 9
46 2. Mean distance between delays (MDBD) is the average number of miles that are traveled between failures that delay rail service. MDBD indicates the reliability of the equipment used to transport passengers. Ideally, with no failures, the number of miles between a delay (MDBD) would be nearly infinite because the rail vehicles would never encounter a delay due to failure. On the other hand, if there are frequent failures, then MDBD would be low since trains are disrupted by delays every few miles. The higher the MDBD value, the more reliable the rail system. 3. Mean distance between failures (MDBF) is the average number of miles that are traveled before a mechanical breakdown causes the bus to be removed from service or results in delays from schedule. Similar to MDBD (see above), the higher the MDBF, the more reliable the bus system. A highly reliable transit system has high on time performance, a high MDBD, and a high MDBF. Each of these reliability measures is presented below On-Time Performance On time performance is reported for fiscal year (FY) For Metrobus, on time performance reports the number of bus vehicles arriving at a stop at or close to the scheduled arrival time, divided by the total number of vehicles arriving at stop, over a period (in this case, one year). For Metrorail, on time performance measures the number of trains arriving at a station at or close to a scheduled headway, divided by the total number of station stops over a period (in this case, one year). Reference the Appendix for the standard WMATA definition. Table 4 summarizes Metrorail and Metrobus on time performance in FY2017 (Note: FY2017 ontime performance statistics are reported in the FY2018 Metro Performance Report). Table 4: On Time Performance by Mode (FY2017) Transit Mode Metrorail Calculation Number of trains arriving at a station at or close to a scheduled headway Total number of station stops On Time Performance 79% Number of vehicles arriving at a stop at or close to the scheduled arrival time Metrobus Total number of vehicles arriving at stops Source: Fiscal Year 2018 WMATA MPR, pp % Additional Notes: 1. Metrorail: a. Metrorail on time performance includes: i. Planned shutdowns (of a line or a segment of a line) Report on the Performance and Condition of the Washington Metropolitan Area Transit Authority 10
47 ii. Unplanned shutdowns (of a line or a segment of a line) iii. Single tracking events b. Metrorail on time performance excludes: i. Weekends and holidays (if holidays fall on weekdays, operations are based on a weekend schedule) c. To calculate on time performance, station stops are tracked system wide. A train is said to be on time if it arrives at a station stop within two minutes of the scheduled headway 10 during peak hours (morning and evening) or 150 percent of the headway during non peak hours (midday and night) Metrobus a. Metrobus on time performance excludes: i. Trips that have not been delivered (missed trips) 12 ii. Buses that have deviated from the scheduled route pattern for a detour Mean Distance between Delays/Failures Mean distance between delays (MDBD) indicates the average number of miles traveled between failures that delay rail or bus service. Higher MDBD indicates greater reliability of Metro mechanical equipment (e.g. doors, generators, and engines). The Metro Performance Report (MPR) presents MDBD only for Metrorail. Therefore, the equivalent metric for Metrobus, mean distance between failures (MDBF), is presented for bus reliability. Table 5 summarizes the Metrorail and Metrobus reliability figures for FY2017. When considering MDBD and MDBF for reliability, rail should have a substantially larger average number of miles than buses for two reasons: railcars travel substantially greater distances in a day relative to buses; and buses, like cars, may experience failure every few thousand miles. Table 5: Equipment Reliability for Metrorail and Metrobus (FY2017) Mode of Transit Reliability Metric Used Value of Reliability Metric Units Metrorail Mean Distance between Delays (MDBD) 79,656 miles Metrobus Mean Distance between Failures (MDBF) 8,283 miles Source: Fiscal Year 2018 WMATA MPR, pp Headways are the duration of time that customers wait between trains. 11 Per WMATA, peak periods are AM rush (approximately 6 a.m. 9:30 a.m.) and PM rush (approximately 3:15 p.m. 6:30 p.m.). Off peak periods are midday (approximately 9:45 a.m. 3 p.m.) and night (approximately 6:45 p.m. close). 12 A missed trip is a scheduled trip that did not operate for a variety of reasons, including operator absence, vehicle failure, dispatch error, traffic, accident, or other unforeseen reason. American Public Transit Association (APTA). Glossary of Transit Terminology <www4.uwm.edu/cuts/utp/glossary.pdf> Report on the Performance and Condition of the Washington Metropolitan Area Transit Authority 11
48 Additional Notes: 1. Metrorail: Mean distance between delays measures the effectiveness of Metro s railcar maintenance and engineering program. Factors that influence railcar reliability are the age and design of the railcars, the distance the railcars have traveled, the frequency and quality of preventive maintenance, and the interaction between railcars and the track Metrobus: Mean distance between failures is used to monitor trends in vehicle breakdowns that cause buses to go out of service and to plan corrective actions. Factors that influence bus fleet reliability include vehicle age, quality of maintenance program, original vehicle quality, and road conditions affected by inclement weather and road construction. 13 Washington Metropolitan Area Transit Authority (WMATA). Metro Performance Report. Fiscal Year < Metro Performance Report.pdf> Report on the Performance and Condition of the Washington Metropolitan Area Transit Authority 12
49 2. Metrorail Financial Performance Transit agencies, as a public service, aim to minimize cost and deliver service as efficiently as possible. The following Metrorail financial performance measures are required by HB1539/SB856 (2018): 1. Farebox recovery 2. Metrorail service per rider 3. Cost per Metrorail service hour The significance and meaning of these measures are summarized in each subsection below. NTD FY2017 data is reported for each measure Metrorail Farebox Recovery Farebox recovery indicates how much of an agency s operating costs are recovered through passenger fare revenues. This measure is used to identify how effectively an agency funds its operating costs. A higher recovery ratio indicates that the transit agency recoups a larger share of its operating costs through passenger revenue. (Section 4 summarizes proposed strategies to reduce WMATA operating costs.) Farebox recovery ratios differ across transit modes. Per the American Public Transportation Association (APTA) 2017 Public Transportation Fact Book 14, rail services generally have higher farebox recovery rates than bus services in the United States. Because rail systems generally have higher fares and higher ridership than bus systems, farebox recovery tends to be higher for rail systems than for bus systems. Per Table 6, Metrorail farebox recovery was 52.6 percent in FY2017. Table 6: Metrorail Farebox Recovery (FY2017) Financial Performance Metric Calculation Performance Units Fare Revenue Farebox Recovery Operating Expenses Source: WMATA NTD, Form F 10 & F % Revenue to Expense Ratio 14 American Public Transportation Association (APTA) Public Transportation Fact Book. p. 30. March < APTA Fact Book.pdf> 15 Form F 10 is the NTD Sources of Funds Funds Expended and Funds Earned form, Form S 30 is the NTD Operating Expenses form. < reporting system forms> Report on the Performance and Condition of the Washington Metropolitan Area Transit Authority 13
50 Additional Notes: 1. Farebox recovery is calculated by dividing the funds earned (fare revenue) by the total operating expenses (e.g. labor, services for operating and maintaining the transit system, general administration). Reference the Appendix for the official NTD definition Metrorail Service per Rider Service per rider indicates the number of railcar service hours offered per 10,000 passenger trips. This figure summarizes how efficiently an agency is transporting passengers. Agencies strive to strike a balance between serving as many passengers as possible while providing service at a reasonable cost. A low service per rider number indicates that relatively few hours of service are required to serve 10,000 passengers, which indicates higher efficiency. Per Table 7, Metrorail service per rider was hours per 10,000 trips in FY2017. Table 7: Metrorail Service per Rider (FY2017) Financial Performance Metric Calculation Performance Units Metrorail Service per Rider Source: WMATA NTD, Form S Vehicle Revenue Hours *10, Trips Hours per 10,000 Trips Additional Notes: 1. Vehicle revenue hours are the duration that a vehicle travels for revenue generation. 2. The factor of 10,000 in the calculation of service per rider is used for readability. Since service per rider is a relative metric, other scaling factors could be used Cost per Metrorail Service Hour The cost per Metrorail service hour is the average cost 17 associated with the operation and maintenance of one railcar for each hour of passenger revenue service. A lower number indicates a lower hourly cost to operate each railcar. Heavy rail services in the U.S. generally have a substantially higher cost per service hour than bus services. 18 Per Table 8, the cost per Metrorail service hour was $ in FY Form S 10 is the NTD Service form. < reporting system forms> 17 The cost per Metrorail service hour factors in a fully loaded operating and maintenance cost. See the definition of Operating Expenses. 18 APTA Public Transportation Fact Book. p. 30. Report on the Performance and Condition of the Washington Metropolitan Area Transit Authority 14
51 Table 8: Cost per Metrorail Service Hour (FY2017) Financial Performance Metric Calculation Performance Units Cost per Metrorail Service Hour Source: WMATA NTD, Form S 10 & F Operating Expenses Vehicle Revenue Hours $ $Expenses per Hour Additional Notes: 1. Vehicle revenue hours are the duration that a vehicle travels. 19 Form S 10 is the NTD Service form. F 30 is the NTD Operating Expenses form. Report on the Performance and Condition of the Washington Metropolitan Area Transit Authority 15
52 3. Metrobus Financial Performance As with Metrorail, WMATA aims to minimize Metrobus costs and deliver service as efficiently as possible. The following Metrobus financial performance measures are required by HB1539/SB856 (2018): 1. Farebox recovery 2. Metrobus service per rider 3. Cost per Metrobus service hour The significance and meaning of these measures are summarized in each subsection below. NTD FY2017 data is reported for each measure Metrobus Farebox Recovery Farebox recovery indicates how much of Metrobus operating costs are recovered through passenger fare revenues. This is an important financial measure to identify how effectively an agency funds its operating costs. A higher recovery ratio indicates that the transit agency recoups a larger share of its operating costs through passenger revenue. (Section 4 summarizes proposed strategies to reduce WMATA costs.) Per Table 9, for FY2017, Metrobus farebox recovery was 20.4 percent. Table 9: Metrobus Farebox Recovery (FY2017) Financial Performance Metric Fare Revenue Farebox Recovery Operating Expenses Source: WMATA NTD, Form F 10 & F Calculation Performance Units 20.4% Revenue to Expense Ratio Additional Notes: 1. Farebox recovery is calculated by dividing the funds earned (fare revenue) by the total operating expenses (e.g. labor, services for operating and maintaining the transit system, general administration). Reference the Appendix for the official NTD definition Metrobus Service per Rider Service per rider indicates the number of bus service hours offered per 10,000 passenger trips, summarizing how efficiently an agency is transporting passengers. A low service per rider 20 Ibid Report on the Performance and Condition of the Washington Metropolitan Area Transit Authority 16
53 number indicates that relatively few hours of service are required to serve 10,000 passengers. Per Table 10, Metrobus service per rider was hours per 10,000 trips in FY2017. Table 10: Metrobus Service per Rider (FY2017) Financial Performance Metric Calculation Performance Units Metrobus Service per Rider Source: WMATA NTD, Form S Vehicle Revenue Hours *10, Trips Hours per 10,000 Trips Additional Notes: 1. Vehicle revenue hours are the duration that a vehicle travels for revenue generation. 2. The factor of 10,000 in the calculation of service per rider is used for readability. Since service per rider is a relative metric, other scaling factors could be used Cost per Metrobus Service Hour The cost per Metrobus service hour is the approximate cost associated with the operation and maintenance of a vehicle for each hour of revenue service. A lower number indicates a lower average hourly cost to operate each bus. Per Table 11, the cost per Metrobus service hour was $ in FY2017. Table 11: Cost per Metrobus Service Hour (FY2017) Financial Performance Metric Calculation Performance, FY2017 Units Cost per Metrobus Service Hour Source: WMATA NTD, Form S 10 & F Operating Expenses Vehicle Revenue Hours $ $Expenses per Hour Additional Notes: 1. Vehicle revenue hours are the duration that a vehicle travels for revenue generation. 21 Form S 10 is the NTD Service form. 22 Form S 10 is the NTD Service form. F 30 is the NTD Operating Expenses form. Report on the Performance and Condition of the Washington Metropolitan Area Transit Authority 17
54 4. Strategies to Reduce the Growth in Costs and Improve Operational Efficiency Funding for the Washington Metropolitan Area Transit Authority (WMATA) comes from several sources, but Virginia s financial obligation to WMATA rests primarily with the jurisdictions represented by the Northern Virginia Transportation Commission (NVTC). Although WMATA receives substantial operating and capital support from the Commonwealth of Virginia, the cities of Alexandria, Falls Church, and Fairfax and the counties of Arlington, Fairfax and, soon, Loudoun (just prior to the start of Silver Line Phase 2 operations) are legally obligated to fund WMATA capital and operating expenditures. These jurisdictions have a vested interest in limiting the growth in costs and improving the operational efficiency of WMATA. Over the past several years in resolutions, testimony, and newspaper op eds NVTC has urged WMATA to control its operating costs and improve the efficiency of its operations and offered strategies to accomplish both. In June 2017, NVTC endorsed 23 the direction of the WMATA General Manager s Keeping Metro Safe, Reliable and Affordable plan and supported WMATA s efforts to operate both within fiscal parameters and under policies and practices that assure high levels of safety and efficiency. To date, several recommendations have been implemented, such as imposing a 3 percent cap on annual operating and capital subsidy growth and supporting competitive contracting of targeted functions where permitted. NVTC has embraced the opportunity afforded by Virginia s 2018 Omnibus Transit Funding Bill to share strategies that WMATA can use, building on efforts underway, to reduce costs and make its operations more efficient. Section Overview NVTC has identified strategies that, if implemented, could reduce the growth in WMATA s operating costs and improve its operational efficiency. In addition to crosscutting strategies, NVTC has organized these strategies in six categories: 1. Rebuild Rail and Bus Ridership 2. Enhance Efficiency of Metrobus and Metrorail Operations 23 Northern Virginia Transportation Commission (NVTC). NVTC Principles for WMATA Reform. September 7, < 20 %20As%20Amended% pdf> Report on the Performance and Condition of the Washington Metropolitan Area Transit Authority 18
55 3. Control Cost Escalation for Labor and Contracted Services 4. Optimize Revenue Collection 5. Increase Non Fare Revenues 6. Enhance Efficiency of the Workforce and Contractors These strategies, developed in coordination with jurisdictional and WMATA staff, include previously published NVTC priorities as well as efforts underway or planned for implementation under the Keeping Metro Safe, Reliable and Affordable plan and FY2019 budget. Short term strategies could be implemented in one to three years. Long term strategies may require legal, structural or legislative changes that could yield results in three or more years. It should be noted that while the WMATA Board of Directors and the General Manager have the authority to implement some strategies, several are outside their purview and will require changes in federal legislation and/or coordination among and between jurisdictions and WMATA. Crosscutting Strategies Crosscutting Strategies Align WMATA s business model to reflect shifts in urban/suburban mobility and define its role within the concept of mobility as a service Encourage the development and use of innovation and technology within the WMATA workforce and contractor provided services, in procurement actions, and operational processes Changes in demographics and market conditions are influencing the role of public and private mobility providers. Nationwide, transit is in a period of transition, as ridership is declining or flat in many urban areas. Transit agencies are looking at innovative approaches, business models and uses of technology to adapt 24. NVTC sees an opportunity to reexamine and better align WMATA s business model to reflect shifts in urban/suburban mobility and define its role within the concept of mobility as a service. Through efforts like the Washington Area Bus Transformation Project and implementation of a new approach to fare collection, WMATA has the opportunity to focus its operations to respond to changing travel behaviors. NVTC also encourages the development and use of innovation and technology within the WMATA workforce and contractor provided services, in procurement actions, and operational processes. New systems and processes from workforce initiatives to targeted procurement efforts may provide WMATA with the opportunity to improve efficiencies in its operations. 24 Washington Metropolitan Area Transit Authority (WMATA). Understanding Rail and Bus Ridership. October 12, < pdfs/upload/3a Understanding Ridership TO POST.pdf> Report on the Performance and Condition of the Washington Metropolitan Area Transit Authority 19
56 4.1. Rebuild Rail and Bus Ridership Short Term Implement new fare pass products to promote more frequent rail and bus ridership and increase customer satisfaction* Pursue partnerships with the business community to provide easier access to transit for employees and visitors* *Efforts underway by WMATA Long Term Pursue capital investments that increase the reliability of the system* NVTC proposes that WMATA offer more flexible fare payment options for Metrorail and Metrobus customers. A variety of fare payment options can ease the transit riding experience and help rebuild Metrorail and Metrobus ridership in the short term. NVTC s recent Northern Virginia Regional Fare Collection Strategic Plan, 25 developed with input from local transit systems, found broad agreement on the need for an upgraded and enhanced metropolitan Washington D.C. regional fare collection system, integrated with Metrorail and Metrobus, that can coexist with and be complemented by local solutions that meet each transit system s needs. Such an arrangement would promote the development and adoption of alternative payment methods and new pass products. An example of promising transit fare products is SelectPass 26, a customizable and unlimited monthly pass that WMATA adopted in SelectPass has been well received and demonstrated positive impacts on ridership and revenue. Expanding the marketing and adoption of SelectPass fare products would increase revenues and the efficiency of the rail and bus systems. WMATA has several pass products that provide diverse payment options, both on a pay as you go and subscription based model. There are opportunities for WMATA to respond to customer demand and increase ridership by implementing new types of fare products that address unmet market demand and reduce barriers to transfers between bus and rail. In 2016, more than 22.8 million people visited Washington, D.C., staying an average of 2.6 nights (domestic travelers) and six nights (international travelers) 27. There are more than 35,000 hotel rooms in the District alone and the average daily rate for these hotels is more than $200 per night. Given the number of visitors who come to the D.C. region every year, WMATA should explore additional opportunities to partner with the hotel and convention industry to provide fare products directly to visitors as a part of hotel and/or convention registration. 25 Northern Virginia Transportation Commission (NVTC). Northern Virginia Regional Fare Collection Strategic Plan < pdf> 26 Washington Metropolitan Area Transit Authority (WMATA). SelectPass: Pilot Performance and Tariff Update. December 1, < pdfs/upload/120116_3aselectpasstopost.pdf> 27 Destination DC (formerly the Washington, DC Convention & Tourism Corporation, or WCTC). Washington, DC Visitation and Impact (2017). <washington org.s3.amazonaws.com/s3fs public/2017_dc_visitation_and_impact_fact_sheet.pdf> Report on the Performance and Condition of the Washington Metropolitan Area Transit Authority 20
57 NVTC also sees opportunities for WMATA and Northern Virginia partners to expand WMATA s University Pass (U Pass) program 28, which provides students of participating higher education institutions unlimited rides on Metrobus and Metrorail at a discounted price. The U Pass program currently benefits several colleges and universities in the D.C. area, including Carnegie Mellon University Heinz College and more than 10,000 American University and Washington College of Law students. After a successful pilot program, the WMATA Board voted to formalize the program and expand to additional educational partners and interested regional transit providers 29. In the long term, NVTC proposes that WMATA pursue capital investments to increase the system s reliability. WMATA s Capital Needs Inventory (2016) 30 found an unconstrained capital need of $25 billion 31. Historically low levels of capital funding have impacted safety, reliability and compliance efforts and contributed to service disruptions and delays in the system. WMATA s adopted FY2019 Capital Budget 32 calls for $1.28 billion in capital investments, with safety and state of good repair as the largest segment. The recent adoption of $500 million per year of dedicated capital funding by the District of Columbia, Maryland and Virginia provides WMATA with an invaluable tool to achieve these capital goals. WMATA s sustained commitment to capital investments that help achieve and maintain a state of good repair will increase the reliability of the system and yield long term dividends by rebuilding ridership Enhance Efficiency of Metrobus and Metrorail Operations Short Term Engage with jurisdictions to implement and explore pilot programs and other efforts to increase the reliability and speed of Metrobus operations* Prioritize state of good repair investments that enhance Metrorail efficiency and reliability* Conduct a comprehensive analysis of WMATA s bus network (Washington Area Bus Transformation Project) * *Efforts underway by WMATA Long Term Develop a fare system that can enable the region to implement an interoperable off vehicle fare collection system on high capacity bus routes Where appropriate, implement recommendations from the Washington Area Bus Transformation Project Study 28 Washington Metropolitan Area Transit Authority (WMATA). U Pass Program. < Pass/> 29 Washington Metropolitan Area Transit Authority (WMATA). University Pass (U Pass) Pilot Program. April 20, < pdfs/upload/11a FIN UPass Adoption.pdf> 30 Washington Metropolitan Area Transit Authority (WMATA). 10 Year Capital Needs: Inventory and Prioritization CY Needs. November < full report and appendices.pdf> 31 Washington Metropolitan Area Transit Authority (WMATA). Keeping Metro Safe, Reliable and Affordable. September 14, < pdfs/upload/3b KMSRA Final TO POST.pdf> 32 Washington Metropolitan Area Transit Authority (WMATA). FY2019 Approved Budget. July 1, < Approved BudgetFinal.pdf> Report on the Performance and Condition of the Washington Metropolitan Area Transit Authority 21
58 The Washington, D.C. region relies on an integrated transportation network that includes a network of bus systems, including Metrobus. Metrobus provides more than 400,000 trips each weekday serving 11,500 bus stops in D.C., Maryland and Virginia. Metrobus is the sixth busiest bus service in the U.S., with a fleet of more than 1,500 buses operating on 325 routes. 33 In the short term, NVTC sees the potential for WMATA to increase the speed and reliability of bus operations, which would increase ridership and reduce operating costs. WMATA s 2018 cash free pilot 34 on its MetroExtra Route 79 will provide data to help evaluate whether cashfree service should be extended to other limited stop routes, including three in Virginia. Loading cash onto a SmarTrip fare card or paying with cash on the bus takes at least 10 seconds per person, which significantly slows progress. WMATA is exploring whether to make the cash free pilot permanent and extend it to additional limited stop Metrobus routes. 35 Metrorail is a vital mobility option and supports economic growth and development across the entire region. In recent years, WMATA has modified Metrorail service to provide additional time for track and system maintenance and has prioritized state of good repair investments that directly impact the efficiency of rail service. Both the General Manager s plan Keeping Metro Safe, Reliable, and Affordable 36 and the 2017 report by former U.S. Secretary of Transportation Ray LaHood 37 identified recommendations to reexamine or rethink the region s approach to Metrobus. WMATA recently initiated an effort to develop a regional bus strategy and roadmap. The Washington Area Bus Transformation Project 38 seeks to identify how to improve service, provide a better customer experience for bus riders, determine the best role for bus service amid rapidly changing technologies and travel preferences, and increase efficiency to provide better results for customers despite limited resources. During a year long effort, the Washington Area Bus Transformation Project team will engage with stakeholders from the public and private sectors across the region to explore all factors that influence the quality of bus service, including costs, advancing technology, governance structures, regional coordination and communication, service operations, funding sources, and the role of different providers. 33 Washington Metropolitan Area Transit Authority (WMATA). About Metrobus Washington Metropolitan Area Transit Authority (WMATA). Cash Free Bus Pilot. May 24, < pdfs/upload/10b SSD Cash Free Bus Pilot FINALIZED.pdf> 35 Washington Metropolitan Area Transit Authority (WMATA). Metro Considers Expanding Cash Free Boarding on Limited Stop Routes, Seeks Public Input. September 6, < considers expanding cash freeboarding on limited stop routes.cfm> 36 WMATA. Keeping Metro Safe, Reliable and Affordable. September 14, Department of Rail and Public Transportation (DRPT). Review of Operating, Governance and Financial Conditions at the Washington Metropolitan Area Transit Authority < report.pdf> 38 Washington Area Bus Transformation Project. About. Accessed on September 11, < Report on the Performance and Condition of the Washington Metropolitan Area Transit Authority 22
59 The project will develop a set of draft strategies with recommendations and an implementation plan by NVTC staff are engaged in two of the project s stakeholder committees and will be involved throughout the life of the project. NVTC will examine the resulting strategies for consideration in future reports to the General Assembly and Governor. NVTC also supports the development and implementation of a regional interoperable offvehicle fare collection system on high capacity bus routes as a long term strategy. WMATA operates SmarTrip, a regional system that supports fare payment on buses. In 2018, WMATA announced a modernization initiative 39 that includes the development of an application that would enable mobile phones to function as SmarTrip cards. As articulated in NVTC s Northern Virginia Regional Fare Collection Strategic Plan, 40 a new system should support off vehicle fare payment and onboard ticket inspection and provide solutions for all door boarding for transit systems to minimize the time passengers spend getting on the bus. Speeding up the boarding process can shorten passenger travel time, increase ridership, and reduce operating costs Control Cost Escalation for Labor and Contracted Services Short Term Provide greater authority to the WMATA General Manager and Board of Directors to make operational decisions that improve the system s cost effectiveness, without jeopardizing safety. This should include tools such as competitive contracting of targeted functions* *Efforts underway by WMATA Long Term Include the 3 percent cap on annual operating subsidies as a mandatory factor in establishing labor costs through collective bargaining of subsequent arbitration Amend the federal Wolf Act to require arbitrators in WMATA contract mediations to consider these fiscal restrictions in all cases Identify and evaluate options to address unfunded OPEB liabilities Labor expenses comprise about 70 percent of WMATA s total operating expenses. According to WMATA s General Manager, labor and benefit costs are growing at 1.5 and 2.5 times the rate of revenue 42, respectively. WMATA will need to address its $1.01 billion unfunded pension liability 43 and $1.8 billion unfunded Other Post Employment Benefits (OPEB) liability 44, which 39 Washington Metropolitan Area Transit Authority (WMATA). Fare Collection Modernization Program Update. April 12, < pdfs/upload/4a Fare Collection Modernization Update.pdf> 40 NVTC. Northern Virginia Regional Fare Collection Strategic Plan. May WMATA. Cash Free Bus Pilot. May 24, WMATA. Keeping Metro Safe, Reliable and Affordable. September 14, Washington Metropolitan Area Transit Authority (WMATA). Review Plan Actuarial Reports and Performance. November 2, < pdfs/upload/3a Pension Plan Performance Reports Corr.pdf> 44 Washington Metropolitan Area Transit Authority (WMATA). Other Post Employment Benefits (OPEB) Update. April 12, < pdfs/upload/4a OPEB Update.pdf> Report on the Performance and Condition of the Washington Metropolitan Area Transit Authority 23
60 includes non pension costs for retiree medical and prescription drug coverage, and life insurance. A recent U.S. Government Accountability Office (GAO) study found that, The Washington Metropolitan Area Transit Authority s (WMATA) workforce costs including wages, salaries, and benefits for employees and retirees increased on average by about 3 percent annually from fiscal years 2006 through This increase was largely driven by the cost of employee and retiree benefits. Specifically, the amount WMATA was required to contribute to its pension plans increased by an annual average of about 19 percent during this period. Due to their relative size, proportion of retirees compared to active members, and investment decisions, these pension plans pose significant risk to WMATA s financial operations, yet WMATA has not fully assessed the risks. 45 WMATA has provided the GAO with a recently completed, comprehensive assessment of financial risks posed by its pension plans. WMATA also noted that additional work is needed with the board and jurisdictions to achieve a long term solution. In addition, two of WMATA s unions (Local 639 and Local 2) and non represented staff have already moved to defined contribution retirement plans for new employees. In March 2017, the WMATA Board established an OPEB Trust that will be funded with savings achieved through successful controls on absenteeism, overtime and workers compensation, and other sources as available. Given the Virginia jurisdictions responsibility to meet their share of these financial obligations, NVTC is keenly interested in identifying ways to control labor costs. As such, NVTC adopted its Principles for WMATA Reform 46 in September 2017 that included specific strategies for WMATA to control labor costs. NVTC s principles included: In labor negotiations, the WMATA General Manager and Board of Directors should have greater authority to make operational decisions that improve the system s cost effectiveness without jeopardizing safety, including the use of tools such as competitive contracting of targeted functions. WMATA s annual operational cost increases should adhere to the 3 percent annual cap recommended by the General Manager in his April 2017 Keeping Metro Safe, Reliable and Affordable plan. The ability to maintain such funding discipline should be a mandatory in establishing labor costs through collective bargaining or arbitration. NVTC endorses an amendment to the National Capital Area Interest Arbitration Standards Act of 1995, Pub L , as recommended by the General Manager in his Keeping Metro Safe, Reliable and Affordable plan that would require arbitrators in WMATA contract mediations to consider these fiscal restrictions in all cases. 45 Government Accountability Office (GAO). Washington Metropolitan Area Transit Authority Assessing Fiscal Risks and Improving Workforce Management Would Help Achieve Strategic Goals. September < 46 NVTC. NVTC Principles for WMATA Reform. September 7, Report on the Performance and Condition of the Washington Metropolitan Area Transit Authority 24
61 NVTC calls upon the WMATA General Manager and Board of Directors to identify a specific plan to address the agency s unfunded pension liability and other postemployment benefits. NVTC supports WMATA s initiatives to improve cost effectiveness without jeopardizing safety. Such measures include WMATA s contract for the maintenance and operation of buses from its new Cinder Bed Road bus facility 47 in Lorton, Virginia, which is expected to limit cost growth while delivering quality service and preserving current employees jobs. Silver Line Phase 2 also offers a contracting opportunity 48. Both initiatives are central to WMATA s strategy to manage long term pension costs Optimize Revenue Collection Short Term Implement efforts on bus and rail to decrease fare evasion* *Efforts underway by WMATA Long Term Develop the next generation of fare collection technology Fare evasion creates safety and customer service concern as well as a direct and indirect loss of revenue, the latter by impacting federal funding formulas. In the Metrorail system, the use of swing gates is the primary way that riders avoid paying fares. In 2017, WMATA conducted a pilot at Fort Totten and Gallery Place Metrorail stations to test new swing gate configurations that stop their use except in the event of an emergency. Results of the pilot found that at the affected stations there was a 2.3 percent net increase in weekday ridership. Using lessons learned from the pilot, WMATA began the installation of secure swing gates in all Metrorail stations in the summer of Major elements of WMATA s fare collection technology have reached or exceeded their useful life. As articulated in NVTC s Northern Virginia Regional Fare Collection Strategic Plan, 50 there is a need for a long term plan for a regional system that can enhance the customer experience and transit system efficiencies. A next generation system would allow greater innovation and flexibility in payment types and platforms, regional interoperability, fare products, and payment across modes. This would reduce costs and improve efficiency by optimizing revenue collection, 47 Washington Metropolitan Area Transit Authority (WMATA). In Move to Control Costs, Metro Awards Contract for New Bus Facility in Virginia. August 2, < bed contract.cfm> 48 Washington Metropolitan Area Transit Authority (WMATA). Metro Announces Contracting Opportunity for Silver Line Extension in Effort to Control Future Expense Growth. September 18, < Line Contracting Opportunity Release.cfm> 49 Washington Metropolitan Area Transit Authority (WMATA). Fair Share Initiative Update. April 12, < pdfs/upload/3a Fair Share Update.pdf> 50 NVTC. Northern Virginia Regional Fare Collection Strategic Plan. May Report on the Performance and Condition of the Washington Metropolitan Area Transit Authority 25
62 reducing the need for physical in station fare collection infrastructure and removing barriers related to fare collection that can attract new riders Increase Non-Fare Revenues Short Term Leverage value for assets WMATA owns by maximizing advertising revenues and optimizing parking revenues* Explore non traditional revenue streams to optimize value of Metrorail facilities* *Efforts underway by WMATA Long Term Pursue joint development opportunities on underutilized assets* Pursue a real estate strategy that generates operating efficiencies* NVTC supports initiatives and efforts by WMATA to increase and optimize its non fare revenues. In its FY2019 Operating Budget 51, WMATA included advertising revenues totaling $26 million or 1.4 percent of operating revenues. In 2015, WMATA initiated the use of digital advertising in stations and expanded it in 2016 and By replacing static displays with digital panes, multiple advertisers can purchase time on a single display, increasing the revenue potential from advertising in the stations 52. Train wraps and station domination, where an advertiser blankets the advertising in one station, are recent advertising initiatives WMATA is pursuing to generate revenue. With its 28 garages, 30 surface parking lots and 44 kiss and ride lots, totaling over 61,000 parking spaces, parking is a key component of WMATA s ability to attract automobile drivers to use Metrorail. NVTC supports initiatives to optimize parking revenue through policies that increase parking utilization and generate revenues from nonriders while increasing transit ridership. In 2017, WMATA authorized parking pilot programs, 53 followed by changes in These pilot programs are being evaluated and considered for permanent adoption 54. Joint development, where private real estate developments co locate with transit services, increases demand for transit and generates additional non fare revenue for WMATA. WMATA has an active joint development program and more than 30 such projects have been completed 51 WMATA. FY2019 Approved Budget. p. 26. July 1, Washington Metropolitan Area Transit Authority (WMATA). Revenue Opportunities: Digital Advertising and Station Naming Rights. July 13, < pdfs/upload/4c Revenue Opportunities Digital Ads Station Names.pdf> 53 Washington Metropolitan Area Transit Authority (WMATA). Parking Revenue Enhancements. July 13, < pdfs/upload/3b Parking Rev Enancements Rev v2 TO POST.pdf> 54 Washington Metropolitan Area Transit Authority (WMATA). Approval of Parking Pilot Title VI Analysis and Authorization of Public Hearing for Parking Programs. July 12, < pdfs/upload/9b Parking Programs FINALIZED.pdf> Report on the Performance and Condition of the Washington Metropolitan Area Transit Authority 26
63 since Its recently updated joint development guidelines 55 provide more flexibility in program management. NVTC sees continued long term opportunities for WMATA to increase non fare revenues by pursuing joint development on underutilized assets. WMATA owns real estate across the region in urban, suburban and industrial locations. Given the recent passage of dedicated capital funding and a 3 percent cap on operating subsidy increases, NVTC sees opportunities for strategically placing the locations of WMATA facilities in a manner that will enhance land use value and reduce operating costs. WMATA is implementing an office consolidation strategy that will reduce the number of facilities it leases or owns from 10 to seven Enhance Efficiency of the Workforce and Contractors Short Term Adequately fund WMATA s Office of the Inspector General Improve productivity through strengthened management of employee absenteeism and overtime* Improve management of use of workers compensation* *Efforts underway by WMATA Long Term Continue to enhance workforce productivity through human resource policies* Incentivize the workforce and contractors to deliver innovative solutions NVTC supports efforts to adequately fund WMATA s Office of the Inspector General (OIG) to ensure it is sufficiently resourced to conduct its mission. The OIG, which reports directly to the WMATA Board, conducts independent and objective audits, evaluations, investigations and reviews of WMATA programs and operations to promote efficiency and effectiveness while preventing fraud, waste and abuse 57. The OIG advises the WMATA Board and General Manager in order to achieve the highest levels of program and operational performance. NVTC supports WMATA s initiatives to minimize absenteeism and the use of overtime. In 2017 the WMATA General Manager introduced new controls on absenteeism 58 to improve productivity and reduce the use of overtime. These efforts targeted excessive absenteeism through rigorous monitoring and compliance with existing policies and agreements. These controls included tighter management of unexcused absences and sick leave, improvements in 55 Washington Metropolitan Area Transit Authority (WMATA). Update to Metro s Joint Development Policies. April 12, < pdfs/upload/3a Joint Development Policies.pdf> 56 Washington Metropolitan Area Transit Authority (WMATA). Office Consolidation. July 12, < pdfs/upload/9c Office Consolidation FINALIZED.pdf> 57 WMATA. FY2019 Approved Budget. p. 53. July 1, Washington Metropolitan Area Transit Authority (WMATA). Metro GM Further Increases Accountability with New Controls on Absenteeism. February 17, < absenteeism policy.cfm> Report on the Performance and Condition of the Washington Metropolitan Area Transit Authority 27
64 reviews of time and payroll verifications, and improved management of the use of worker compensation. Between January and April 2018, savings from absenteeism, worker s compensation, and overtime controls resulted in over $3 million in savings 59. Through savings from these controls, WMATA has established an Other Post Employment Benefit Trust to prefund OPEB liabilities. The GAO recently published a study that reviewed WMATA s workforce management with a focus on the sustainability of costs and performance management practices. Specifically, it found that WMATA has implemented two employee performance management systems that cover all employees, but these systems lack some key elements of an effectively designed and implemented performance management system. 60 The GAO recommends that WMATA develop comprehensive policies and procedures for its employee performance management systems, and controls to ensure supervisors complete required performance evaluations. WMATA notified the GAO that it has initiated procurement of consultant support to evaluate and redesign, as needed, WMATA s current performance management program for all employee groups to develop guidance on best practices, policies and procedures, and to examine the use of technology. WMATA s goal is to begin consultant supported work in July In realigning WMATA s business model and enhancing employee performance management, NVTC sees a long term potential to reduce the growth in costs and improve operational efficiency. Supporting innovation, the strategic use of technology within the workforce and contracted services and incentivizing the workforce will yield innovative solutions. 59 WMATA. Other Post Employment Benefits (OPEB) Update. April 12, GAO. Washington Metropolitan Area Transit Authority Assessing Fiscal Risks and Improving Workforce Management Would Help Achieve Strategic Goals. September Report on the Performance and Condition of the Washington Metropolitan Area Transit Authority 28
65 5. Use of Dedicated Capital Funds HB1539/SB856 (2018) authorized the Washington Metropolitan Area Transit Authority Capital Fund (WMATA Capital Fund) to fund Virginia s portion of WMATA s dedicated capital funding. The legislation required that, in each year that revenues are deposited into the fund, NVTC shall include in this report the use of funds from the WMATA Capital Fund during the prior year. The Virginia legislation became effective on July 1, 2018 and the Commonwealth authorized the use of $121.3 million in revenues to be disbursed to WMATA in FY2019 from the WMATA Capital Fund 61. Because of the timing of this initial report, no expenditures were incurred during this reporting period. NVTC will provide information on the use of these funds in the future. The Commonwealth s WMATA Capital Fund will support WMATA s investments in safety, system preservation, and state of good repair of its rail transportation system and bus network. WMATA s FY Capital Improvement Plan (CIP), part of the agency s FY2019 budget, provides details on the sources and uses of funds. Safety and state of good repair comprise the largest section of the capital budget. They include recurring annual investments in the replacement, rehabilitation and maintenance of existing assets to ensure the safety of WMATA s core infrastructure and to promote a state of good repair. In the future, WMATA will provide NVTC with the information necessary to report on the use of funds from the Commonwealth s WMATA Capital Fund. 61 The Department of Rail and Public Transportation sent a letter on June 7, 2018 informing WMATA of the Commonwealth of Virginia s authorization of the use of funds from the Washington Metropolitan Area Transit Authority Capital Fund. Report on the Performance and Condition of the Washington Metropolitan Area Transit Authority 29
66 6. Metrorail & Metrobus Ridership Because public transit services exist to transport passengers, transit systems seek to maximize patronage, measured in passengers. This section summarizes Metrorail and Metrobus ridership, which is measured by the NTD using: 1. Unlinked Passenger Trips (UPT) 2. Passenger Miles Traveled (PMT) The meaning and significance of these two ridership measures are clarified in Sections 5 and 6.2. Data is reported for FY Unlinked Passenger Trips Unlinked passenger trips (UPT) indicates the number of passengers boarding vehicles. UPT demonstrates the overall number of passengers passing through the overall Metro system. A higher UPT reflects greater use of transit services. This section provides FY2017 UPT data for Metrorail and Metrobus Metrorail Unlinked Passenger Trips In FY2017, total ridership for Metrorail was 227,053,037 unlinked passenger trips, as shown in Table 12. The official NTD definition for this ridership metric is included in the Appendix. Table 12: Metrorail Ridership, UPT (FY2017) Ridership Metric Total Trips Units Unlinked Passenger Trips 227,053,037 Trips 62 Source: WMATA NTD, Form S Additional Notes: 1. NTD reports ridership using the UPT metric, which reflects the number of passenger boardings. The trip of a passenger who boards two separate Metro trains, transferring from one Metrorail line onto a different line, would be counted as two UPTs. 2. Metrorail directly records and publishes linked passenger trips, which are adjusted to UPT using a statistical method based on a passenger survey 64. A linked passenger trip may include boarding two or more trains. This statistical adjustment from linked 62 See Unlinked Passenger Trips in 8.1 Definitions. 63 Form S 10 is the NTD Service form. 64 National Transit Database, National Transit Database Sampling Manual. March 31, < Report on the Performance and Condition of the Washington Metropolitan Area Transit Authority 30
67 passenger trips to unlinked passenger trips implies that NTD Metrorail ridership figures for FY2017 will not match those in the Metro Performance Report (MPR) Metrobus Unlinked Passenger Trips In FY2017, total ridership for Metrobus was 123,124,352 unlinked trips, as shown in Table 13. Table 13: Metrobus Ridership, UPT (FY2017) Ridership Metric Total Trips Units Unlinked Passenger Trips 123,124,352 Trips 65 Source: NTD, Form S Additional Notes: 1. The NTD reports unlinked passenger trips (UPT), which is the number of passenger boardings. Metrobus directly records bus passenger boardings Passenger Miles Traveled Passenger miles traveled (PMT) indicates the total sum of miles traveled by all passengers aboard the transit service. A single passenger traveling 10 miles by bus would count as 10 passenger miles traveled. As with UPT, a higher PMT figure indicates greater patronage of transit services, providing insight into both UPT and distances traveled by passengers Metrorail Passenger Miles Traveled In FY2017, the total passenger miles traveled for Metrorail was 1,326,262,650, as shown in Table 14. Table 14: Metrorail Ridership, PMT (FY2017) Ridership Metric Total Miles Units Passenger Miles Traveled 1,326,262,650 Miles Source: WMATA NTD, Form S Metrobus Passenger Miles Traveled In FY2017, total passenger miles traveled for Metrobus was 369,020,804, as shown in Table See Unlinked Passenger Trips in 8.1 Definitions. 66 Form S 10 is the NTD Service form. 67 Ibid Report on the Performance and Condition of the Washington Metropolitan Area Transit Authority 31
68 Table 15: Metrobus Ridership, PMT (FY2017) Ridership Metric Total Miles Units Passenger Miles Traveled 369,020,804 Miles Source: WMATA NTD, Form S Conclusion This report summarizes safety, operating, financial and ridership information on the state of WMATA s rail and bus systems, responding to the mandate of HB1539/SB856 (2018). In addition, this report summarizes cost control and operational improvement strategies proposed by NVTC to improve the efficiency of WMATA s rail and bus systems. In the future, WMATA will provide NVTC with the information necessary to report on the use of funds from the Commonwealth s WMATA Capital Fund. 68 Ibid Report on the Performance and Condition of the Washington Metropolitan Area Transit Authority 32
69 8. Appendix This appendix includes definitions and sources for the terminology used throughout the report Definitions To provide a holistic picture of WMATA s safety, reliability, financial and ridership performance, the definitions below have been aggregated from the following sources as indicated in the footnotes: 1. When not indicated otherwise, definitions are taken directly from the NTD Glossary For metrics without a NTD definition, a definition is taken from WMATA s FY2018 Metro Performance Report (MPR) 70. MPR definitions also include an explanation of what each metric mean[s] and why it is important to [their] strategy. These explanations are included along with the definitions. 3. To build a complete understanding of each MPR definition, WMATA provided NVTC with clarifications, which are denoted with the footnote Provided by WMATA. C Collision A vehicle/vessel accident in which there is an impact of a transit vehicle/vessel with: another transit vehicle, a non transit vehicle, a fixed object, a person(s) (suicide/attempted suicide included), an animal, a rail vehicle, a vessel, or a dock. Cost per Service Hour 71 The average cost to operate one vehicle/passenger car for one hour of passenger service. D Deadhead The miles and hours that a vehicle travels when out of revenue service. Deadhead includes: 1. Leaving or returning to the garage or yard facility 2. Changing routes 3. When there is no expectation of carrying revenue passengers 69 FTA. National Transit Database (NTD) Glossary. April 12, WMATA. Metro Performance Report. Fiscal Year Federal Transit Administration (FTA) Metrics. < product/2015 metrics> Report on the Performance and Condition of the Washington Metropolitan Area Transit Authority 33
70 Deadhead does not include: 1. Charter service 2. Operator training 3. Maintenance training Derailments Non collision incidents in which one or more wheels of a vehicle unintentionally leaves the rails. F Farebox Recovery Ratio 72 The portion of operating expenses that are paid for by fare revenues. This metric is calculated as: Fare Revenue Operating Expenses. Fare Revenue All income directly earned from carrying passengers, paid either in cash or through pre paid tickets, passes, etc. It includes donations from those passengers who donate money on the vehicle, reduced fares paid by passengers in a user side subsidy arrangement, or payments made through an agreement to provide fare free service for a certain group, e.g. payments from a university to provide free service to students. It also includes base fare, zone or distance premiums, express service premiums, extra cost transfers, and special transit fares. Fatality A death or suicide confirmed within 30 days of a reported incident. Does not include deaths in or on transit property that are a result of illness or other natural causes. Fire Uncontrolled combustion made evident by flame that requires suppression by equipment or personnel. Failure, Metrobus 73 WMATA counts as failures those buses with interrupted trips due to mechanical problems that resulted in lost trips. Therefore, only bus maintenance chargeables (BMCs) are counted. Major failures are BMCs that may leave the bus stranded on the street or result in grossly unsafe operation. Examples: brakes, door interlock, generator, smoke/fire, large fluid leaks, engine or transmission shutdown, broken wipers on rainy days. ( Accidents caused by mechanical failure (i.e. brakes not engaging) are counted as major.) 72 Instead of farebox recovery ratio, the Federal Transit Administration (FTA) uses the term recovery ratio per the FTA 2015 Metrics: product/2015 metrics. This definition is adapted from the FTA Metrics list. 73 Provided by WMATA. Report on the Performance and Condition of the Washington Metropolitan Area Transit Authority 34
71 Minor failures are BMCs that may be deemed unsafe by the operator, manufacturer, or engineers to protect the bus from irreparable damage. Examples: engine/transmission malfunction indicators, windshield, mirrors, unsafe interior or exterior body issues. Failure, Metrorail 74 WMATA defines a railcar failure as a mechanical failure that requires corrective maintenance. Failures related to operator error or customer behavior, e.g. doors that fail because they were held open by customers, are not counted. Not all failures prevent vehicles from completing scheduled revenue trips or starting the next scheduled revenue trips. In some cases, corrective maintenance can be conducted after the scheduled trips are completed. Fringe Benefits The payments or accruals to others (insurance companies, governments, etc.) on behalf of an employee and payments and accruals directly to an employee arising from something other than a piece of work. These payments are transit agency costs over and above labor costs, but still arising from the employment relationship. It does not include other post employment benefits (OPEB) recorded under GASB 45. H Headway The time interval between vehicles moving in the same direction on a route. I Injury Any damage or harm to persons as a result of an event that requires immediate medical attention away from the scene. L Linked Passenger Trips 75 A linked passenger trip is counted when a customer enters through a faregate. In an example where a customer transfers between two trains to complete their travel one trip is counted. Metrorail reports linked passenger trips. 74 Ibid 75 WMATA. Metro Performance Report. Fiscal Year Report on the Performance and Condition of the Washington Metropolitan Area Transit Authority 35
72 Labor (Cost) 76 The pay and allowances due employees in exchange for the labor they provide on behalf of the transit agency. The labor allowances include payments made directly to the employee arising from the performance of a piece of work. M Major Event Report (S&S 40) 77 The Major Event Report (S&S 40) captures detailed information on severe safety and security events that occur within a transit environment. Agencies must complete one S&S 40 per reportable event, regardless of how many thresholds an event meets. A reportable event is one that meets any NTD reporting threshold (detailed below) and occurs: On transit right of way or infrastructure; At a transit revenue facility; At a maintenance facility or rail yard; During a transit related maintenance activity, or Involves a transit revenue vehicle. Mean Distance between Delays 78 The average number of miles traveled before a railcar experiences a failure that leads to a delay of four or more minutes 79. This is equivalently expressed as: Total railcar revenue miles Number of failures during revenue service resulting in delays of four or more minutes. Some car failures result in inconvenience or discomfort but do not always result in a delay of service, such as hot cars. Mean distance between delays includes those failures that had an impact on customer on time performance. Mean Distance between Failures 80 The average number of miles traveled before a mechanical breakdown requiring the bus to be removed from service or deviate from the schedule. This can also be expressed as: Total revenue miles Total number of failures The NTD uses labor as the metric for labor cost. 77 Adapted from: National Transit Database. NTD Safety & Security Reporting Manual. pp < safety and security policy manual.pdf> 78 WMATA. Metro Performance Report. p. 44. Fiscal Year See Failure, Metrorail in 8.1 Definitions. 80 WMATA. Metro Performance Report. p. 44. Fiscal Year See Failure, Metrobus in 8.1 Definitions. Report on the Performance and Condition of the Washington Metropolitan Area Transit Authority 36
73 Mean distance between failures is used to monitor trends in vehicle breakdowns that cause buses to go out of service and to plan corrective actions. Factors that influence fleet reliability include vehicle age, quality of maintenance program, original vehicle quality, and road conditions affected by inclement weather and road construction. N Non Labor Costs The costs associated with operating expenses less labor cost 82, including: 1. Fuel/Lube 2. Tires/Tubes 3. Other Materials/Supplies 4. Utilities 5. Casualty/Liability Costs 6. Taxes O On Time Performance (Metrobus), adherence to schedule 83 On time performance is calculated through: Number of time points 84 that arrived on time by route based on a window of 2 minutes early and 7 minutes late Total number of time points delivered (by route). This indicator summarizes how closely Metrobus adheres to published route schedules on a system wide basis. Factors that influence on time performance are traffic congestion, inclement weather, scheduling, vehicle reliability, and operational behavior. On Time Performance (Metrorail) 85 On time performance is calculated differently for peak and off peak: Peak: Number of station stops delivered within the scheduled headway plus two minutes during rush (AM/PM) service Total station stops delivered 82 Categories under Operating Expenses are based on NTD Definition. Federal Transit Administration. National Transit Database: Policy Manual. January < ntd policymanual_2.pdf> 83 WMATA uses adherence to schedule to describe Metrobus on time performance. Washington Metropolitan Area Transit Authority. Metro Performance Report. p. 19. Fiscal Year < Metro Performance Report.pdf> 84 See Time Point in 8.1 Definitions. 85 WMATA. Metro Performance Report. p. 18. Fiscal Year Report on the Performance and Condition of the Washington Metropolitan Area Transit Authority 37
74 Off peak: Number of station stops delivered up to 150 percent of the scheduled headway during non rush (midday and evening) Total station stops delivered The calculation combining both time periods 86 is calculated as: (Number of peak station stops delivered on time + Number of off peak station stops delivered on time) (Total number of station stops) The peak and off peak hours are: 1. Peak periods: AM rush (approximately 6 9:30 a.m.) and PM rush (approximately 3:15 6:30 p.m.) 2. Off peak periods: Midday (approximately 9:45 a.m. 3 p.m.) and Night (approximately 6:45 p.m. to close) Station stops are tracked system wide, except for terminal and turn back stations. The train is said to be on time if it arrives at the station stop within the headway + two minutes time window during rush (AM/PM) or 150 percent of the headway during the non rush (Midday/Night). The exact times vary by station and align with the time when scheduled headways even out. On time performance is not measured during ramp up and ramp down periods, when Metro transitions between rush and non rush service periods, due to variable headways. Train on time performance measures the adherence to weekday headways or the time customers wait between trains. Factors that can influence on time performance include: infrastructure conditions, missed dispatches, railcar delays, e.g. doors, or delays caused by sick passengers. Station stops are tracked system wide, with the exception of terminal and turnback stations. Operating Expenses These expenses include labor and non labor costs, and services for operating and maintaining the mode, including general administration costs. Labor costs are fully loaded, meaning they include fringe benefit costs (directly paid to employees as well as indirectly, e.g. payments to pension funds) in addition to wages and salary costs. 87 P Passenger Miles Traveled (PMT) 88 The cumulative sum of the distances ridden by each passenger. 86 Provided by WMATA. 87 National Transit Database. TS2.1 Service Data and Operating Expenses Time Series by Mode < product/ts21 service data and operating expenses time series mode 0> 88 The NTD refers to Passenger Miles Traveled as Passenger Miles. Report on the Performance and Condition of the Washington Metropolitan Area Transit Authority 38
75 R Revenue Service (Hours) The time when a vehicle is available to the public and there is an expectation of carrying passengers. These passengers either: 1. Directly pay fares 2. Are subsidized by public policy 3. Provide payment through some contractual arrangement Vehicles operated in fare free service are considered in revenue service. Revenue service includes: 1. Layover/recovery time Revenue service excludes: 1. Deadhead Vehicle maintenance testing 3. School bus service 4. Charter Service S Security Event An occurrence of a bomb threat, bombing, arson, hijacking, sabotage, cyber security event, assault, robbery, rape, burglary, suicide, attempted suicide (not involving a transit vehicle), larceny, theft, vandalism, homicide, CBR (chemical/biological/radiological) or nuclear release, or other event. Service per Rider 90 A performance metric that measures the ratio of vehicle revenue hours to unlinked passenger trips. Note that in this report, this ratio is scaled by a factor of 10,000 for readability. T Time Point A time point is an exact point in time at which Metro service is provided. Time points can be anywhere along the route, including an intersection. Adherence to schedule is measured as the 89 See Deadhead in 8.1 Definitions. 90 Department of Rail and Public Transportation (DRPT). Review of WMATA Operating, Governance and Financial Conditions. March < report.pdf> Report on the Performance and Condition of the Washington Metropolitan Area Transit Authority 39
 The number of passengers who board public transportation vehicles.")

76 bus leaves each time point except the last for each run. Time point is used in the definition of on time performance for Metrobus. U Unlinked Passenger Trips (UPT) The number of passengers who board public transportation vehicles. Passengers are counted each time they board vehicles no matter how many vehicles they use to travel from their origin to their destination. Metrobus reports unlinked passenger boardings. V Vehicle Revenue Hours The hours that a vehicle actually travels from the time it pulls out of its garage to enter passenger service to the time it returns. Vehicle revenue hours are often called platform time. Report on the Performance and Condition of the Washington Metropolitan Area Transit Authority 40
 524-3322 fax: (703) 524-1756 www.novatransit.org Twitter @novatransit www.facebook.")
77 NORTHERN VIRGINIA TRANSPORTATION COMMISSION 2300 Wilson Boulevard, Suite 620 Arlington, VA tel: (703) fax: (703)