EXISTING CLIENT BASE OF 2500 URBAN AREAS. Munich Manchester Milan Mumbai Beijing Atlanta, Georgia Tallahassee, Florida. Sacramento, California
|
|
|
- Emil Cannon
- 5 years ago
- Views:
Transcription

1 MOBILITY ANALYTICS

2 Formed in 2001, bringing together three widely used modeling suites: TRIPS, TRANPLAN, and TP+ Esri Business Partner since 2005, the Esri Geodatabases have been Citilabs primary data format since Based in Sacramento, California with regional offices in: Munich Manchester Milan Mumbai Beijing Atlanta, Georgia Tallahassee, Florida Sacramento, California EXISTING CLIENT BASE OF 2500 URBAN AREAS SELECTED KEY CITIES: London, Paris, Milan, Moscow, Abu Dhabi, Delhi, Bangkok, Singapore, Beijing, Hong Kong, Manila, Melbourne, Lima, San Francisco, Atlanta, Washington, Miami SELECTED STATE & NATIONAL GOVERNMENTS: England, Scotland, Netherlands, France, Italy, Norway, India, Thailand, Taiwan, Philippines, California, Ohio, Virginia, Florida

3 Understanding Movement Predict Movement Cube Voyager Avenue Dynasim Land Cargo Measure Movement Streetlytics Sugar Access Manage Movement Streetlytics: Flow

4 CUBE VOYAGER MACROSCOPIC MODELS TO UNDERSTAND LARGE SCALE PERSONAL TRAVEL DEMAND How much induced demand will be generated if a road is widened? How much traffic will a new development generate? How many passengers will be lost if bus services are cut back? How many people will be priced out if tolls are implemented?

5 CUBE AVENUE MESOSCOPIC SIMULATION TO MODEL THE DYNAMICS OF CONGESTION THROUGHOUT A DAY How are the toll entrances and revenue streams at a certain time? How do vehicles divert from a blocked road? What is the queuing time? What is the backup delay at peak hours? How many vehicles are entering the highways at a certain time? Isolate Queues by Length and Time


6 CUBE DYNASIM MICROSCOPIC TRAFFIC SIMULATION TO MODEL ALL ASPECTS OF TRAFFIC OPERATIONS AND PARKING Can people efficiently alight and board their train at a station? What is the best signal and ITS strategy for a congested corridor? How long will a vehicle circulate a parking lot before finding a spot?

7 CUBE LAND TO PREDICT LAND-USE CHANGES GIVEN MODIFICATIONS TO THE TRANSPORTATION SYSTEM What is the optimal allocation of subsidies? How does an area develop when adding infrastructure? What would the rent and land value be? What is the effect of new policies and zoning? What is the area s attractiveness and accessibility?

8 CUBE CARGO TO MODEL FREIGHT MOVEMENT THROUGHOUT A CITY OR REGION TO UNDERSTAND THE IMPACTS OF COMMODITY FLOWS How much demand will I lose if I raise shipping costs? How are commodities moved by truck in a region? What if major freight facilities are developed?


9 TO UNDERSTAND HOW PEOPLE MOVE KNOW WHO, WHEN, WHERE, WHY & HOW Who sees these billboards? Where do people in this neighborhood work? Who uses this road? Where do the people at this restaurant live?


10 SUGAR ACCESS TO EXAMINE BOTH LAND USE AND TRANSPORTATION SYSTEMS TO UNDERSTAND THE EASE OF REACHING VALUED DESTINATIONS How long does it take to get to a hospital? How long does it take to walk to a grocery store? How will this project affect access to jobs?


11 MANAGE TRANSIT PERFORMANCE AND OPERATIONS How profitable is this route? Is this bus normally on-time? How long are people waiting at this stop? How many people saw the ad on this train?

12 Streetlytics AirSage/Citilabs Partnership and Out of Home Media

13 Population Analytics Insights before Streetlytics: Volumes Demographics at the Residence level Streetlytics Insights: Demographics Anywhere Enhanced Demographics and Segmentation Origins & Destinations Trip Intent Trip Intent Origins & Destinations Enhanced Demographics Seasonal Variation Day Parting Volume & Resident Demo s
14 Big Data Options How to Leverage the Strength of All Available Data

15 Mobile Location Contribution to Streetlytics Fusion Engine

16 Connected Vehicles and Navigation GPS Feeds
: Ad Exchange Software Development Kit (SDK) Providers Direct from App Developers (different focuses) Widely Varying Quality (locational accuracy) Widely Varying Sample Sizes (devices) Widely")
17 Mobile Device GPS Feeds MUCH Less Security (less aggregation) MAY have Permanent Unique Identifiers MAY Expose/Report by Mode Many Providers (11 as of today!): Ad Exchange Software Development Kit (SDK) Providers Direct from App Developers (different focuses) Widely Varying Quality (locational accuracy) Widely Varying Sample Sizes (devices) Widely Varying Data Density (# of Locations per Day)


18 Traffic Counts, Sensors, Beacons 3m+ collected and cleansed ground counts Count Team of 60 FTE Traffic Analysts 4x Verified Count Collection and Dispute Resolution Methodology and Management system Any available counts will be used as inputs for each mode
19 Data Fusion Leveraging the Strengths of All Available Data

20 Streetlytics Process From Data to Insights
21 Streetlytics Applications Streetlytics harnesses publicly available and privately held data, fusing it together to form a complete picture Dataset is created piece by piece to understand the ENTIRE POPULATION Streetlytics is used in different industries Transportation Planning and Operations Out-of-Home Advertising Retail Site Selection Traffic Safety Analysis Public Transport
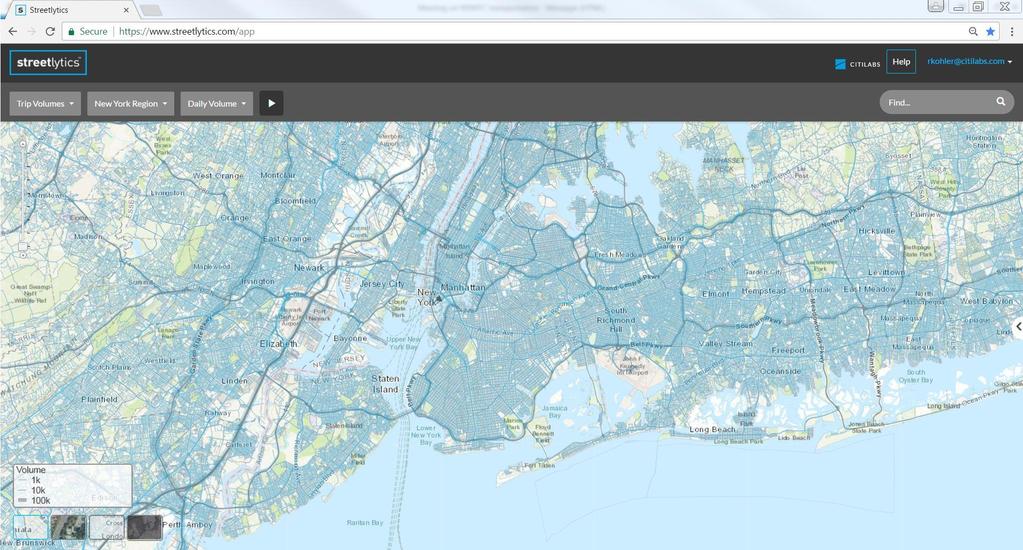
22 Measure Movement with Streetlytics On ANY Street Nationwide
23 Streetlytics Web App View Data in an Online User Interface
24

25 Vehicle Volumes
26 Demographics
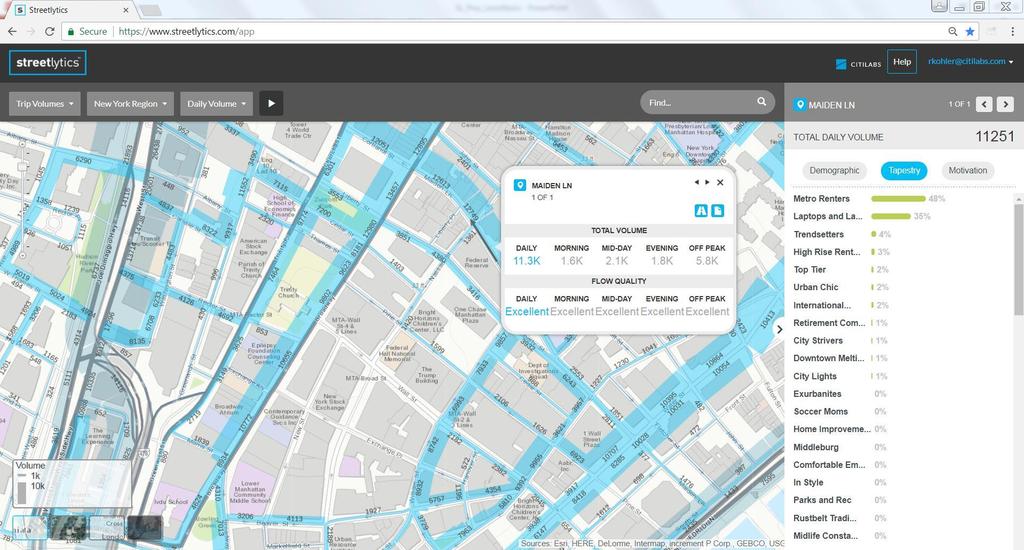
27 Tapestry Segmentation

28 Esri - Tapestry

29 Esri - Tapestry
30 Motivation
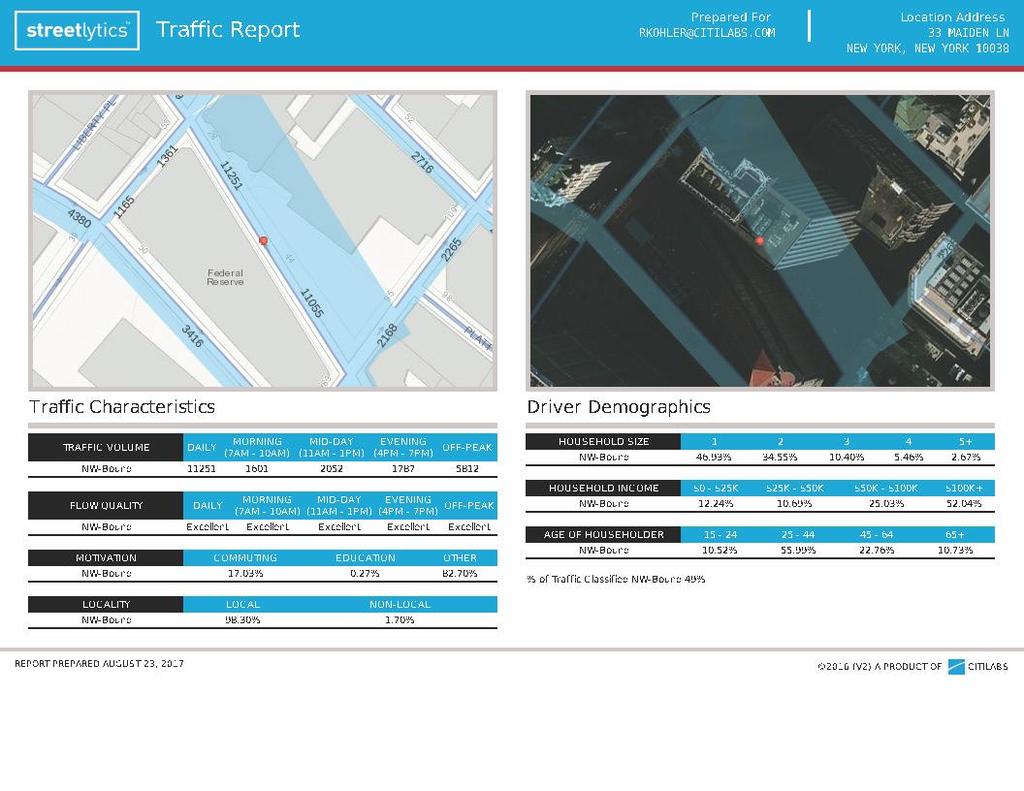
31

32 Trip Patterns
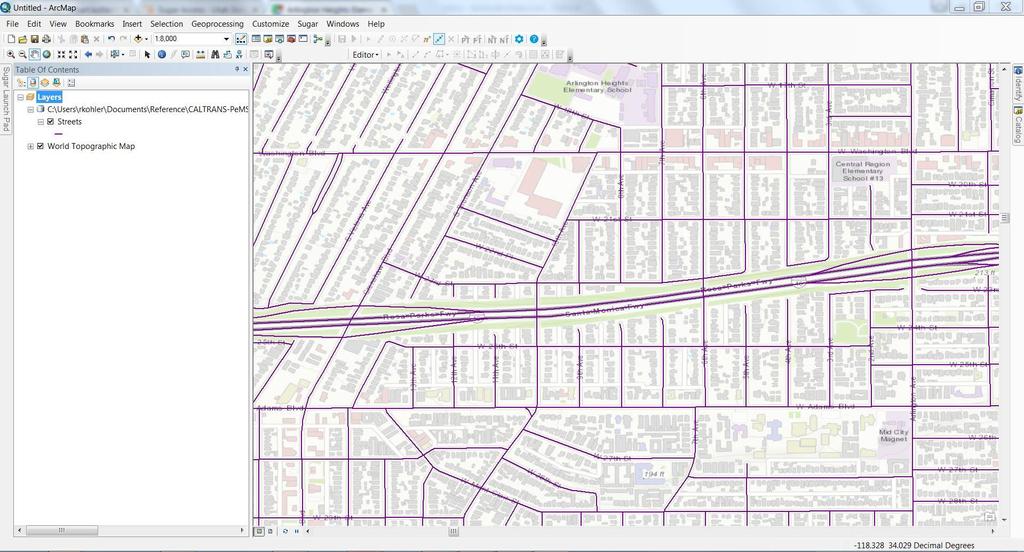
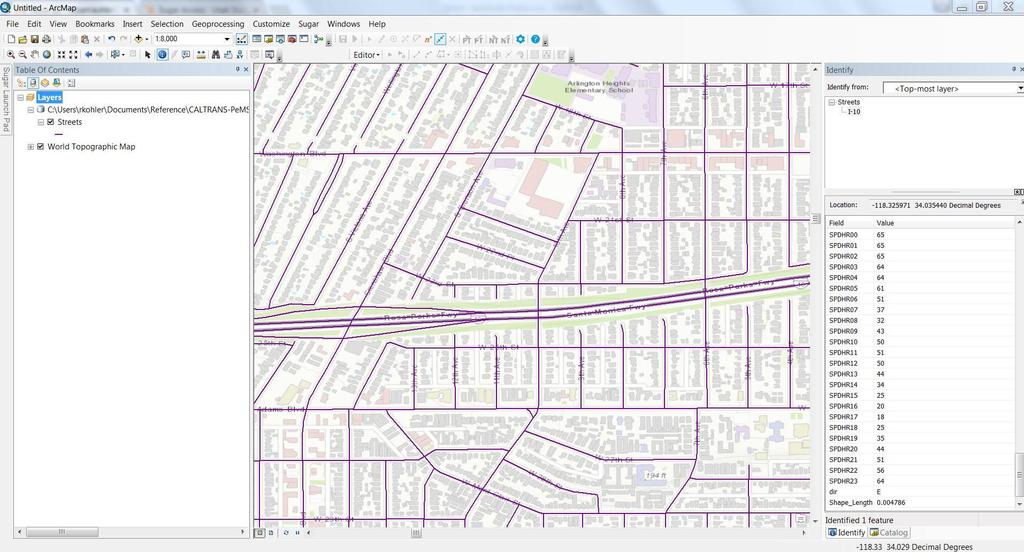
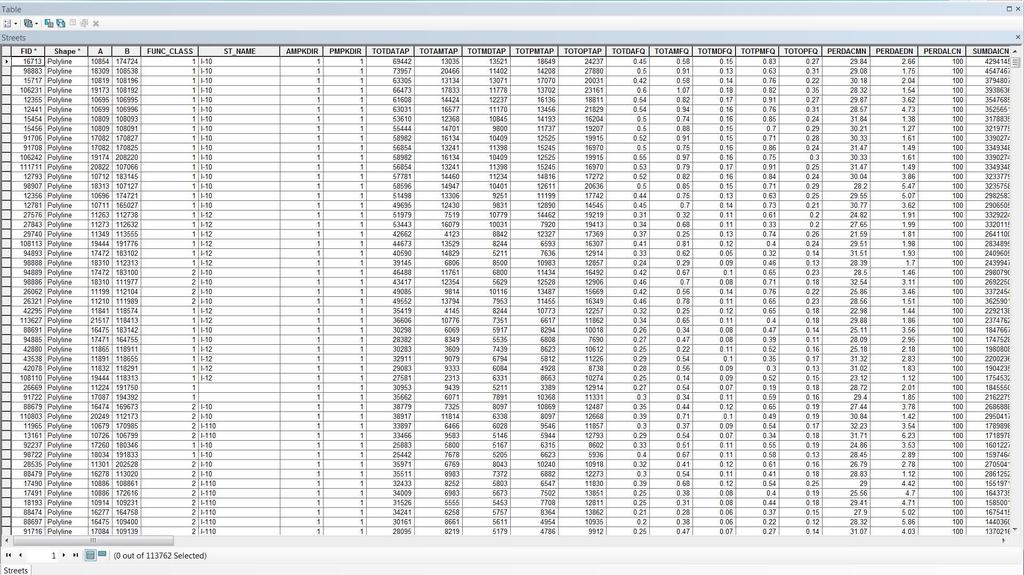
33 Streetlytics On- Premises Dataset Leverage the dataset in ArcGIS
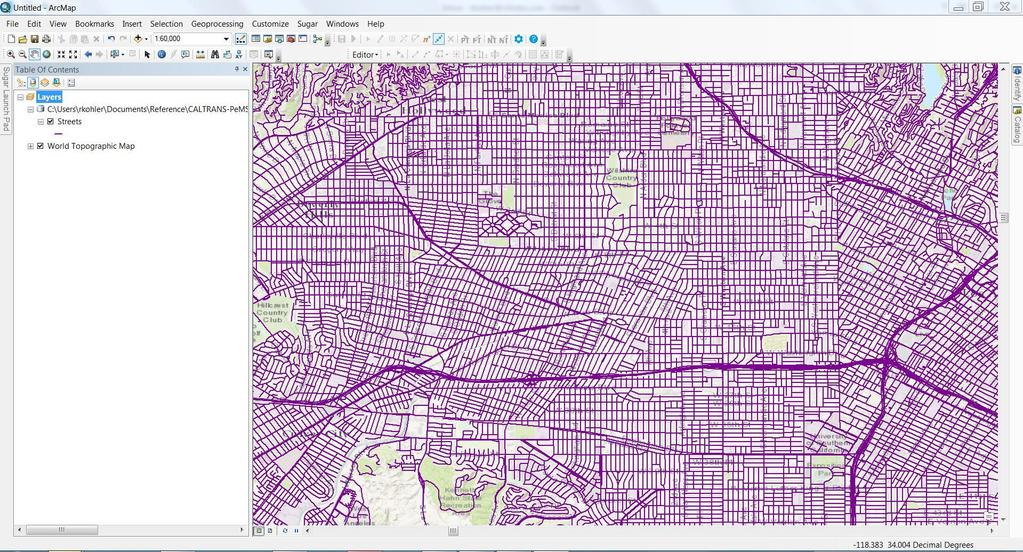
34
35

36
37
38
39
40 Advanced Insights


41 Month over Month Variations Commuter Alert: Northbound Lane Of Major Deegan Expressway To Close For Construction
42 Select Link

43 Select Link Analysis

44 Trip Patterns & Select Link Analysis

45 Regional Home Locations
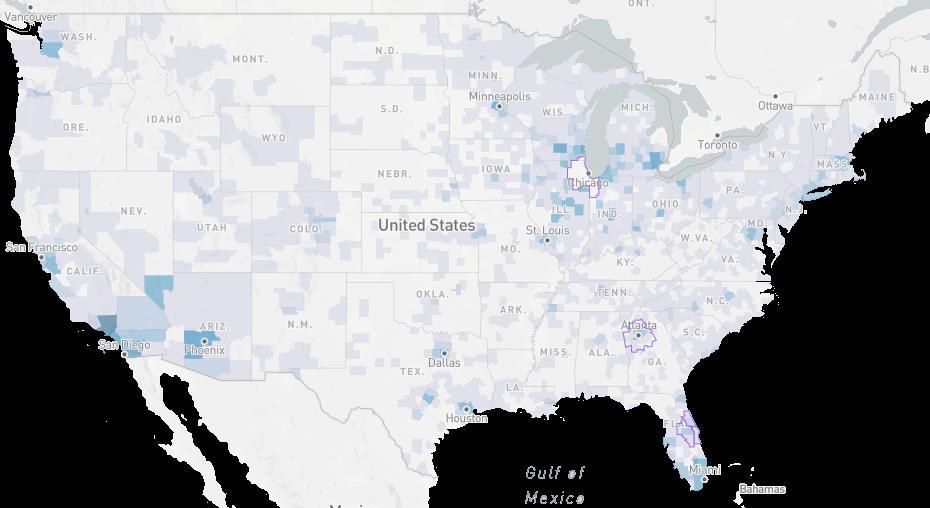

46 Nationwide Home Locations
47 WHO, WHEN, WHERE, WHY & HOW What questions will you answer?
48 Citilabs Mobility Analytics with Streetlytics Robert Kohler