TABLE OF CONTENT. Section 1...Project Overview...Section 1 Page 1 7
|
|
|
- Baldric Robertson
- 5 years ago
- Views:
Transcription
1 TABLE OF CONTENT Section 1...Project Overview...Section 1 Page 1 7 Introduction Project Purpose Project Goals TEA-21 Planning Factors... 5 Public Involvement... 7 Overview of Transportation Modeling System... 7 Section 2...Community Transportation System Guiding Principles...Section 2 Page 1 4 Community Transportation Guiding Principles... 1 Section 3...Historic and Projected Growth...Section 3 Page 1 15 Land Use Historic Population & Employment Growth... 2 Typical 2000 Travel Patterns... 8 Projected Population & Employment Growth Section 4...Streets and Highway Elements...Section 4 Page 1 60 Regional Roadway Network... 1 Local Roadway Network... 4 Levels of Service/Deficiencies Analysis... 9 Current & Projected Travel Patterns High Accident Locations Needs Assessment/Travel Demand Analysis Travel Demand Model Development Alternatives Development Analysis Overall Summary of Alternative Modeling Priority Ranking Program Preferred System Model Selection/Prioritization of Long Range Street & Highway Imp Functional Classification Map Air Quality Conformity TSM Strategies TDM Strategies Estimates of Future Traffic Volumes Section 5...Public Transit and Transportation Element...Section 5 Page 1 15 Existing Public Transit Services... 1 Long Range Transit Improvements... 8 Short Range Transit Improvements Airport Facilities/Access Freight Movement Service & Facilities... 13
2 TABLE OF CONTENT Continued Section 6...Pedestrian & Bicycle Element...Section 6 Page 1 9 Pedestrian Facilities... 1 Current Policies Recent Council Action... 1 Bicycle Facilities Heritage Trail Plan Recommendations... 3 On-Street Primary Bikeways... 7 Multi-Use Trails Section 7...Financial Element...Section 7 Page 1 25 Transportation Financing Options... 1 Local Funding Options... 3 Options to Increase Local Revenues... 4 Federal/State Funding... 5 Summary of Funding Opportunities/Constraints Streets & Highways Funding Element Transit Funding Element Pedestrian & Bicycle Facility Funding Element TABLES Table 1 Billings Current Land Use Table 2 Population Trends & Projections Table 3 Yellowstone County Population Trends Table Journey to Work Statistics Table 5 Billings Forecasted Dwelling Unit Distribution Table 6 Billings Forecasted Employment Distribution Table 7 Level of Service Table 8 Typical Daily Capacity Table 9 Billings Urban Area Total Vehicle Trips Table 10 Vehicle Trip Origins and Destinations Table 11 Criteria Rating Table 12 Long Range Plan Projects Table 13 Short Range & TSM Projects Table 14 Summary System Performance Statistics Table 15 Billings Transit Fixed Route Operating Statistics Table 16 Montana Railroad Trackage Operated in 1996 Table 17 Current Transportation Related Outlays Table 18 Federal and State Funding Sources & Levels
3 FIGURES Figure 1...Billings Study Area Figure 2...Transportation Planning Process Figure 3...Population Trends & Projections Figure Year Historic Neighborhood Population Growth Figure 5...Employment Concentrations Figure 6...Motorized Work Trips Figure 7...Non-Motorized Work Trips Figure 8...Billings 2002 & 2027 Dwelling Unit Distribution Figure 9...Forecasted Dwelling Unit Increase Figure 10...Forecasted Employee Distribution Figure 11...Billings 2002 & 2027 Employment Distribution Figure 12...The Billings Urban Area Relative to the United States Figure 13...The Billings Urban Area Relative to Other Major Cities within Montana Figure 14...Interstate Highways, Major Arterials, etc. Figure Average Daily Traffic with Congested Segments Figure 16...High Accident Locations Figure Congested Roadway Segments Figure 18...Preferred Alternative Figure 19...Long Range Project Locations Figure 20...Functional Class Map Figure 21...Short Range/TSM Project Locations Figure 22...Design Traffic Volumes, Year 2015 Figure 23...Design Traffic Volumes, Year 2025 Figure 24...Recommended Projects Relative to Expected Congestion Design Traffic Volumes, Year 2025 Figure 25...MET Annual Ridership Trends Figure 26...MET Bus Route Map Figure 27...Billings MET Transit Fixed Route Ridership & Cost Trends Figure 28...Billings MET Transit Seasonal Route Figure Work Trips by Bus Figure 30...Railroad Tracks and Major Highway (Truck) Routes Figure 31...On-Street Non-Motorized Transportation Routes Figure 32...Off-Street Non-Motorized Transportation Routes Appendix
4 Section 1. Project Overview Introduction The purpose of this report is to document the planning analysis results and recommendations of the Billings Urban Area 2005 Transportation Plan Administrative Update. The development of this Administrative Update was based on confirmation of the projects, cost data and information provided in the 2000 Transportation Plan. This document is meant to confirm the community principles outlined in the 2000 Plan. This project was guided by the Technical Advisory Committee (listed below), with input from the City Council, County Commissioners, City/County Planning Board, Montana Department of Transportation (MDT), Federal Highway Administration (FHWA), Federal Transit Administration (FTA), various City, County and other public agencies as well as numerous neighborhood groups, private organizations, other interested parties, and the general public. Development of this plan was coordinated with the guidelines developed in the Yellowstone County Growth Policy and in the 2000 Transportation Plan. All of the other references used during development of this plan are listed in Appendix A. Technical Advisory Committee (TAC) Members Scott Walker, City/County Planning Department, TAC Chairman Ramona Mattix, City/County Planning Department Vern Heisler, Billings Public Works Department Dave Mumford, Billings Public Works Department Terry Smith, Billings Traffic Engineering Department Ron Wenger, Billings MET Transit System Mike Davis, Billings MET Transit System Bob Moats, Yellowstone County Public Works Department Lynn Zanto, Montana Department of Transportation - Helena Myron Wilson, Montana Department of Transportation - Billings Project Purposes Transportation planning within the Billings Urban Area has been an ongoing process since the first formal transportation plan was prepared in The plan has been updated in 1969, 1977, 1983, 1990 and This 2005 administrative plan update involves preparation of the 2005 Transportation Plan with a year 2025 plan horizon. The transportation planning process has been under the jurisdiction of the City-County Planning Board throughout its history, with assistance from the Montana Department of Section 1 Page 1
5 Transportation (MDT), Federal Highway Administration (FHWA) and Federal Transit Administration (FTA). The purposes of this administrative update are: 1) to confirm the Billings area surface transportation system, including the roadway network, public parking facilities, transit and paratransit services, pedestrian/bikeway facilities, and the freight movement system including trucking and rail; 2) to confirm regional, community-wide, and neighborhood issues and needs related to the transportation system; 3) to confirm future travel demand and transportation needs for the years 2005, 2015 and 2025; 4) to re-evaluate alternative transportation improvements; 5) to confirm short-range and longrange transportation system improvements; 6) to identify funding sources and opportunities; and 7) to develop a fiscally-constrained, multi-modal 2005 Transportation Plan for the Billings Urban Area as shown in Figure 1 on the following page. The intent was to develop the most appropriate long-range (Year 2025) transportation plan for the Urban Planning Area depicted in Figure 1, given expected growth and development patterns, as well as desired travel patterns. This 2005 update was not intended to address all of the small-scale transportation issues such as pothole problems, snow plowing, sign placement, speed limits, bus schedules, etc. Those issues are more appropriately addressed by sub-area plans, studies, construction projects, and the ongoing efforts of the designated agencies such as the Public Works Department, Traffic Engineering Department, and the MET transit system. This plan also implemented the Billings Urban Area Priority Ranking Program. This program provided an organized and logical approach to the development of the Billings Transportation System projects. Through this process, a project ranking was established and project rank assigned. This project ranking can provide support for each project as the local Capital Improvement Plan (CIP) is adopted. This plan fits into the Transportation Planning Process as illustrated in Figure 2. Section 1 Page 2
6 Figure 1: Billings Study Area Section 1 Page 3
7 Figure 2 - Transportation Planning Process TRANSPORTATION PLANNING PROCESS BILLINGS AND YELLOWSTONE COUNTY PROJECT IDENTIFIED BY TRANSPORTATION PLAN PROJECTS NOMINATED THROUGH AND/OR REVIEWED BY TECHNICAL ADVISORY COMMITTEE (PUBLIC MEETING) YELLOWSTONE COUNTY BOARD OF PLANNING (PUBLIC MEETING) BILLINGS CITY COUNCIL (PUBLIC MEETING) YELLOWSTONE COUNTY COMMISSION (PUBLIC MEETING) MONTANA DEPARTMENT OF TRANSPORTATION (BILLINGS) RECOMMENDATIONS POLICY COORDINATING COMMITTEE (PUBLIC MEETING) MONTANA DEPARTMENT OF TRANSPORTATION (HELENA) FEDERAL HIGHWAY ADMINISTRATION FEDERAL TRANSIT ADMINISTRATION TRANSPORTATION PLANNING FLOWCHART Section 1 Page 4
8 Project Goals The Technical Advisory Committee confirmed the following project goals to guide the development of this 2005 administrative update of the Transportation Plan: Goal 1. To develop a transportation plan that accurately reflects community needs, values, desires, and goals; is consistent with other plans and policies; and helps to shape the future development of the community. Goal 2. To develop a transportation system that is safe, efficient and effective, that also maximizes the benefits for the costs. Goal 3. To maximize the functional integrity of the transportation system. Goal 4. To identify deficiencies and needs in the transportation system and to identify appropriate improvements. Goal 5. To provide mitigation of impacts caused by the transportation system on adjacent land uses. Goal 6. To ensure a realistic, multi-modal approach to the transportation system including transportation system management (TSM) and travel demand management (TDM) approaches. Goal 7. To consider all potential funding sources for transportation improvements including innovative, non-traditional methods. Goal 8. To prioritize projects based on anticipated needs and available funding. Goal 9. To involve the public and develop clear understanding of the plan. Goal 10. To develop new roadway routes sufficiently to allow right-of-way preservation and/or acquisition. TEA-21 Planning Factors The Billings Urban Area followed the transportation planning process set forth in Title 23 of the United States Code during the confirmation of this 2005 Transportation Plan. Section 134(a) states: (1) It is in the national interest to encourage and promote the safe and efficient management, operation and development of surface transportation systems that will serve the mobility needs of people and freight and foster economic growth and development within and through urban areas, while minimizing transportation-related fuel consumption and air pollution. Section 1 Page 5
9 (2) To accomplish the objective stated in paragraph (1), metropolitan planning organizations, in cooperation with the State and public transit operators, shall develop transportation plans and programs for urban areas of the State. (3) The plans and programs for each metropolitan area shall provide for the development and integrated management and operation of transportation systems and facilities (including pedestrian walkways and bicycle transportation facilities) that will function as an intermodal transportation system for the State and the United States. (4) The process for developing the plans and programs shall provide for consideration of all modes of transportation and shall be continuing, cooperative, and comprehensive to the degree appropriate, based on the complexity of the transportation problems to be addressed. Section 134(f) of the Act states: "The metropolitan transportation planning process for a metropolitan area shall provide for consideration of projects and strategies that will: (A) support economic vitality of the metropolitan area, especially by enabling global competitiveness, productivity, and efficiency; (B) increase the safety and security of the transportation system for motorized and non-motorized users; (C) increase the accessibility and mobility options available to people and for freight; (D) protect and enhance the environment, promote energy conservation, and improve quality of life; (E) enhance the integration and connectivity of the transportation system, across and between modes, for people and freight; (F) promote efficient system management and operation; and (G) emphasize the preservation of the existing transportation system." These seven planning factors are a consolidation of the 16 planning factors previously considered in the development of long range transportation plans under the Intermodal Surface Transportation Efficiency Act (ISTEA) which was the predecessor legislation to TEA-21. The emphasis is on the growing importance of operating and managing the transportation system carefully, efficiently and more effectively to enhance the productivity of the transportation system. The Act also allows Metropolitan Planning Organizations (MPO s) to include in long range transportation plans an illustrative list of projects that would be included if additional resources were available. The illustrative list does not affect the fiscal constraint requirement of the plan. Section 1 Page 6
10 Public Involvement Process Public involvement and input are essential to the success of any transportation plan. As previously indicated, this Billings Urban Area 2005 Transportation Plan Administrative Update was developed with consideration of regional, community-wide and neighborhood issues and needs related to the transportation system. To ensure ample opportunity for public involvement throughout the transportation planning process, the following actions were taken: Planning staff met with various neighborhood and other interest groups throughout the transportation planning process to discuss their concerns, issues and improvement preferences. The City maintained a mailing list of interested parties. Presentations of the Draft Transportation Plan to the City Council, County Commission and City/County Planning Board meetings were open to the public for comment. Public comment was taken at each meeting. Overview of Transportation Modeling System MDT staff worked closely with the Billings-Yellowstone County Metropolitan Planning Organization in the update of the travel demand forecasting for the Billings Urban Area. The purpose of the model is the analysis of existing travel demand patterns, and the forecasting of expected future travel demand, based on increases in population and employment in the Billings Urban Area to identify future demands on transportation system. The MDT staff uses the QRSII modeling software platform for travel demand estimation, and developed 452 Traffic Analysis Zones (TAZs) which encompasses all of the census geography in and around Billings including an inventory of dwelling units, socioeconomic measures of median family income and vehicles per household. The roadway network includes over 4,000 links, including the functionally classified roads in the Billings Urban Area that represent the Interstate, Principal Arterials, Minor Arterials, and Collectors, as well as many of the local streets. The travel demand model was originally calibrated to replicate actual 1996 traffic conditions, but for this endeavor it was updated to the 2002 traffic levels. In the Billings Urban Area 2000 Transportation Plan, the model was developed from the 1990 Census, brought up to the then current condition with the use of building permits for the period 1991 to The travel demand forecast model efforts for this plan update are based on the 2000 Census and a tabulation of two years of building permits in the greater Billings Urban Area bringing it up to the 2002 condition. Employment data was developed from the Department of Labor and Industry s 202 File from the third quarter of Traffic patterns generated by the travel demand model were validated in comparison with empirical data provided by the Billings Traffic Count Program statistics. MDT staff also used the Geographic Information System (GIS)-based TransCAD travel demand software to present TAZ level information and to illustrate future traffic patterns. Figure 30 and Figure 31 show future traffic volumes for 2015 and Section 1 Page 7
11 Section 2. Community Transportation System Guiding Principles Introduction The 2005 Yellowstone County & City of Billings Growth Policy identified numerous goals, policies and implementation strategies to guide future development of the community. These focused on land use and growth management, economic factors, housing, community resources, historic preservation, public safety, urban and rural transportation, public facilities, agriculture, and environment. Previously developed plans for the various Billings neighborhoods also identify goals and strategies to guide their preservation and future development. This 2005 Administrative Update was developed with the intent of incorporating previous plans, providing the most appropriate regional, community-wide, and neighborhood transportation improvements, and improving mobility and the quality of life throughout the Billings Urban Area. Several of the key 2003 Growth Policy goals that are relevant to transportation include: Safe and efficient traffic circulation. Safe traffic speeds. Reduce traffic accidents. Visually appealing rights-of-way. A safe and efficient transportation system characterized by convenient connections and steady traffic flow. Safe standards for city and county streets. Consideration of all neighborhoods when allocating transportation improvement funds. Reduce traffic congestion. Well maintained interconnecting sidewalks. Community Transportation Guiding Principles In order to guide the development of short-range and long-range transportation system improvements for the Billings Urban Area with consideration of regional, community-wide and neighborhood issues and needs, the following 30 transportation guiding principles were developed. These guiding principles were based on the 1990 Comprehensive Plan goals and confirmed in the 2005 Plan Update. The criteria developed received input from the public and the Technical Advisory Committee. These guiding principles also tie to the seven planning factors identified in the TEA-21 legislation as described in the previous section. 1. Overall quality of life in the community will be an important criterion in transportation system decisions. 2. Billings transportation and land use decisions will be mutually supportive. Land use decisions regarding the form and character of the City will ensure that the transportation Section 2 Page 1
12 system can support many modes of travel. Billings will promote mixed-use development so there is less need for people to travel and so travel distances are shorter. 3. The physical organization of the City will be supported by a framework of transportation alternatives that maximizes access and mobility throughout the City, while reducing dependence upon the private automobile. 4. The City will implement land use patterns, parking policies, and demand management plans that support an efficient roadway system, effective transit service, and use of alternative transportation modes, to ensure that the annual rate of growth in total daily vehicle miles of travel (VMT) does not exceed the rate of growth in population and employment. 5. The City will continue to actively pursue all available funding for transportation improvements, including federal, state, local, private and innovative sources. 6. The City will provide a balanced transportation system recognizing the needs of the wide variety of transit users, drivers, pedestrians, bicyclists and all users of the transportation system. 7. Billings will develop and maintain a high quality transportation system incorporating many modes of travel and related systems including: - roadway network - public parking - transit and paratransit systems - pedestrian and bikeway facilities - freight movement - rail and truck 8. Billings transportation system will be integrated with nearby county, state and national systems. 9. The City will ensure the provision of adequate facilities for the movement of people and goods while maintaining the integrity of existing streets and minimizing travel-related impacts within residential neighborhoods. As growth occurs, appropriate transportation investments will be made to support increased demands for travel. 10. Neighborhood streets will provide an attractive and safe environment for pedestrians, bicyclists and drivers, with well-designed streetscape features. 11. Street standards and site planning requirements for development and redevelopment will ensure direct accessibility by pedestrians, bicyclists, transit vehicles and cars. 12. The City will provide transit services and non-motorized travel opportunities to support development of activity centers in a manner that minimizes single occupant automobile travel. 13. The City will provide integrated, high frequency transit service along major transportation corridors and provide linkages between major trip origins and destinations. Section 2 Page 2
13 14. The City will promote travel demand reduction measures such as telecommuting and inhome businesses, electronic communications, variable work weeks and flextime, to reduce automobile trips, congestion, noise and air pollution. 15. The City will implement the Heritage Trail program, encourage bicycling as a viable alternative to automobile use for all trip purposes, and ensure safe and convenient facilities with good access to residential neighborhoods and major activity centers. 16. The City will encourage pedestrian travel as a viable transportation mode and provide direct pedestrian connections among residential areas, schools, activity centers, work and public facilities. 17. The City s investment in streets, sidewalks and bicycle facilities will be protected through a proactive, high quality maintenance program. 18. The City will enhance the visual quality of the transportation system and mitigate impacts of automobiles on pedestrians, bicyclists and neighborhoods by incorporating streetscape design in all transportation facilities and maintaining them as attractive public spaces. 19. The design of streets will complement their function and the distinctive character of their respective neighborhoods and will serve to connect rather than separate adjoining neighborhoods. 20. Gateways to the City will be highlighted by special treatments such as landscaping, distinctive artwork, monuments and signage. 21. Downtown Billings will maintain its unique streetscape, and other neighborhoods will continue to develop their own trademark characteristics and landmarks. 22. Billings will continue to maintain a systematic hierarchy of functionally classified roads, with major roads, arterials and highways carrying the highest traffic volumes and accommodating longer distance trips. Local streets provide access to land uses but carry very little through-traffic, and collector roads connect the local street system to the major roads. 23. The Billings Urban Area will achieve and maintain level of service C (minimal travel delay) on all major roadways for the 20-year planning horizon. This Transportation Plan will identify the locations where LOS C currently or is anticipated to be exceeded, determine the appropriate improvements and their associated cost to achieve LOS C," and determine whether there is available funding to support the improvements. In some cases, the cost of improvements may be prohibitive given available funding, and the City may have to settle for LOS D at certain locations during peak demand periods. 24. Billings will encourage harmonization and traffic calming in residential neighborhoods to provide a higher level of travel comfort and convenience in the community, while ensuring the safe and efficient movement of traffic. 25. Billings transportation system will enable safe and efficient travel for non-motorized modes including sidewalks, safe school routes and bicycle networks. Section 2 Page 3
14 26. The City will develop a transportation network serving the needs of the community while recognizing the integrity of the neighborhoods, without forming barriers between neighborhoods. 27. Neighborhoods will be safe, attractive places that encourage walking, bicycling and social interaction. 28. Citizen input and guidance will be sought and incorporated throughout the transportation planning process. 29. Billings will ensure that the transportation system is sensitive to and mitigates impacts to the environment, especially in the areas of air quality and noise. 30. The City will continue to facilitate development of an efficient freight movement system, with convenient truck routes, intermodal transfer facilities, and safe railroad crossings. In summary, these 30 guiding principles can be boiled down to the following core guiding principles: The Billing Urban Area will continue to place emphasis on a high quality, multi-modal transportation system that: is safe; is effective in meeting motorized and non-motorized mobility needs for people and goods; is effective in terms of providing the best transportation services and facilities for the cost; is appropriate to serve the needs of the region, the community and the neighborhoods; and is a key contributor to the overall quality of life in the Billings Urban Area. Section 2 Page 4
15 Section 3. Historic & Projected Growth Background The Billings Urban Area lies at the western edge of the northern High Plains. It serves as the most important center for a large region comprised of eastern Montana, northern Wyoming, and the western Dakota s. Billings is the largest city between Minneapolis and Spokane, and between Denver and Calgary. Due to its location, Billings has developed as an important economic, cultural, educational and transportation urban center for the entire region. The Billings Urban Area consists of several neighborhoods as shown previously in Figure 1, which have the land use and socioeconomic characteristics described below. The neighborhoods are aggregations of various census tracts. Land Use The Billings Urban Area currently encompasses approximately 145 square miles and includes all of the City of Billings (39.4 square miles) as well as a planning area extending 4-1/2 miles outside of the City limits and into Yellowstone County, as shown previously in Figure 1. In 1980, the City limits included an area of 20.3 square miles; and in 1970, the City area was 14.7 square miles. Between 1970 and 1990, the City land area more than doubled (increased about 116%). Between 1990 and 2000 the City added only 1 square mile. Since 2000 the area has increased to 39.4 square miles, a 20% increase in four years. The Billings Urban Area has the following amounts of residential, commercial, industrial, public land including parks and streets/parking, and vacant/agricultural land as shown in Table 1. Table 1 Billings Current Land Use (sq. miles) Zoned Land Use Total Urban Area City Limits Only Square Miles % of Total Square Miles % of Total Public % % Residential % % Commercial % % Industrial % % Medical Corridor % % S. 27 th Street % % Agricultural % % Entryway % % Total Square Miles % % Sources: Yellowstone County GIS Department Section 3 Page 1
16 Historic Population & Employment Growth Yellowstone County has the highest population of any county in Montana with a reported 2000 population of 129,352 persons. Billings remains the largest city in Montana with an 2000 population of 89,847. This is an increase of 5.6% over the 1990 population of 85,073 persons and an increase of 27% over the 1980 population of 66,798 persons. Increased in-migration has accounted for much of the City s population growth. New residents are attracted to Billings for its high quality of life, economic and recreational opportunities, and a small town feeling with the amenities of a large urban center. Table 2 and Figure 3 below provide population trends and projections for the City of Billings, Billings Urban Area and Yellowstone County from 1970 to Table 2 Population Trends & Projections City of Billings Billings Urban Area Yellowstone County Billings % of County 70.50% 61.80% 75% 69% 71.14% 73.57% Billings 10-yr % Growth 8.50% 27.40% 5.61% 16.05% 16.05% County 10-yr % Growth 23.70% 5% 14.05% 13.32% 12.22% Sources: US Census Bureau, NPA Data Services, Inc. Figure 3 Population Trends & Projections Population City of Billings Billings Urban Area Yellow stone County By 1990, the Billings population of 85,073 represented 75% of the Yellowstone County population of 113,419. That percentage decreased in 2000 when the City population accounted for 69% of the County population. The ratio is expected to increase gradually during the next 20 years as more of the County population becomes urbanized. The total Yellowstone County population increased by 26,052 persons from for an average of 1,303 persons per year. The City of Billings population increased by 27% and the Yellowstone County population increased by 5.0% from 1980 to 1990; in contrast, the statewide Montana population increased Section 3 Page 2
17 by only 1.3% during the same period. The population projections for Yellowstone County from anticipate an increase of 35,138 persons, for an average increase of 1,756.9 persons per year. The historic trends of population growth in Yellowstone County are detailed in Table 3 by neighborhood and census tract for 1980, 1990 and The historic 20-year neighborhood population growth is also illustrated in Figure 4. Neighborhood Table 3 Yellowstone County Population Trends by Sub-Area Census Tract Change % Change % of Total Growth Billings Central NA Billings Central % -1% Billings Central % -1% Billings Central % 0% Heights % 20% Heights Central % Heights Central % Heights Central % Heights East % Laurel % 11% Lockwood % 1% Outlying Northeast % 10% Northwest Billings % -2% Northwest Billings % -3% Northwest Billings % 1% Northwest Billings % 0% Northwest Billings % Shiloh % 16% Shiloh Northwest % Shiloh West/SW Area % 17% South Area % -1% South Central % South Central % South Hills % 8% West Area % 26% West Central % -1% West Central % -2% West Central % West End % West End % West End % Yellowstone County Totals % 100% Sources: US Census Bureau, Yellowstone County Planning Department Note: Census tract 19 is not included in the Billings Urban Area, and only portions of census tracts 14, 15 and 16 are included in the Billings Urban Area. Bold italicized values are estimates of Tract distribution Section 3 Page 3
18 for shaded tracts, which have been subdivided for the 1990 Census County population does not include Census Tract 9405, Crow Indian Reservation. Section 3 Page 4


19 Figure 4-20-year Historic Neighborhood Population Growth Billings Urban Area 2005 Transportation Plan Update Section 3 Page 5
20 As shown in Table 3, several neighborhoods/sub-areas of the City have experienced declines in population over the past 20 years, particularly Billings Central (-3%) South Area (-2%), and the South Central neighborhoods (-2%). Conversely, several neighborhoods/sub-areas have experienced major increases in population over the past 20 years. The greatest increases were in the West End (103%), Northwest Billings (80%), the West area (80%), Heights Central (45%), and the Shiloh West/SW area (58%). The neighborhoods that grew the most as a percentage of the total 20-year Countywide population growth were the West End (26%) and Heights Central (20%). Specific neighborhoods grew at different rates during the 20 years between 1980 and 2000, with some experiencing growth during the first ten years of the period, and others experiencing growth during the second ten years. The sustained growth trend of the Heights area is illustrated clearly, while growth in the West End appears to have been stronger during the second half of the 20-year period. The historic population trends indicate the beginning/continuation of urban sprawl away from the Central Business District. This trend may be acceptable if the mix of land use, e.g., home and work, is appropriate and grows proportionately; if the travel patterns do not negatively impact the overall quality of the community; and if the transportation system is developed to accommodate that trend. Figure 5 on the following page illustrates the concentrations of employment in the City. Section 3 Page 6

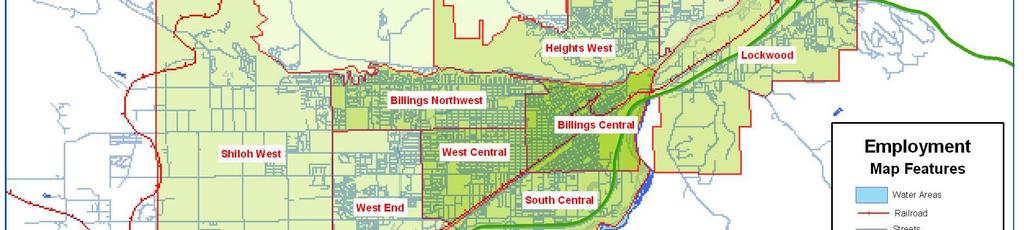
21 Figure 5 - Employment Concentrations Section 3 Page 7
22 Typical 2000 Travel Patterns Table 4 provides a comparison of 2000 work trip characteristics for Yellowstone County and for all of Montana. Work trip data are important since this trip represents the majority of peak period travel, which has the highest impact on the transportation system, and which can be most readily addressed in terms of shifting modes or travel patterns. As shown (and as expected), the predominant mode is the single occupant vehicle (81.9%); that is, persons driving alone to work, although a significant percentage use carpools (9.7%). It is interesting to note that walk trips are lower for Billings than for the State of Montana in general. This is probably reflective of the higher work at home averages for the state (a reflection of its agricultural base) compared to Yellowstone County. The transit (bus) share of the work trips is slightly higher in Yellowstone County than the statewide average, but still comprises less than 1% of the work trip mode share. As shown, the predominant motorized mode is the single occupant vehicle and walking is the predominant non-motorized mode. Table Journey to Work Statistics Transportation Mode Total Montana % of Total Total Yellowstone County % of Total Drove along 310, % 54, % Carpool 50, % 6, % Walked or bicycled 27, % 1, % Worked at home 26, % 2, % Other means 2, % % Bus 2, % % Total 420, % 66, % Sources:; Census Bureau 2000 Summary Statistics. Figures 6 and 7 show how Billings residents travel to work by motorized and non-motorized modes, respectively, from each neighborhood of the urban area. As shown, the predominant motorized mode is the single occupant vehicle and walking is the predominant non-motorized mode. Significant changes to travel habits regarding mode of travel have not been assumed for future travel demand modeling. Section 3 Page 8
23 Figure 6 - Motorized Work Trips Section 3 Page 9
24 Figure 7 - Non-motorized Work Trips Section 3 Page 10
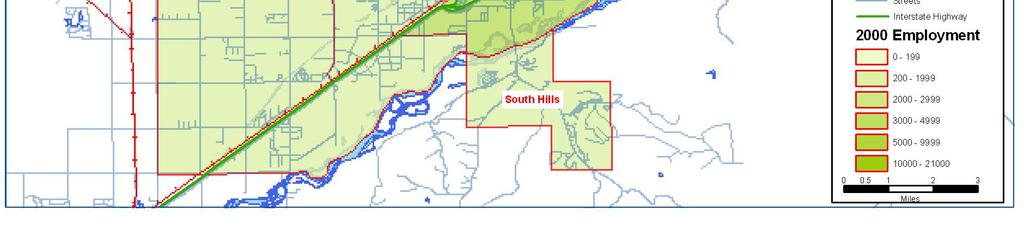
25 Projected 2002 to 2027 Population & Employment Growth The 2002 population in the Billings Urban Area was approximately 103,075 persons in 48,002 dwelling units. That population is expected to grow to 134,754 persons in 65,719 dwelling units by the year 2027 as shown in Table 5 and illustrated in Figures 9 & 10. This represents estimated growth of 31,679 persons or an 30% increase in the next 20 years, which reflects the current growth rate of 1.5% per year. Table 5 Billings Forecasted Dwelling Unit Distribution 2002 Occupied Dwelling Units 2027 Occupied Dwelling Units Change in Dwelling Units % Change NW Billings 9,164 10,250 1, % West Central 6,655 6, % Central Billings 6,928 7, % Heights West 5,957 7,450 1, % West End 6,074 6, % South Central 3,091 3, % Heights East 2,040 3,487 1, % Lockwood 1,717 2, % Shiloh West 3,358 9,526 6, % Shiloh NW 1,074 4,873 3, % South Hills 1,586 3,757 2, % Outlying NE* % Outlying North data included with Shiloh West Total 48,002 66,021 18, % Source: Montana Department of Transportation, 2004 *Outside of land use forecast area The distribution of dwelling units and population is significant because they illustrate where growth will occur in the community and they are the source of trip origins. As shown in Table 5 and Figures 8 and 9, the Northwest Billings, West Central and Central Billings neighborhoods represent the largest concentrations of dwelling units, with 22,747 dwelling units, or nearly 50% of the total. By the year 2027, the number of dwelling units in the Shiloh West, Shiloh NW, and the South Hills neighborhoods are expected to increase by the highest percentages. Shiloh West area will increase by 6,168 dwelling units which represent a 184% increase. The South Hills neighborhood is expected to experience an increase of 2,171 dwelling units during the next 20 years and this represents a 137% increase. Shiloh NW will experience the greatest percentage increase in dwelling units, adding 3,799 units or 354% of the current number. In contrast, the number of dwelling units in the West Central and Central Billings neighborhoods population will not increase appreciably during the next 20 years. Section 3 Page 11
26 Figure 8 Billings 2002 & 2027 Dwelling Unit Distribution 10,000 9,000 8,000 7,000 6,000 5,000 4,000 3,000 2,000 1,000 0 NW Billings West Central Central Billings Heights West West End South Central Heights East Lockwood Shiloh West Shiloh NW South Hills Outlying NE 2002 DU's 2027 DU's Another important aspect of future growth is the location of jobs/employees because they represent the source of trip destinations. As shown in Table 6 and Figure 10 and 11, the number of employees in the Billings Urban Area is expected to increase from 49,789in the year 2002 to 74,682 in the year Central Billings, including the downtown area, currently represents the largest concentration of employees in Billings, with 20,944 in the year 2002 (42% of the total). Central Billings will continue to represent the largest concentration with 24,510 employees in the year 2027 (32% of the total). The West Central and West End neighborhoods will also continue to represent large and growing concentrations of employees. The South Hills, Shiloh West and Shiloh Northwest areas will have significant increases percentage-wise but small increases in terms of actual employees. Figure 11 graphs the distribution of employment for 2002 and Section 3 Page 12
27 Figure 9 Forecasted Dwelling Unit Increase Section 3 Page 13
28 Figure 10 Forecasted Employee Distribution Section 3 Page 14
29 Table 6 Billings Forecasted Employment Distribution 2002 Employees 2027 Employees Change in Employees % Change NW Billings 4,161 5,329 1, % West Central 8,495 9, % Central Billings 20,944 24,510 3, % Heights West 2,988 5,317 2, % West End 4,264 10,205 5, % South Central 4,401 6,632 2, % Heights East 265 1, % Lockwood 2,011 3,795 1, % Shiloh West 1,608 6,063 4, % Shiloh NW 236 1, % South Hills % Outlying NE % Outlying North data included with Shiloh West Total 49,789 74,682 24, % Figure 11 Billings 2002 & 2027 Employment Distribution 30,000 25,000 20,000 15,000 10,000 5, Employees 2027 Employees NW Billings West Central Central Billings Heights West West End South Central Heights East Lockwood Shiloh West Shiloh NW South Hills Outlying NE Section 3 Page 15
30 Section 4. Streets and Highways Element Regional Roadway Network To put this Transportation Plan into context, a series of transportation system maps is shown on the following pages. Figure 12 shows the Billings Urban Area relative to the United States, and also shows the Interstate Highway System. It should be noted that Billings is directly on the Camino Real north-south trade route connecting Canada, the US and Mexico via I-25, I-90, I- 15, MT 3 and US 87. All segments of this key NAFTA trade route and transportation corridor are interstate and have at least 4-lanes except for the segments of MT 3 and US 87. To travel by interstate highway between Billings and Great Falls requires considerable out-of-direction travel via I-90 and I-15. As shown in Figure 13, US 87 and MT 3 present a much more direct route for the Billings-to- Great Falls segment, and this route is heavily used by trucks. Figure 13 shows the Billings Urban Area relative to other major cities within Montana. Except for the US 87/MT 3 link between Billings and Great Falls, Montana, all segments of this key NAFTA trade route and transportation corridor between Mexico and Canada are interstate and have at least 4-lanes. This 225-mile link is being considered for upgrade and improvement, which may further increase traffic volumes to/from and through the Billings Urban Area. Billings is the largest city in the state and the largest transportation hub in the central and eastern portions of the state. Key roadway linkages between Billings and other urban areas in Montana include I-90 (to I-25), I-94, and MT 3/US 87. Located at a key cross-road of regional transportation facilities, the city s physical location in the Yellowstone River valley also presents some physical constraints to surface transportation. The urban area is situated between the Yellowstone River and the river bluffs to the south. The City shares this east-west river valley with an interstate highway (I-90) as well as a busy railroad corridor, both of which present additional constraints to travel in a north-south direction. Near the Billings Urban Area, few roadways cross the Yellowstone River or climb up the Rimrocks to provide north-south connections. North 27 th Street and the Zimmerman Trail (via Shiloh Road) are two of only three direct connections between I-90 and MT 3, identified earlier as an important connecting route to Great Falls in the Camino Real Corridor. Both of these facilities are less than ideal for this important function, each having its own limitations or constraints. While the Zimmerman Trail traverses residential areas and presents significant topographic constraints, the 27 th Street corridor routes traffic through the heart of downtown Billings. The third connection for north-south travel between I-90 and MT 3 is provided via US 87 (Main Street) and Urban Route 1014 (Airport Road). Section 4 Page 1
31 Figure 12 - The Billings Urban Area Relative to the United States Section 4 Page 2
32 Figure 13 - The Billings Urban Area Relative to Other Major Cities within Montana Section 4 Page 3
33 Local Roadway Network Figure 14 shows the Major Street Network (MSN) made up of the interstate highways, major and minor arterials and collector/local roadways that comprise the Interstate, National Highway System, the Secondary and Urban Highway System in the Billings Urban Area which are the focus of this 2005 Transportation Plan. All of the emboldened roadways shown in Figure 14 are categorized by Functional Classification. The five tiers of the Functional Classification Scheme are: Freeway, Principal Arterial, Minor Arterial, Collector, and Local Streets. Figure 15 shows traffic volumes on street segments on the MSN in the Billings Urban Area for 2002 where congestion may be occurring. Significant congestion is noted for the following roadways: Main Street between Downtown and the Heights Grand Avenue South 27 th Street between I-90 and Montana Avenue Poly Drive between Rehberg Lane and North 27 th Street King Avenue West Shiloh Road 24 th Street West Figure 15, based on current traffic counts illustrates roadway segments currently estimated to be near, or over their carrying capacity. For the purposes of this figure, capacity is defined as Level of Service (LOS) is a measure of traffic flow conditions for highways and rural/urban streets where the level is given a letter designation varying from A to F (much like school grades). LOS A represents ideal conditions of free flow and little delay, while LOS F represents the opposite condition of near grid-lock conditions with long queues and delays. LOS descriptions for intersections (dominant factor for urban area roadways) are provided in Table 7, based on a calculated volume-to-capacity (v/c) ratio. The Billings Urban Area has set a goal of achieving and maintaining level of service C on all major roadways for the 20-year planning horizon. This Transportation Plan will identify the locations where that LOS currently or is anticipated to be exceeded, determine the appropriate improvements and their associated cost to achieve LOS C," and determine whether there is available funding to support the improvements. Obviously, in some cases, the cost of improvements may be prohibitive given available funding, and the City may have to settle for LOS D (Table 7) at certain locations during peak demand periods. The peak hour operating characteristics of roadways may be estimated from daily traffic volume based on consistent and well-defined relationships between daily and peak hour volumes. Using these relationships, representative daily capacities may be calculated based on roadway characteristics such as functional class, number of lanes, urban/suburban/rural setting, etc. Section 4 Page 4
34 Figure 14 - Interstate highways, major arterials and other significant roadways in the Billings Urban Area Section 4 Page 5
35 Figure Average Daily Traffic (ADT) with Congested Segments Highlighted. Section 4 Page 6
36 Table 7 Level of Service Level of Service A B C D E Volume/Capacity Ratio (v/c) Traffic Flow/Delay Characteristics (intersections) Very low delay, up to 5 sec per vehicle. This level of service occurs when progression is extremely favorable, and most vehicles arrive during the green phase. Most vehicles do not stop at all. Short cycle lengths may also contribute to low delay. Delay greater than 5 and up to 15 sec per vehicle. This level generally occurs with good progression, short cycle lengths, or both. More vehicles stop than with LOS A, causing higher levels of average delay. Delay greater than 15 and up to 25 sec per vehicle. These higher delays may result from fair progression, longer cycle lengths, or both. Individual cycle failures may begin to appear at this level. The number of vehicles stopping is significant at this level, though many still pass through the intersection without stopping. Delay greater than 25 and up to 40 sec per vehicle. At level D, the influence of congestion becomes more noticeable. Longer delays may result from some combination of unfavorable progression, long cycle lengths, or high v/c ratios. Many vehicles stop, and the proportion of vehicles not stopping declines. Individual cycle failures are noticeable. Delay greater than 40 and up to 60 sec per vehicle. This level is considered by many agencies to be the limit of acceptable delay. These high delay values generally indicate poor progression, long cycle lengths, and high v/c ratios. Individual cycle failures are noticeable. F >0.96 Delay in excess of 60 sec per vehicle. This level, considered to be unacceptable to most drivers, often occurs with over-saturation, that is, when arrival flow rates exceed the capacity of the intersection. It may also occur at high v/c ratios below 1.0 with many individual cycle failures. Poor progression and long cycle lengths may also be major contributing causes to such delay levels. Source: Highway Capacity Manual, Special Report 209 Transportation Research Board, National Research Council, 1994 Table 8 shows representative daily capacities (at LOS D) for the typical variation of functional classifications found in large urban areas. Section 4 Page 7
37 Table 8 Typical Daily Capacity (LOS D) for Urban Streets & Highways FACILITY TYPE AREA TYPE Freeway Principal Minor Arterial Collector Arterial Central Urban 1 Lane 33,300 15,600 9,700 7,600 2 Lane 66,600 31,100 19,300 15,100 3 Lane 100,000 42,000 25,000 22,700 Urban 1 Lane 33,300 15,900 10,200 7,900 2 Lane 66,600 31,800 20,400 15,800 3 Lane 100,000 43,700 27,000 23,700 Suburban 1 Lane 33,300 16,700 10,200 7,900 2 Lane 66,600 32,000 20,400 15,800 3 Lane 100,000 43,700 27,000 23,700 Rural 1 Lane 33,300 15,900 15,700 14,700 2 Lane 66,600 37,800 37,800 29,300 3 Lane 100,000 56,700 56,700 44,000 * Capacity in Vehicles per Day (Both Directions) **Number of lanes in each direction ASSUMPTIONS: PHF (% of ADT)=10% Peak Hour Split: 60/40 There are several links in the roadway network that currently are near or over capacity and experience congestion including the following: Main Street / US 87 Wicks Lane Hilltop Road Airport Road Grand Avenue Rimrock Road North 27 th Street Broadwater Avenue Central Avenue Shiloh Road West 24 th Street King Avenue West These deficiencies in the current roadway network are discussed further in the next section. Section 4 Page 8
38 Levels of Service/Deficiencies Analysis An analysis of capacity related issues was performed on the travel demand model results. The existing 2002 roadway network that incorporates traffic related data from the Traffic Count Program locations were utilized to calibrate the model. From that process of calibration/validation, a certain amount of confidence was allowed in forecasted travel demand results developed from local land use estimates. Several links in the roadway network as currently exhibiting the symptoms of being near or over capacity and experiencing congestion, including the following roadway sections, were identified: Main Street / US 87 Wicks Lane Hilltop Road Airport Road Grand Avenue Rimrock Road North 27 th Street Broadwater Avenue Central Avenue Shiloh Road West 24 th Street King Avenue West Public and staff input obtained through the TAC were also sources used to corroborate the perception of current deficiencies in the local transportation system. In addition to roadway capacity issues, other transportation deficiencies were also identified, such as adequate truck routes and access, transit service, regional access and mobility, and non-motorized transportation needs. While these issues may not be addressed directly by the QRSII model, they play an important role in the transportation planning process. The model results that portrayed delays in travel time were considered within the context of this analysis to aid in discovering deficiencies in the current road network if not addressed by this plan. To understand the cause behind the roadway deficiencies, the trip-making patterns developed from the travel demand mode were examined. Trip-making at the neighborhood level was examined for the base year (2002), and for the future planning horizons at years 2005, 2015, & This examination consisted of working with neighborhood-level trip tables to identify high growth trip interchanges (these would indicate the need for improvements beyond the existing system), both in terms of proportional growth and growth in raw numbers of trip interchanges (see Table 9). For future planning horizons, the modeled roadway network was examined for capacity issues. For purposes of future conditions, additional roadway project alternatives were added to the current system network to analyze projects considered committed by local planning staff. Projects that will be constructed within this plan s horizon that have a secure funding source are deemed committed. The committed major street projects are: 1. Airport Road from 27 th Street intersection to Main Street. 2. Bench / 6 th Connection. 3. Shiloh Road - widening to 5-lanes from Grand Avenue to Rimrock Road. Section 4 Page 9
39 4. Grand Avenue - widen to 5-lanes from 5 th Street West to 24 th Street West. 5. Rimrock Road widen to 3-lanes to 54 th Street West. Current & Projected Travel Patterns Billings' area land use was developed by a committee of local experts who forecast future population and employment levels. MDT then ran the calibrated model using the updated land use date on the existing plus committed roadway network. The model outputs were used to determine overall travel patterns, trip origins and destinations by neighborhood. Planning staff were able to identify deficiencies in the network where the projected traffic volumes may exceed the available capacity of the network, thereby resulting in traffic congestion that should be addressed through this plan. The total number of projected daily vehicle trips in the Billings Urban Area is 499,280 trips in 2005; 552,360 trips in 2015; and 634,880 trips in This growth in daily trips between 2005 and 2025 represents a 27% increase in trip making over the twenty year horizon. The neighborhoods with the highest numbers of daily trip origins and destinations (or productions and attractions) are Central Billings, Northwest Billings and the West End, with a combined total of more than 49% of the total vehicle trips per day, as shown in Table 9. Table 9: Billings Urban Area Daily Total Vehicle Trip Origins/Destinations by Neighborhood % Increase % Increase % Increase Neighborhood Central Billings 89,900 95, , % 8.5% 14.8% Northwest Billings 87,420 92, , % 9.0% 15.9% West End 78,190 84,680 94, % 11.5% 20.7% West Central 71,140 74,150 78, % 6.2% 10.7% Heights West 46,390 52,680 62, % 18.5% 34.5% South Central 32,040 34,510 38, % 10.9% 19.4% Heights East 22,420 27,330 34, % 27.7% 55.7% Lockwood 18,470 23,920 33, % 38.2% 79.0% Shiloh West 15,840 20,540 27, % 34.5% 74.4% Outlying NE 9,970 13,250 18, % 41.4% 88.0% Shiloh NW 10,000 12,550 16, % 30.6% 63.9% External West 8,610 9,590 11, % 15.8% 29.0% External East 5,430 6,570 8, % 27.4% 54.2% Outlying North 1,410 2,460 4, % 74.8% 205.3% External NW % 31.1% 63.6% Total Trip Origins/Destinations 499, , , % 14.9% 27.2% Source: Montana Department of Transportation, Billings Travel Demand Model Section 4 Page 10
40 The neighborhoods expected to experience the highest growth in daily vehicle trip interchanges (trip origins and destinations or productions and attractions) are listed in Table 10. As shown, the largest numbers of daily trip interchanges currently and forecasted in 2025 occur between Central Billings and Northwest Billings. The number of trip interchanges between those two neighborhoods in 2005 are estimated to be 30,800 per day, is expected to increase 7.1% to 32,980 daily trips by Trip interchanges will also continue to be very high between West Central and Northwest Billings, between Northwest Billings and the West End, and between West Central and the West End, as well as within the Northwest Billings neighborhood. The highest percentage increases in trip interchanges that originate from a neighborhood to destinations within the same neighborhood, between 2005 and 2025, are expected to occur within the Heights West (50%), the West End (21%), and Northwest Billings (15%). Section 4 Page 11
41 Areas with > 10,000 trips per day Central Billings-NW Billings NW Billings-Central Billings Table 10 Vehicle Trip Origins and Destinations between and within Neighborhoods % Increase % Increase % Increase % Increase % Increase % Increase Trips Trips Trips Trips Trips Trips ,153 15,680 16, % 0.34% 0.34% 15,415 15,952 16, % 3.5% 7.1% 15,122 15,648 16, % 0.34% 0.34% 15,383 15,920 16, % 3.5% 7.1% Total 30,275 31,328 32, % 0.34% 0.34% 30,798 31,871 32, % 3.5% 7.1% West Central-NW Billings NW Billings-West Central 14,503 15,011 15, % 0.34% 0.34% 14,749 15,253 15, % 3.4% 7.0% 14,490 14,997 15, % 0.34% 0.34% 14,735 15,238 15, % 3.4% 6.9% Total 28,993 30,008 31, % 0.34% 0.34% 29,484 30,491 31, % 3.4% 6.9% West End-NW Billings 13,851 14,866 15, % 0.62% 0.62% 14,289 15,206 16, % 6.4% 13.2% NW Billings-West End 13,844 14,859 15, % 0.62% 0.62% 14,282 15,199 16, % 6.4% 13.3% Total 27,695 29,725 31, % 0.62% 0.62% 28,570 30,404 32, % 6.4% 13.3% West Central-West End 13,521 13,929 14, % 0.32% 0.32% 13,738 14,182 14, % 3.2% 6.6% West End-West Central 13,517 13,924 14, % 0.32% 0.32% 13,733 14,177 14, % 3.2% 6.6% Total 27,038 27,853 28, % 0.32% 0.32% 27,471 28,359 29, % 3.2% 6.6% NW Billings-NW Billings 24,884 26,454 28, % 0.69% 0.69% 25,758 27,598 29, % 7.1% 14.8% Central Billings-West Central West Central-Central Billings 11,496 11,640 11, % 0.13% 0.13% 11,568 11,714 11, % 1.3% 2.5% 11,479 11,625 11, % 0.13% 0.13% 11,552 11,700 11, % 1.3% 2.6% Total 22,975 23,265 23, % 0.13% 0.13% 23,120 23,414 23, % 1.3% 2.6% Table continued on next page. Section 4 Page 12
42 Table 10 continued. West End-West End 21,069 23,322 25, % 0.96% 0.96% 22,095 24,299 26, % 10.0% 20.9% Central Billings-Central Billings Heights West-Heights West West Central-West Central 20,873 21,673 22, % 0.44% 0.44% 21,332 22,280 23, % 4.4% 9.1% 14,378 17,547 21, % 2.04% 2.04% 15,908 19,474 23, % 22.4% 49.9% 14,286 15,045 15, % 0.40% 0.40% 14,571 15,157 15, % 4.0% 8.2% Section 4 Page 13
43 High Accident Locations The Montana Department of Transportation maintains state-wide records for accidents on both city streets and state highways. City staff uses this data to monitor accident-prone areas, locations that exhibit higher than expected accident rates. Figure 16 lists the high accident locations in the Billings Urban Area. It is not surprising that the highest number of accidents occur at locations with the most traffic, the most congestion, and consequently the most opportunity for accidents. Twenty locations are shown, representing the three year period of Accident data is a strong indicator of problem locations. Of the 20 accident locations assessed, the worst five locations are: th Street West / Central Avenue th Street West / Grand Avenue th Street West / King Avenue th Street West / Grand Avenue th Street West / King Avenue All of the five worst locations operate under traffic signal control and carry significant volumes of traffic with high numbers of turning vehicles. Accident types recorded for the worst 5 locations indicate a predominance of rear-end type accidents, typical of signalized intersections. All of these locations are either directly or indirectly impacted by potential alternatives being considered for inclusion in the final plan. Improvements targeted to reduce traffic volume or increase system capacity should result with accident rate reductions with improved traffic flow. Some of the noted locations have experienced recent improvements that also should improve accident rates. These, and other high accident locations should be monitored routinely by City/County staff to identify developing indicators of correctable problems or conditions. Accident data collected for this planning study are available at the City Public Works Department. Section 4 Page 14
44 Figure 16 - High Accident Locations Intersection Listings 01/01/ /31/2003 Top 20 Intersections with at least Five (5) Accidents Rank Intersection Count 1 24 th Street West & Central Avenue th Street West & Grand Avenue 66 3 Private & Private th Street West & King Avenue West th Street West & Grand Avenue th Street West & King Avenue West th Street West & St. Johns Avenue 42 8 Laurel Road & Moore Lane th Street West & Broadwater Avenue th Street West & Grand Avenue th Street West & Monad Road th Street West & Rosebud Drive th Street West & Central Avenue & Eldorado Drive nd Street West & King Avenue West Grant Road & King Avenue West th Street West & Broadwater Avenue th Street West & Grand Avenue Broadwater Avenue & Division Street th Street West & Central Avenue ht Street West & Central Avenue Section 4 Page 15
45 Needs Assessment/Travel Demand Analysis The identification of current capacity and safety deficiencies, the current and future travel demand were also examined to assist with identification of current and future needs. Meeting established transportation system needs, addressing key transportation issues, and moving toward accomplishing community goals were all considerations for developing alternative system elements for testing and evaluation. Travel Demand Model Development The QRSII Travel Demand Model platform was utilized for establishing current travel demands and estimating future demands for travel. The travel demand model for the Billings urban area was developed, and is maintained by the Montana Department of Transportation (MDT). MDT assisted in development of this transportation plan update by performing travel demand modeling analysis based on land use descriptors including employment and housing. The development and operation of this travel demand model is explained in this section. Traffic forecasts for the Billings area have been developed following the general methodology commonly applied in transportation demand forecasting. The procedure is the time honored four step process: Trip Generation, Trip Distribution, Mode Split, and Trip Assignment. TRIP GENERATION Trip generation defines the relationship between traits of land use and households with trip making. Productions and Attractions define the process of trip generation, which helps "explain" why trips are made. During this step, trip ends are defined by origin and destination and are functionally related to land use. Trip generation consists of applying nationally developed trip rates to land use quantities by type of land use within each TAZ. A trip production is defined as the home end of the home-based trip. The relationship between a unit of land use and the trip generation rate are found in the NCHRP Report 365 by the National Research Council. Productions are measured in terms of population and demographic data, measured in terms of the number of occupied dwelling units, household income, and available autos per household. Attractions are defined in terms of employment as the non-home end of the home-based trip, the destination end of the non-homebased trip being either retail or non-retail occupations. Attractions are measured in terms of retail and non-retail employees to predict employment-commerce-personal business related trips within the TAZs. To collect data regarding residential location, we looked to the 2000 Census data. The Summary Tape Files (STF) and the Census Transportation Planning Package (CTPP) gave detailed information regarding the place of residence. The trip generation step actually consists of two individual steps: trip production and trip attraction. Trip production is based on relating trip making to various household characteristics, such as income, auto availability, or household size. Our data consists of auto availability and number of occupied dwelling units. The trip attraction model considers activities that might attract trip makers, such as offices, shopping centers, schools, hospitals and other households. Attraction activities are grouped into three categories: amount, character, and location. The amount characterizes an attraction rate as trips attracted per employee; character describes the type of attraction: retail, office, household, etc.; and location groups the attractions into such Section 4 Page 16
46 areas as downtown, suburban, rural. Baseline data depicting key socioeconomic characteristics e.g. employment, housing, and auto availability, were developed for each TAZ from the Census and the Department of Labor and Industry 202 File data. The transportation model uses these characteristics to predict the patterns of travel between each TAZ and external stations. Trip generation is the first of four basic phases in the traditional travel demand forecasting process. The number of productions and attractions in each zone is determined here, and is then used to in the distribution phase. External Stations Internal-external (I-E) and external-internal (E-I) trips have one trip end outside of the study area or cordon line. Through trips pass through the study area but have both of their trip ends outside of the study area. Trip generation for internal and external zones is handled by the QRSII software. External station trips are based on traffic count data, with trip purpose breakdowns from default values from the NCHRP 187 Manual. Typically there are 3 trip purposes: Home-Based Work (HBW), Home-Based Non-Work (HBNW) and Non-Home-Based (NHB). Productions Attractions HBW HBNW NHB HBW HBNW NHB 8% 31% 12% 8% 30% 11% 2002 I-90 to Laurel 16,650 I-90 to Hardin 6,990 US 87 to Roundup 3,620 Mt 3 to Lavina 1,590 I-94 to Miles City 6,390 To calculate the Ps and As for the external stations, the percentage distribution of the trips is multiplied by the auto occupancy. True though trips are those that do not stop in the study area. Through trips were estimated based on travel surveys developed during the North Bypass Feasibility Study, developed by HKM in 2000 to be released in April An Add Trips Table was implemented based on these surveys. SUPERZONES Districts or superzones were then created by aggregating zones of similar land use. The superzones represent census tracts, as well as neighborhoods. Fifteen superzones were created. With these superzones, a growth pattern was established that accurately reflects internal growth. Control totals by study area and superzone were established to maintain the data integrity of the forecast. Section 4 Page 17
47 TRIP DISTRIBUTION Trip distribution is the process by which a trip from one area is connected with a trip end from another area, thereby linking origins and destinations or productions and attractions. These trips are referred to as trip exchanges. The trip distribution element of this model is based on the gravity model as presented by QRSII. Home Based Work trips (HBW) are not balanced, Home Based Non-work trips are also not balanced, and Non Home Based trips are balanced on the side of attractions. MODE SPLIT AND AUTO OCCUPANCY Mode choice is the process by which the amount of travel will be made by each available mode of transportation is determined. There are two major types -- automobile and transit, although there are 3 modes typically used in demand forecasting: drive alone, shared ride and transit. Mode choice receives its major input from trip distribution results -- the trip interchanges between zones. The mode choice output is the number of these trips in each mode. Mode split was not explicitly included in this model because transit planning related issues are dealt with extraneously to the Urban Planning Process. Driving alone and shared ride are rolled into one characteristic: Auto Occupancy. Auto Occupancy is defined by the number of passengers in a vehicle during a trip. Auto Occupancy rates are based on a range of typical values as found in the NCHRP 187 Manual. Since Billings has a viable mass transit system, the auto occupancy rates for the various trip purposes were estimated for this traffic model, the HBW auto occupancy rate is 1.1, the HBNW value is 1., and the NHB value of 1.2. TRIP ASSIGNMENT Once the trip distribution element is completed, the trip assignment element tags those trips to the Major Street Network (MSN). The variables that influence the assignment to the MSN are travel time, length, and capacity. ROAD NETWORK The characteristics of the road system are input into the traffic model as a computerized network. This coded network consists of links representing road segments and nodes typically representing intersections. Together, these links and nodes define the continuity of the road network. Additionally, each link is assigned the attributes of speed and capacity. As a result, this coded network can be used in two subsequent steps of the model process: to determine the travel times between TAZs for trip distribution, and to travel paths between TAZ for trip assignment. The MSN comprises the links of the modeled network at the system-wide level of planning that are functionally classified as interstate, principal arterial, minor arterial, collector, and local, where local streets were needed. Recognizing that the official functional classification scheme did not include all streets that play a significant role in the transportation system, many local streets which carry relatively large volumes of traffic were reclassified as collectors. Local streets that provide continuity within the existing MSN, as well as provide a link to areas outside of the study area were also included. It was felt that there were also local streets that provided Section 4 Page 18
48 connections between major streets, as well as provide access to and from the outlying area that needed to be included as well. NETWORK FILE CALIBRATION For the model to be of use in forecasting traffic impacts, a level of confidence has to be ascertained. This is accomplished by a comparison of synthesized traffic conditions to actual observed traffic conditions. Model calibration is the process of adjusting model parameters to replicate existing transportation conditions. Upon completion of the base-year area wide travel simulation, the ability of models, overall, to replicate observed travel is evaluated. This entails comparison of the final products of the modeling process, area wide VMT and traffic flows, with ground counts for that year. The analyst should be aware that observed VMT, in fact, is not determined through universal measurement. Rather, a sample of traffic counts along roadway segments of different functional classes, are types, and segment lengths are extrapolated to estimate region wide VMT. After the VMT checks, simulated traffic volumes on links traversing broad travel corridors are compared with observed traffic on those facilities. Simulated volumes also should be compared with observations across various classes of roadway, such as facility type, volume group, and area type. Data from Highway Performance Monitoring System (HPMS) should be used to support this evaluation. Finally, on a more general level, average statistics of VMT rates, such as VMT per person, from the base-year travel simulation should be compared with actual and modeled data for prior year and even other regions. Network file calibration serves to bring into agreement the synthesized traffic volumes generated by the computer model software with observed volumes from the traffic count program. The level of agreement is calculated with Root Mean Square Error and percent error. Network file calibration is performed on three levels: 1. Screen Lines 2. Cut Lines 3. Link Volumes Screen lines and cut lines are groupings of parallel roadways corresponding to the major travel corridors of a region, or corridors under study in a planning analysis. Aggregation of traffic volumes on roadways and/or transit ridership totals for routes operating within these groups provide convenient format for the analyst to use in assessing sub-regional travel patterns. At each level of calibration, the synthesized volumes were compared to the observed volumes to determine what adjustments needed to be made to the parameters of the model's physical attributes (e.g. link speed or capacity) or to the model's production, attraction, distribution, occupancy, or assignment parameters. Section 4 Page 19
49 TRAVEL ESTIMATES A second independent estimate of VMT for the Study Area and the Non-attainment Area was undertaken by the staff of MDT/Urban Planning. Using road inventory data compiled by the Statistics Section and estimates from the Traffic Count Program, from the year 2002, a VMT estimate was calculated for the study area and the non-attainment area. Using the internal computation programs that calculate VMT, based on the formula VMT=LENGTH X VOLUME, a synthesized VMT was compared to the calculated VMT volumes to assess accuracy. The table below demonstrates the comparative information to assess the level reasonableness of the combined VMT data by functional classification. COMPARISON OF MODELED VS. INVENTORIED VMT DATA for Functional Model Inventory Classification Interstate 407, ,927 Principle Arterial 748, ,439 Minor Arterial 405, ,138 Collector 270, ,918 Local 212, ,900 Total 2,043,481 2,315,322 The Nonattainment Area VMT Interstate 144, ,197 Principle Arterial 669, ,026 Minor Arterial 241, ,829 Collector 136, ,044 Local 143, ,422 Total 1,334,832 1,452,517 The calibration of the base year (2005) network file indicated that the model's socio-economic data was accurate. The measure of accuracy typically measured in the traffic model profession is Root Mean Square Error or RMSE, for this effort it was near 25 percent for the entire study area. We consider a RMSE under 30 percent to be successful. Future Forecast Methodology The traffic model inputs were forecasted during the Shiloh Rd. Corridor EIS/EA in A major component of this process was the transition from the 1990 Census to the 2000 Census and then further updated using 2001 and 2002 building permits provided by the City of Billings Planning Department. The allocation of the growth from the area level were distributed to the TAZ level was performed by the group of knowledgeable members of the community, plus the Billings/Yellowstone MPO Planning Staff, the consultants and a MDT planning staff. Allocations at the area level were distributed to the zones in that area within the constraints of available land, future land use estimates and anticipated densities. Section 4 Page 20
50 The allocations were first allocated at the area level. If growth allocated to that area could be absorbed by the zones in that area, no reductions were made to that area. If the allocated growth to that area could not be absorbed by the zones, surrounding areas were considered to determine if the excess growth could be shifted to those areas. In the event that growth allocated to the area in a given district could not be absorbed, the adjacent area in the adjacent district were considered as possible targets of the excess growth. The expert committee agreed on a 1.0 percent annual growth rate as applied to the 2005 total employment and housing to provide a control total. The expert committee also agreed on a 25 percent assumed growth for the period 2005 to According to these assumptions, 3,335 new dwelling units are forecast to be constructed within our study area between 2005 and For the period from 2005 to 2010, we anticipate 7,686 new dwelling units to be constructed. For the period of 2005 to 2025, 14,054 new dwelling units are forecast to be constructed within the greater Billings study area. Once the new houses were forecast for the control total, they were sub-allocated to the superzones, according to the knowledge of Billings and the study area held by the expert committee. Based on growth assumptions, we anticipate 5,350 new retail employees in Billings in By 2025, we anticipate 7,210 new non-retail employees. So, in 2025, retail employment will increase to 21,380 persons. Non-retail employment will likewise increase to 36,070 persons in With these control totals established, the expert committee sub-allocated the numbers to the superzone level, based on the feelings of the group participants. Year 2000 Yellowstone Planning Assumed Less County Area Growth Delta Dwelling Units % Retail % % Non-Retail % % BOLD - given by MDT Urban Planning Population Projections Population projections for Yellowstone County for the year 2005 are available from the Research and Information Systems Division, Montana Department of Commerce. In 1990, the population of Yellowstone County was 113,419 people. In 2000, the population of Yellowstone County had increased to 129,352, or 14.1 percent. During this same period, Billings increased from 85,073 in 1990, to 89,847 in 2000, or 5.6 percent. According to calculations from the Montana Estimates of the Population of Places: Annual Time Series, July 1, 1991 to July 1, 2000, the City of Billings was experiencing a 1.0 percent annual growth rate during the period 1990 to In this context, for travel demand forecasting purposes, we are anticipating a 25 percent increase in the number of dwelling units in the greater Billings study area. That computes out to nearly 10,000 dwelling units being constructed by Section 4 Page 21
51 Screen Line and Cut Line Analysis The City of Billings in cooperation with the Montana Department of Transportation have developed a wealth of traffic data through the implementation of the traffic count program. When it is used to both support and verify the travel demand forecast modeling process, it becomes a powerful tool in transportation planning. Although Billings has an eclectic layout where streets are parallel in some neighborhoods and skewed in others, we can use screen lines and cut lines to measure traffic flows in an interneighborhood fashion. Division St. is the first place on which to focus our attention. We have five traffic count locations on the major streets that intersect with Division: Poly, Granview, Grand, Broadwater, and on Montana. Collectively, we may expect to see an increase of 12 percent in the traffic volumes entering and exiting Billings Central (Central Business District) TCP Existing Forecast #004 I90 27th-Lockwood 17,080 16,640 #005 I90 Lockwood-Johnson 6,140 6,920 #006 I90 Johnson-Pinehills 16,760 19,890 #007 I90 E Pinehills-Hardin 13,340 16,480 Total 69,460 59,930 Change 12.4% Annual Growth Rate 0.5% 5 th St. W. also provides this kind opportunity. We have traffic count locations on Rimrock, Poly, Parkhill, Grand, Lewis, Broadwater and Central that allow us to visualize how travelers migrate from the neighborhoods like the Billings NW, West Central, South Central and West End to and from the Billings Central neighborhood and Central Business District. The model results indicate that traffic volumes will increase 13 percent by TCP Existing Forecast #120 U1002 RIMROCK Highwood-Virginia 6,470 6,780 #184 U1015 5TH ST Woodland-Poly 5,241 6,360 #098 PARK HILL 6th-5th St W 4,466 3,920 #093 U1004 GRAND 6th-5th St W 19,204 20,810 #076 U1006 BROADWATER 6th-5th 17,015 19,780 #068 U1008 CENTRAL EB 6th-Montana 4,397 4,590 Section 4 Page 22
52 Total 56,793 56,793 Change 9.6% Annual Growth Rate 0.4% When we look farther west, and utilize Shiloh Rd. as our screen line, we find that the West End travelers are exchanging trips with the rest of Billings at a much higher rate. By looking at traffic count locations on Rimrock, Grand, Broadwater, Central, King, Hesper, and Zoo the travel demand model results indicate that the traffic volumes may increase 88 percent by TCP Existing Forecast #114 U1034 RIMROCK Shiloh-Main 10,200 12,590 #087 U1004 GRAND Shiloh-Circle 7,690 16,330 #069 U1006 BROADWATER Shiloh 3,370 6,020 #059 U1008 CENTRAL Shiloh-38 th 6,410 11,900 #045 U1010 KING Shiloh-Olympic 8,380 12,170 #041 HESPER Shiloh-35th St W 3,330 10,850 #601 ZOO DR Shiloh-I90 Interchange 8,070 11,600 Total 47,450 81,460 Change 71.7% Annual Growth Rate 2.4% Another cut line of interest is of interest can be drawn just west of Main St. in the downtown. This cut line defines traffic movements between the CBD and the Heights. We anticipate a 17 percent increase in traffic volumes by TCP Existing Forecast #235 U1030 1ST AVE N 9th St-Main 23,000 27,450 #246 U1018 4TH AVE N 10th-Main 13,710 15,530 #247 U1029 6TH AVE N 10th-Main 15,120 16,720 Total 50,940 59,700 Change 17.2% Annual Growth Rate 0.7% Section 4 Page 23
53 Long-Term Network Deficiencies This specific discussion focuses on the capacity deficiencies identified for the roadway system currently in place or committed to be completed in the near-term. Generally, the existing roadway problem areas continue to be impacted by the growth expected in the Billings area. Considering the discussion of traffic forecasts illustrated previously, the corresponding roadway network impacts have been analyzed and presented in the following discussion points. Main Street provides a clear indication of the growth forecast for the Heights travel to the other Billings neighborhoods. The growth in traffic on Main Street is forecast to be a total of percent through the 2025 time frame. This growth causes the existing roadway to become more congested than it operates at present. In 2025, we anticipate traffic volumes of 52,450 along the corridor cannot be accommodated at an acceptable level of service by the current facility components. The increased traffic will create a situation where congestion may become too great of a risk for the traveling public. Given the fact there is a limited number of routes leading into and out of the Heights, a bottleneck condition would most likely develop as all intersections along Main Street become congested with motorists. Montana Avenue illustrates another corridor that continues to attract motorists into the future. Traffic projections to 2025 indicate that congestion could become a future issue. A growth rate of 33 percent is a significant amount of traffic for this facility to accommodate, and is reflective of cross-town travel desire. Moreover, the percentage growth when applied to current traffic volumes are expected to be 28,500 in 2025 are near the acceptable carrying capacity of the roadway. As the traffic exceeds the roadway capacity, drivers will seek the alternate routes in the vicinity of the corridor to improve their travel time. The adjacent roadways typically are within residential neighborhoods creating a capacity and safety concern as higher traffic volumes use the lower classification of roadways. Grand Avenue another roadway that is anticipated to experience traffic growth of 35 percent over the next 20 years. This percentage growth is large and corresponds to total volumes in the range of 32,470 on this facility. Although the traffic volumes can be technically accommodated by the existing four-lane facility with additional turn lanes, the numerous access drives and intersections without auxiliary lanes create an operational deficiency that requires analysis and mitigation. North 27 th Street is forecast to experience a large percentage increase in traffic volume. The 2025 growth indicates a 30 to 35 percent increase along this major corridor. The traffic volumes in 2025 are estimated to be 21,410, which is within the physical and technical capacity of the facility. However, the impacts to intersections impair the ability of the roadway to accommodate the traffic volumes. 24 th Street West is forecast to grow modestly by 26 percent over the long-term. The increase in traffic is not as problematic as the multiple access drives and intersections. Total traffic in 2025 is anticipated to be approximately 29,000 daily vehicles. The capacity of this facility, as a 4-lane principal arterial, is sufficient to accommodate the growth. However, the access control along this corridor should be evaluated to allow the traffic to flow efficiently and reduce congestion currently experienced during peak shopping periods. Section 4 Page 24
54 Shiloh Road is expected to undergo growth of near 65 percent. Carrying about 9,010 currently, this facility is expected to carry a demand near 13,700 in the future. Fueled by continued growth of west-end neighborhoods and economic development as result of the I- 90 interchange at Zoo Dr. and Shiloh Road, traffic will rapidly grow to exceed the carrying capacity of this two-lane facility. Together with west-end growth and the increased mobility provided by the Shiloh Interchange, east-west travel demands to and from the Shiloh Road corridor will strain existing east-west arterial streets. Improvements to the capacity of King Avenue, Central Avenue, Grand Avenue, and Rimrock Road will likely be needed to meet the expected demand. Figure 17 illustrates the expected levels of congestion in the year 2025 given expected growth in travel demand without any additional roadway system improvements beyond currently committed improvements. Roadway improvement alternatives were developed considering the projected changes and increases in travel demand illustrated, as well as considering system deficiencies identified. Section 4 Page 25
55 Figure Congested Roadway Segments Section 4 Page 26
56 Alternatives Development & Analysis Many individual transportation system improvements were developed for testing (by the travel demand model) by considering existing deficiencies, congestion, accident locations, mobility and growth of future travel demand. Improvements identified by the 2000 Transportation Plan that have not yet been implemented were also considered for further testing. Alternatives were developed to address specific transportation issues of: 1. Improved north-south arterial continuity in the west area 2. Improved capacity into and out of the Heights to downtown area 3. Improved mobility from the Heights to the west side of town 4. Improved truck/commercial vehicle access to and through town (access to state highways and major facilities serving the Billings area) 5. Reduction of barrier impacts to transportation (rims, river, railroad tracks, etc.) Over 20 different individual system improvement alternatives were developed and tested, either individually or in concert with selected other improvements with the use of the travel demand model. The testing of potential improvement alternatives involved over 20 different model runs," and resulted with modeling of a preferred system of fiscally constrained improvements. Individual transportation system elements developed for modeling & testing are as follows: 1. Widen Main Street by adding one lane in each direction, from Wicks Lane south, including connecting portions of US 87 back to I-90 at the Lockwood Interchange. 2. Widen Main Street by adding two lanes in each direction, from Wicks Lane south, including connecting portions of US 87 back to I-90 at the Lockwood Interchange. 3. Extending 32 nd Street West north to Grand Avenue as a 4-lane arterial street. 4. Widening South Billings Boulevard by adding one lane in each direction, from King Avenue to a point just south of the Yellowstone River. 5. Extend Bench Boulevard/Yellowstone River Road south across Alkali Creek, inside the perimeter of Metra, with new one-way connections to 4 th and 6 th Avenues at Main Street. Included were improvements to existing Bench Blvd. north of Yellowstone River Road to US Widen Old Hardin Road by adding one lane in each direction between Johnson Lane and the Lockwood Interchange. 7. Reconstruct Shiloh Road as a 5-lane facility from Zoo Drive to Rimrock Road. 8. Re-designate Montana Avenue as a two-way street between Division Street and North 13 th Street. 9. Construct a 4-lane North Bypass that connects the I-90/I-94 interchange on the east with the Shiloh Road/I-90 Interchange on the West, aligned around the north perimeter of the metropolitan area. 10. Extend Montana Avenue as a 3-lane one-way facility to Main Street, including improvements to the 13 th Street underpass. 11. Extend 1 st Avenue South east to intersect with Main Street. 12. Extending 32 nd Street West north as a 4-lane arterial to connect with Rimrock Road opposite Zimmerman Trail. 13. Extend Aronson Avenue southeast to connect to Alkali Creek Road just west of its intersection with Airport Road. 14. Construct an arterial street connection between South Billings Boulevard and Old Hardin Road - the Southeast Bypass. 15. Extend Wicks Lane west as a 4-lane arterial street, wrapping around the north side of the airport, to connect with Hwy 3 opposite Zimmerman Trail - the Inner Belt Loop. Section 4 Page 27
57 16. Extend Daniel Street south to connect with Laurel Road via a new at-grade railroad crossing. 17. Build a tunnel through the rims to carry 32 nd Street West (extended north from Central Avenue) north, emerging above ground north of Hwy 3, with directional ramp connections to the highway. 18. Build a tunnel through the rims to carry an extension of N. 27 th Street north to intersect with Alkali Creek Road near the Saddle Club area. 19. Construction of a 4-lane freeway connection between the I-90/I-94 Interchange to Main Street just north of Mary Street. This is a part of the whole North Bypass alternative. 20. Construction of a 4-lane facility between the I-90/I-94 Interchange and Hwy 3. This is also a part of the North Bypass alternative, minus the Hwy 3 - Molt Road connection. 21. Extend and realign South Billings Blvd. North of King Avenue to Moore Lane. 22. Extending Zimmerman Trail north of Hwy 3 to connect with the North Bypass alternative proposed. Initially, individual project alternatives were modeled. Considering performance observations of project model analysis, a long and short range project list of improvements was developed. The package contained a variety of the project alternatives intended to complement each other to address key issues and goals of the plan. The projects were tested to enable an understanding of how different individual alternatives would work in conjunction with each other; to see if any synergies developed. The preferred alternative is shown in Figure 18 on the pages that follow: Section 4 Page 28
58 Figure 18 Preferred Alternative Section 4 Page 29
59 Overall Summary of Alternative Modeling The alternative modeled were selected and organized to obtain insight into the impacts of each individual alternative, as well as to learn how they work together; to find synergy between two or more alternatives. The recommended project list was assembled to address transportation issues identified for the Billings planning area. Transportation issues have been previously identified through the planning process for the 2000 Transportation Plan. This process was carried through for the 2005 update on regional, community, and neighborhood levels. Issues were identified with help from the TAC, as well as from citizen input at public meetings. Key issues addressed were: 1. Improved north-south arterial continuity in the west area 2. Improved capacity into and out of the Heights to downtown area 3. Improved mobility from the Heights to the west side of town 4. Improved truck/commercial vehicle access to, and through town (access to state highways and major facilities serving the Billings area) 5. Reduction of physical barrier impacts to transportation (rims, river, railroad tracks, etc.) Although many other issues were identified, the issues listed above were appropriate for analysis through travel demand modeling. The recommended project list should be considered in light of the above issues, and whether they help achieve project goals while addressing transportation issues of the region. Each of the alternative projects is discussed relative to the listed issues in the following sections. The cumulative impacts and merits of each alternative are considered relative to the issues. 1. Improved North-South Arterial Continuity In The West Area: Opportunities to improve continuity of north-south arterial streets in the west area are primarily available for areas west of 24 th Street West, in the less developed areas of the study area. A primary opportunity, one identified originally by the 1990 Plan, is the 32 nd Street West/Arlene Street corridor. This corridor has good continuity along 32 nd Street West from Hesper Road north to Broadwater Avenue. North of Broadwater, 32 nd Street West has been planned to extend north to Grand Avenue and on to Poly Drive, and then connect to Arlene Street to intersect with Rimrock Road at Zimmerman Trail, and is shown that way in the previous plan. The planned connection reaches Rimrock Road opposite the Zimmerman Trail connection, and provides important continuity beyond the barrier that the rimrocks present. 2. Improved Capacity Into And Out Of The Heights To Downtown Area: The Heights area is somewhat isolated from the remainder of the city by physical barriers. The rims form a formidable barrier between the Heights and downtown, as well as the west area. The Yellowstone River forms a significant barrier between the Heights and Interstate 90 and the Lockwood community. The rims and the river come in close proximity to each other northeast of downtown, and create a physical bottleneck," narrowing corridors for travel between the Heights and downtown. Main Street provides the only facility through this bottleneck, and consequently carries heavy traffic volume. The alternative that has emerged as feasible solutions within the Main Street corridor is the extension of Bench Blvd. through Metra Park. This alternative provided significant relief for Main Street traffic, but also has inherent difficulties. This alternative has been previously examined, even engineered, in some detail. This alternative solution is also part of the 1990 and 2000 Transportation Plan. Section 4 Page 30
60 The modeling indicates that the Bench Blvd. extension to 4 th and 6 th Avenues provides the most relief to Main Street traffic, when implemented, could hold Main Street traffic volume to 2005 levels or lower through critical sections of Main Street, even to the year The Aronson Avenue extension, while not providing as much relief for Main Street traffic, does carry significant volume. The traffic carried by this connection provides relief for Alkali Creek Road east of the Senators Blvd. intersection, and provides traffic relief for Senators Blvd. itself. This alternative does put more traffic on Airport Road compared to other alternatives considered, but traffic volume for this facility is lower under all alternatives tested than with just the committed system. 3. Improved Truck/Commercial Vehicle access to, and Through the City: Trucks and heavy commercial vehicles impose special demands on the transportation system of the region. Billings is situated on the north-south Camino Real corridor, producing truck route demand between I-90 and US12 via MT 3. Industrial and commercial areas of town need access for trucks. Several alternatives have been developed to directly accommodate this special demand. The north bypass alternatives which connect to I-90, the Daniels Street railroad grade crossing and the extension/re-alignment of S. Billings Blvd. all support improved truck and commercial vehicle access and through-city movements. Although significant, through-town truck demand is not high enough by itself to justify a new facility just for this purpose. Truck traffic does present an undesirable element of traffic, especially from a neighborhood perspective, and appropriate routes need to be identified. While the northeast bypass connection between I-90 and Main Street provides good connections to Highways 87 & 312, it does not provide a good connection between I-90 and MT 3 without the north bypass between Main Street and MT 3. This route placement presents some out-of-direction travel to trucks moving north/south in the Camino Real Corridor, but does remove this vehicle type from the most congested roadway segment in the City (Main Street) and eliminates the steep grades present on both the Zimmerman Trail and Airport Road routes currently available to serve this demand. Both the Daniels Street railroad at-grade crossing and the S. Billings Blvd. extension/realignment alternatives improve mobility for truck traffic across the railroad tracks in the south central portion of the city where most industrial and truck related uses are located. The travel demand model demonstrates the attractiveness of these alternatives, not only for trucks, but also for general travel within the city. The model cannot, however, allow assessment of the impact of the railroad grade crossing in terms of route safety, intersection geometry, and policy issues involved with new/improved grade crossings. 4. Reduction Of Physical Barrier Impacts To Transportation: Physical barriers like the rims, the Yellowstone River and the railroad tracks present impediments to transportation facilities and add cost to their construction. While the Yellowstone River does not present a barrier to travel throughout most of the city, it does present a barrier between the Heights and Lockwood, forcing travel between these two neighborhoods to move out-of-direction through congested routes. The rims present a significant barrier between the Heights and the downtown and west end areas. The railroad tracks effectively split the city, with access opportunities limited. Section 4 Page 31
61 Alternatives developed to address reduction of the impact of these barriers include northwest bypass alternatives, a new railroad grade crossing at Daniels Street, and a new connection between Molt Road and MT 3. New railroad grade crossings are difficult to obtain. Even improvements that increase traffic at existing grade crossings are undesirable. The railroad industry and the rest of the transportation community are trying to eliminate grade crossings in an effort to improve highway and rail safety. The moderate frequency of trains through the city is such that grade crossings are becoming safety and geometric concerns, and issues of capacity and delay are increasing. The Moore Lane grade crossing linking Laurel Road to Monad Road is very heavily used, carrying 6-8,000 ADT. The proximity of the railroad tracks to both Monad Road and Laurel Road virtually eliminates inexpensive solutions to grade-separate this crossing while still maintaining access to these two streets. Yet this crossing provides important access to the industrial area north of Laurel Road and west of 6 th Street West. The S. Billings Blvd. extension/re-alignment presents an opportunity to both improve truck access to the city as well as provide improved mobility across this barrier. The Molt Road - MT 3 connection proposed presents the ability to reduce the barrier of the rims without tackling them at their steepest or highest point. Local traffic would be encouraged here and a planning study has been completed with a desired alignment identified. Section 4 Page 32
62 Priority Ranking Program To provide an organized and logical approach to the development of Billings transportation system, a procedure for the systematic evaluation of priorities is necessary. With the magnitude of the improvement needs and the limited financial resources to accomplish the necessary improvements, the following program is proposed for evaluating which projects require the most immediate attention. The following sections of this report will explain the Priority Program further, the criteria that are used to rank problem locations by numeric value and the weighting method employed to reflect local preferences. METHODOLOGY The procedure that is outlined in the following report ranks projects by running them through a various set of criteria. A project is assigned a priority according to the relative importance of the transportation problem it is intended to solve. Projects will be classified into one of three categories: Intersection, Non-Intersection and New Link. This is done to compare each location with locations in the same category. This approach has several advantages. (1) One set of criteria may be used to rank problem locations within each category. (2) The priority program provides an objective method of merging Transportation Systems Management (TSM) reconstruction, and new construction projects into one priority listing. (3) Because each criterion tends to favor one project type or another, weights can be assigned to reflect policies established by elected officials. (4) By examining problem locations, areas not adequately addressed in the TSM or Long-Range Elements become more apparent, pointing out the need in some cases for additional study. The top projects in each category (intersection, non-intersection, and new link) will go forward to the Policy Coordinating Committee (PCC) for insertion into the Transportation Project Priority list of the current Transportation Improvement Program (TIP). PROBLEM LOCATIONS As noted previously, problems will be identified by problem locations. The process of identifying problem locations will be conducted in the following manner: 1. As listed in the 2005 Transportation Plan. 2. Additional problem locations may be designated by elected and appointed officials; as well as any citizen s group. 3. Other locations as noted by the staff will also be examined. This process will enable both staff and elected officials to provide input into perceived problems, which can then be evaluated and revised as conditions and data change. Section 4 Page 33
63 PRIORITIZATION PROCEDURES The 2005 Transportation Plan contains a comprehensive list of potential problem locations. It will be necessary to evaluate each location independently in terms of accident rates, average daily traffic, and other performance criteria. A numeric rating will be assigned to each location according to where it falls within the performance range established by the criteria. In each case, the rating scale will consist of points from one (1) to ten (10), with one (1) denoting the best condition and ten (10) representing the worst. After the criteria value has been determined for each location, it will be multiplied by the criteria weight assigned to it by local officials. The weighted values are then added to determine the total rating for each location. All locations will be ranked in descending order of these totals to produce a priority listing of locations. Highest on the list will be the locations presenting the worst traffic and engineering related problems. The potential problem locations will be rated numerically by inventorying each criteria and its weighted value to develop an overall ranking of locations and the magnitude of each location s problems in relation to all other locations. CRITERIA The selection of criteria reflects what is readily available from the Yellowstone County Board of Planning, City and County Public Works Departments and Montana Department of Highways. These criteria are updated annually or as conditions change, by one or more of the above agencies. This updating and availability makes for a database which is both current and flexible to changing situations. A brief definition and explanation of the criteria to be employed follows: Intersection Accident Rate This ratio will be computed on a per-million vehicles entering the intersection basis, with a ratio of 0 to.50 receiving no points and 5.00 and above accidents per million vehicles receiving a rating of ten (10). Accident figures will be averaged for three years. Accident data is obtained from the Montana Department of Highways and the City Engineer s Office with rates computed by the Yellowstone County Board of Planning. Level of Service Level of service describes conditions of travel time, freedom to maneuver, delays, comfort, convenience and safety. Six levels of service have been described for traffic facilities: level of service A which is the highest quality of traffic flow through level of service F, which is the lowest quality or complete congestion. Level of service F would receive ten (10) points, level of service E would receive seven (7) points, level of service D would receive five (5) points and level of service C would receive three (3) points. (Source Yellowstone County Planning Department and City Engineer s Office through use of the Highway Capacity Manual Transportation Research Board.) Average Daily Traffic The most current Average Annual Daily Traffic (AADT) will be used to measure areas of heaviest travel demand. Arterial and collector street sections will receive a rating from zero (0) (below 2000 ADT) through ten (10) (above 45,000 ADT). The ADT is the total number of vehicles in both directions utilizing a street in a twenty-four (24) hour period. New Link data and projections were derived from the 2005 Transportation Plan. (Source Yellowstone County Planning Department and Montana Department of Highways.) Section 4 Page 34
64 Non-Intersection Accident Rate The rate will be utilized for further delineation of accident locations and types. Projects may then be suggested to address non-intersection versus intersection improvements, e.g. access control versus intersection redesign. Accident data will be from Montana Department of Highways and Yellowstone County Board of Planning, with calculations performed by the Yellowstone County Board of Planning. System Warrant This criterion will provide a higher priority ranking to projects which would effectively complete a portion of a system. By tying into one improved facility five (5) points will be given, tying two improved facilities together would receive ten (10) points. Three (3) additional points will be added to any link project which incorporates intersection projects which appear on the priority list, thereby creating a more usable overall transportation system. All criteria to be used, the data which is inventoried, respective point ratings and weights (multipliers) are provided on the following page in Table 11. Section 4 Page 35
65 Table 11 Criteria Rating Intersection Accident Rate Accident Rate Rating Weight (Per Million Vehicles Entering Intersection) Above 10 3 (3 year average) Level of Service LOS Rating Weight F 10 3 E 7 D 5 C 3 Average Daily Traffic ADT Rating Weight (3 Year Average) 45, , , , , , , , , , ,000 0 Non-Intersection Accident Rate Accident Rate Rating Weight (Per Million Vehicle Miles) 40 Above 10 1 (3 year average) System Warrant Location Rating Weight (Effectively completes a portion of a system by linking with Connects two or 10 2 an existing adjacent facility) more upgraded sections Connects with one 5 upgraded section Incorporates one or more intersections which are also on the priority list 3 Section 4 Page 36
66 PROJECT IDENTIFICATION Once the weighted criteria have been applied to specific locations and relative priorities have been established among problem locations, projects will be proposed to meet identified transportation needs. Projects proposed to solve specific problems will retain the relative priority assigned to the problem locations. AIR QUALITY CONSIDERATIONS In the final prioritization process, the additional factor of air quality will be considered. This will be done for the reason that some projects, by their very nature and effect on the environment, will have to take precedence over others, e.g., air quality related projects. In cases where projects are proposed for a location which has been designated a hot spot or a non-attainment area, these projects may be considered to move ahead on the priority list. This consideration will be weighed by the Billings Technical Advisory Committee (TAC). CONCLUSIONS This Priority Program, as detailed, is a refinement of past programs, a reflection of new methods and a number of alterations dictated by changing information and needs. As such, this new priority programming will require updating and changing for many of the same reasons. In addition, experience will dictate improvements in these new procedures. As the available database expands, new criteria may be added and/or previous criteria deleted. Section 4 Page 37
67 Preferred System Model Based on results of alternatives modeling completed to date, a preferred system model network has been compiled for testing. This network incorporates the best elements of previous modeling efforts, considering the goals and objectives of the plan. The preferred network submitted for travel demand model analysis consists of the following locations: nd Street West improvements to extend/improve 32 nd Street West from Broadwater Avenue to Rimrock Road as a Principal arterial. 2. Aronson Avenue connection to Alkali Creek Road. 3. Bench Blvd. extension/improvements to extend Bench Blvd. south to intersect with Main Street at 4 th and 6 th Avenues. 4. Extension/re-alignment of South Billings Blvd. to connect to Moore Lane, including the Monad Road extension to 8 th Street West. 5. Widening of Old Hardin Road to 3 lanes as a super collector facility. This package of alternatives was modeled when selecting the recommended, fiscally constrained list of long-range system improvements; more thorough discussion of the selection process is provided in the next section. With the preferred (fiscally unconstrained) package of roadway improvements model, many of the areas projected to experience congested conditions by the year 2025 are expected to experienced improved operating conditions. Either through developing additional capacity, enabling more efficient mobility, or providing alternate route capacity, projected capacity problems are reduced when compared to the year 2025 committed projects-only scenario. While the Bench Boulevard and Aronson Avenue improvements provide additional capacity in the Main Street corridor, the 32 nd Street West extension, S. Billings Blvd. realignment, and Shiloh Road capacity improvements provide much needed north/south continuity for the west end. The Wicks Lane extension (Inner Belt Loop) and North Bypass provide attractive alternatives for east/west travel desire from the Heights to west end areas, and as a convenient conveyance for north/south Camino Real corridor travel demands. Section 4 Page 38
68 Selection/Prioritization of Long Range Street & Highway Improvements Table 12 on the following pages provides the illustrative list of potential long-range street and highway improvement projects that should be considered to meet future travel needs in the Billings Urban Area. Obviously, this list includes all of the possible projects that could support future travel demand, for 20 years and beyond. The table also contains planning level cost estimates for the long-range project alternatives. That total cost is approximately $314 million in 2005 dollars, which exceeds the available funding over the next 20 years. The projects were ranked by the TAC members based on their expected benefit (that is, their ability to solve the identified problems/deficiencies, and their perceived ability to meet plan goals and objectives related to key issues), as well as their associated cost. Benefits were considered in the areas of: 1. Current Congestion 2. Future Congestion 3. High Accident Locations 4. Regional Mobility 5. Community Mobility 6. Non-motorized Mobility 7. Pedestrian Safety The TAC was asked to confirm the rank of each project as high, medium, or low priority. The combination of benefit areas achieved and priority ranking by TAC was used to score the projects. The projects shown in Table 12 are sorted based on their composite score," with those scoring highest placed at the top of the listing. This listing serves as a strong basis for project priorities for inclusion in the fiscally constrained plan. 1. Staff also input the projects into our Priority Ranking Program. The Ranking Program assigned a physical ranking to each project. This ranking is listed with each project in Table 12. The Top Ten long-range street and highway projects, without consideration to constrained funding sources or other, difficult to quantify benefits and/or conflicts include: King Avenue Railroad Bridge, 20 th Street West to Laurel Road ramps, structure improvements, $6.9 million. King Avenue West, 31 st Street West to Shiloh Road, widen to 5 lanes, $4.3 million. Lake Elmo Drive, Hansen Lane to Wicks Lane, widen to 3 lanes, $2.3 million. 32 nd Street West, widen to 3 lanes from King Avenue West to Gabel Road, $3.3 million. Rimrock Road, 17 th Street West to Rehberg Lane, widen to 3 lanes, $1.6 million. Rimrock Road, Rehberg Lane to Shiloh Road, widen to 3 lanes, $1.4 million. 1 st Avenue South, 21 st Street to North 13 th Street, widen to 4-lane section, $500,000. Bench Blvd. north, widen to 3 lanes from Lake Elmo Drive to Highway 312, $5.5 million. Central Avenue, BBWA to 48 th Street West, widen to 5-lane section, $7.3 million. Grand Avenue, Rehberg to Shiloh Road, widen to 4-lane section, $3.6 million. When the key issue areas of mobility, access and route continuity are considered, other projects may rank higher and some are dropped from further consideration. Some projects listed are included within other listed projects, or even directly conflict and/or compete with other projects. Section 4 Page 39
69 However, the projects listed represent most viable solutions to existing or expected transportation deficiencies. These projects are expected to provide the greatest benefit for the community in terms of reduced congestion and improved traffic. These projects are discussed further in Section 7 in terms of available funding for implementation. Section 4 Page 40
70 Table 12 - Long-Range Plan Projects LONG RANGE PROJECTS - Fiscally Constrained NON-INTERSECTION Priority Rank PROJECT DESCRIPTION Project Type EST. COST Potential Funding Sources LOS Score Accident Score ADT Score System Warrant Total Score NR NR NR NR NR NR NR NR Airport Rd., Alkali Creek R. to Mt 3 (PROJECT DEVELOPMENT UNDERWAY) Airport Rd., N 27th St./Mt 3 (PROJECT DEVELOPMENT UNDERWAY) Alkali Creek Rd., Aronson Ave. to Airport Rd. (PROJECT DEVELOPMENT UNDERWAY) Alkali Creek Rd., Airport Rd. to Senators Blvd. (PROJECT DEVELOPMENT UNDERWAY) Grand Ave., Division St. to 24th St. (PROJECT DEVELOPMENT UNDERWAY) Rimrock Rd., Shiloh Rd. to 54th St. W (PROJECT DEVELOPMENT UNDERWAY) S Billings Blvd., Laurel Rd. to I-90 Interchange (PROJECT DEVELOPMENT UNDERWAY) Shiloh Rd., I-90 to Poly Dr. (ENVIRONMENTAL STUDY PROJECT UNDERWAY) Table 12 Continued on next page. Reconstruct to 4-ln. Reconstruction $ 13,000,000 Reconstruct to provide grade separation of mvts. Reconstruct intersection w/underpass at Airport Rd., connect to 6th Ave. N Reconstruction $ 7,000,000 1, 8,15, 17 1, 2, 9, 15, 17 Reconstruction $ 1,400,000 15, 17 Shoulders, geometrics Reconstruction $ 3,200,000 Widen/Reconstruct to 5-ln. Widen to 3-ln. for auxiliary (left-turn) ln. Reconstruct to 4-ln. principal arterial Reconstruct to 4-ln. divided w/aux lanes at interchange, new Rimrock Reconstruction $ 9,200,000 Reconstruction $ 2,000,000 Reconstruction $ 1,300,000 Reconstruction $ 20,000,000 8, 15, 17 1, 8, 15, 17 6, 8, 15, 16, 17 1, 15, 17 1, 15, 17 Section 4 Page 41
71 Table 12 continued. Priority Rank NR NR NON-INTERSECTION PROJECT DESCRIPTION Project Type EST. COST Shiloh Rd., Poly Dr to Rimrock Rd. (PROJECT DEVELOPMENT UNDERWAY) 6th Ave. N./Bench Blvd.Connection (PROJECT DEVELOPMENT UNDERWAY) King Ave. R.R. Bridge, 20th St. W. to Laurel Rd. Ramps King Ave. W, 31st St. W. to Shiloh Rd. Lake Elmo Dr., Hansen to Wicks Ln. 6 32nd St. W Rimrock Rd., 17th St. W to Rehberg Ln. Rimrock Rd., Rehberg Ln. to Shiloh Rd. 1st Ave. S, 21st St. to N 13th St. 9 Bench Blvd. North Table 12 continued on next page. Reconstruct to 4-ln. divided w/aux lanes at interchange, new signals Reconstruction $ 3,700,000 Potential Funding Sources 1, 15, 16, 17 Reconstruction/Bridge Reconstruction $ 6,000,000 2 Structure improvements Reconstruction $ 6,900,000 Widen to 5-ln. section (principal arterial) Widen to 3-ln., sidewalk, (primary school route) Widen to 3-ln. from King Ave. W to Gable Rd. Widen to 3-ln. for auxiliary (left-turn) ln. Widen to 3-ln. for auxiliary (left-turn) ln. Widen to 4-ln. no curb & gutter Widen to 3 lane section from intersection of Lake Elmo North to Highway 312 Reconstruction $ 4,300,000 12, 15, 17 1, 15, 17 LOS Score 7 3 Acciden t Score ADT Score System Warrant Total Score Reconstruction $ 2,300, Reconstruction $ 3,300,000 15, 16, Reconstruction $ 1,600,000 1, 8, Reconstruction $ 1,400,000 1, 6, 8, Reconstruction $ 500,000 1, Reconstruction $ 5,500,000 MDT, 8, Section 4 Page 42
72 Table 12 continued. Priority Rank NON-INTERSECTION PROJECT DESCRIPTION Project Type EST. COST Potential Funding Sources LOS Score Acciden t Score ADT Score System Warrant 10 Central Ave. BBWA 1, 8, 15, Widen to 5-ln. section Reconstruction $ 7,300,000 Canal to 48th St. W 16, Grand Ave., Rehberg Ln. 1, 15, Reconstruct to 4-ln. section Reconstruction $ 3,600,000 to Shiloh Rd. 16, Broadwater Ave., 28th St. 15,16, Reconstruct to 5-ln. section Reconstruction $ 3,300,000 W to Shiloh Rd Pemberton Rd., BBWA to Main St. Widening Reconstruction $ 2,600, Wicks Ln., Governors Reconstruct to 4-ln. divided Blvd. To High Sierra (part highway section of Inner Belt Loop) Reconstruction $ 1,100,000 15, Old Hardin Rd., Co Lockwood Interchange to Widen to 3-ln. section Reconstruction $ 5,100,000 1, 15 Johnson Ln. MDT Pinehills Interchange Overlay, 6.3 Miles Reconstruction $ 3,300,000 7 MDT Pinehills Interchange S.E. Overlay Reconstruction $ 3,700,000 7 * Zimmerman Trail Widening Reconstruction $ 10,000,000 INTERSECTION 3 N 27th St./Rimrock Rd. NR nd St. W (PROJECT DEVELOPMENT UNDERWAY) North Bypass (ENVIRONMENTAL STUDY PROJECT UNDERWAY) 36th St. W, MT. Rushmore to Central Ave. Aronson Ave. Grade separation (interchange) Extension from Broadwater to Poly Dr. 4-ln. divided section from I- 90/94 Interchange to Highway 3 New construction of nonexistent segment Extension to Alkali Creek Rd. * This project is contingent on receipt of Congressionally allocated funds. Table 12 continued on next page. Reconstruction $ 4,200,000 NEW LINKS New Construction New Construction New Construction New Construction 1, 15, 17 $ 5,100,000 15, 17 5 Total Score $ 150,000,000 8, 9, $ 275,000 15, $ 2,000,000 8, 15, 16, Section 4 Page 43
73 Table 12 continued. 3 Inner Belt Loop 3 3 Co ** Monad Rd., Moore Ln. to 8th St. W Montana Ave., N 18th St. to Main St., 1st N. Couplet Old Hardin Rd., Johnson Ln. to Becraft Railroad Feasibility 4-ln. divided section from Wicks Ln. at High Sierra to Zimmerman Trail New connector along R.R. tracks Recon. To 3-ln., 1-way w/connection to 1st Ave. N., new bridge at N. 13th, convert 1st Ave. N. to 1-way, Main St. to N. 18th St. New connection south of existing to eliminate "double intersection" Relocate the main line railroad out of Downtown Billings NEW LINKS New Construction New Construction New Construction New Construction $ 14,000,000 $ 1,900,000 $ 2,700,000 8, 15, 17 8, 15, 17 9, 10, 15, 17 $ 1,100, Feasibility Study $ 300, TOTAL COST YEARS $314,175,000 NR = Not rated because project is underway Co = County projects ** This project is contingent on receipt of Congressionally allocated funds. If Congressionally directed funds are not available, the project will not be undertaken. If any project is recommended by the railroad feasibility study, the Billings Long Range Transportation Plan will require an update. Potential Funding Sources: 1. STPU - Surface Transportation Program - Urban Funds 10. STPRP - Rail/Highway Crossing Protective Devices Program 2. MACI - Montana Air & Congestion Initiative Guaranteed Program 11. STPRR - Rail/Highway Crossing Elimination of Hazard Program 3. MDT Discretionary - Air & Congestion Program 12. HBRRP - Highway Bridge Replacement and Rehabilitation Program 4. CTEP - Community Transportation Enhancement Program 13. SFC - State Funded Construction (State) 5. STPP - Surface Transportation Program - Primary Funds 14. FTA - Federal Transit Administration - Section 5307, 5309 & STPS - Surface Transportation Program - Secondary Funds 15. State Fuel Tax Funds - City and County 7. IM - Interstate Maintenance Funds 16. Developer Construction 8. STPHS - Surface Transportation Program - Hazard Elimination Funds 17. Arterial Fee 9. NHS - National Highway System Funds 18. STPX - STP Flexible Section 4 Page 44
74 Figure 19 - Long Range Plan Project Locations Section 4 Page 45
75 Functional Classification Map The roadways shown in Figure 20 are classified by type, called a Functional Classification. The previous Transportation Plan used a three-level system with classifications of Principal Arterial, Minor Arterial, and Collector. That classification is maintained with this plan update for consistency, with the addition of a Freeway classification. Functional classification is a system by which streets and roadways may be distinguished by types according to their function within the entire transportation network. Functional classification considers the type and distance of travel served by the roadway, as well as the land access function. Urban area streets contain a varied mix of the various functional classifications, and not all street elements adhere strictly to their assigned, or intended functional classification. The three major levels of functional classification considered in the context of this plan are Freeways, Arterial Streets, and Collector Streets. Arterial Streets are further sub-divided into Principal and Minor Arterial classes. It should be noted that the Functional Classifications used for purposes of this plan is not the same functional classification used by MDT as the basis for federal funding distributions. Freeways Freeways serve high speed, long distance travel movements and provide little access to adjacent lands. Often included within the arterial classification, freeways are unique in that they typically have no at-grade intersections, instead utilizing grade-separated interchanges with directional ramps to serve entering and exiting traffic. Access to freeways is strictly controlled and regulated. Without at-grade intersections to impede traffic flow, freeways have significantly higher carrying capacity than arterial streets. Principal Arterial Streets Intended to provide a high level of mobility, arterial streets favor mobility functions over land access functions. Higher speeds, long distance continuity, and higher levels of service combine to efficiently serve longer distance trips. To maintain system speed and level of service, access management is critical to preserve through-put capacity and roadway safety. Arterial streets provide connections to both higher class roadways (freeways) and lower classifications (collector streets). Minor Arterial Streets Similar to Principal Arterial streets, Minor Arterial streets are intended to favor mobility over land access, and carry traffic over longer distances. Distinguished by lower capacity and operating speeds, Minor Arterial streets typically have shorter continuity than Principal Arterial streets, and may serve land access to a greater degree. Collector Streets Collector streets, as the name implies, collect traffic from primary access roads (local streets), and carry it to arterial streets for longer distance travel. They are the link between the local land access system and the arterial street network. Collector streets should not have the long distance continuity of arterial streets. Ideally, Collector Streets should provide access into, but not through residential neighborhoods, for long distance continuity attracts long distance, high speed traffic not appropriate on collector facilities. The functional classification of existing streets as shown in the 2005 Transportation Plan is appropriate and shows insight to future needs. The need for higher level roadways is recognized with planning for Principal Arterial facilities on approximately one-mile spacing for Section 4 Page 46
76 the developing West End of Billings and portions of the Heights neighborhoods. Aside from new connections and proposed new corridors, few changes to the 2005 Plan principal arterial street network are proposed. For the most part, collector facilities were not shown differently than the 2005 Plan for fringe, undeveloped areas. The actual location of collector facilities should remain somewhat flexible in order to best serve the specific needs of neighborhoods under specific development proposals. Several guidelines should, however, be observed when planning collector facilities: Long distance continuity should be avoided, keep continuity less than 2 miles. Collectors should intersect arterial streets such that uniform spacing of intersections is maintained at approximately ¼ mile intervals on the arterial street for good signal progression and flow capacity. Residential direct access frontage should be avoided or limited on collector streets. Based on the recommended long range street and highway improvements developed during this planning process, Figure 20 provides an updated Functional Classification map for the Billings Urban Area, showing freeway, arterial and collector classifications. Streets not shown as collector or arterial streets on the plan are classified as local streets. The figure indicates functional classifications for roadways that exist, or are anticipated to exist in the near future, as well as corridors not yet fully planned or engineered. Transportation corridors are indicated which will realistically not develop within the 20-year planning horizon of this study. It is imperative, however that corridors be preserved now for future use. Experience has taught us that if future corridors are not preserved and actively planned, usefulness of the corridors tends to be degraded by development, or development may render the transportation use itself undesirable. Section 4 Page 47
77 Figure 20 - Functional Classification Map Section 4 Page 48
78 Air Quality/Conformity Billings Urban Area 2005 Transportation Plan Update On November 15, 1990, the Clean Air Act Amendments (CAAA) of 1990 were signed into law. The CAAA is an extremely detailed and complex law that has had a major impact on the programs of the Federal Highway Administration (FHWA) and the Federal Transit Administration (FTA). The Act requires substantial emissions reductions from the transportation sector. The purpose of the conformity provision of the CAAA is to ensure consistency between the Federal transportation planning process and Federal air quality planning process. The regulations require that for an urban area not in attainment of National Ambient Air Quality Standards for carbon monoxide, it must conduct a conformity determination to demonstrate that its transportation plan or any revisions to its plan will not adversely affect air quality. BACKGROUND: On February 9, 2001, the Governor of Montana submitted a request to redesignate the Billings not classified carbon monoxide (CO) nonattainment area to attainment for the CO National Ambient Air Quality Standard (NAAQS). The Governor also submitted a CO maintenance plan. In this action, EPA approved the Billings CO redesignation request and the maintenance plan effective on April 22, This action, approved a change in the legal designation of the Billings area from not classified nonattainment for CO to a limited maintenance plan attainment area and approved the maintenance plan that is designed to keep the area in attainment for CO for the next 10 years. The Billings area was originally designated as nonattainment for CO under the provisions of the 1977 Clean Air Act (CAA) Amendments (see 43 FR 8962, March 3, 1978). On November 15, 1990, the Clean Air Act Amendments of 1990 were enacted (Pub. L , 104 Stat. 2399, codified at 42 U.S.C q). Under section 107(d)(1)(C) of the CAA, the Billings area was designated as nonattainment for CO because the area had been previously designated as nonattainment before November 15, The Billings area was classified as a not classified CO nonattainment area as the area had not violated the CO NAAQS in 1988 and Under the CAA, designations can be changed if sufficient data are available to warrant such changes and if certain other requirements are met. See CAA section 107(d)(3)(D). Section 107(d)(3)(E) of the CAA provides that the Administrator may not promulgate a redesignation of a nonattainment area to attainment unless: (i) The Administrator determines that the area has attained the national ambient air quality standard; (ii) The Administrator has fully approved the applicable implementation plan for the area under CAA section 110(k); (iii) the Administrator determines that the improvement in air quality is due to permanent and enforceable reductions in emissions resulting from implementation of the applicable implementation plan and applicable Federal air pollutant control regulations and other permanent and enforceable reductions; Section 4 Page 49
79 (iv) the Administrator has fully approved a maintenance plan for the area as meeting the requirements of CAA section 175A; and, (v) the State containing such area has met all requirements applicable to the area under section 110 and part D of the CAA. Prior to the redesignation request being approved, all applicable State Implementation Plan (SIP) elements were also fully approved. Therefore there were no outstanding SIP elements necessary for the Billings redesignation. With the redesignation, Billings must comply with the ten year plan and must submit in 2010 a revised maintenance plan that provides for maintenance of the CO standards for an additional ten years. Provided Billings does not exceed the 8-hour standard of 9.0 ppm, more than once per calendar year during the next 20 years, it can then request full attainment status. DEQ and the local City-County Health Department continue to monitor and analyze CO levels in Billings to help demonstrate ongoing compliance with the CO standards. The following conformity determination was made in accordance with the above referenced Federal regulations. The determination applies to the updated Transportation Plan, documented as the Billings Urban Area 2005 Transportation Plan" (TP) and the Carbon Monoxide State Implementation Plan (SIP) for the State of Montana. CONFORMITY DETERMINATION: 1) Determination that the TP is consistent with the SIP. Air quality planning has been an integral part of the Billings Urban Area transportation planning process for a number of years. As such, air quality has received specific attention during development of the numerous plans, programs and projects of the process. Additionally, a number of years ago, a cooperative agreement was entered into between the Billings (MPO) and State Air Quality Bureau which formalized the procedures for integrating and coordinating air quality and transportation plans and programs. The general consultation guidance contained in the State of Montana Air Quality Rules on Conformity (ARM Chapter 17.8 Subchapter 13) was used in the preparation of this conformity determination and emissions analysis. These rules incorporate by reference Federal regulations contained in 40 CFR Part 93, Subpart A. This generally involved a cooperative and coordinated process including the Montana Department of Transportation, the Montana Department of Environmental Quality and the Billings (MPO). Section 4 Page 50
80 The actions and activities of the local transportation plan and process closely parallel those of the SIP and support its intentions of achieving and maintaining the National Ambient Air Quality Standards (NAAQS). 2) Determination that the TP does not contradict the SIP Specific Transportation Control Measures have not been proposed for the Billings area recently, however, the SIP completed in 1986 included the widening of Exposition Drive (Main Street) and the signalization at Main Street and First Avenue North. Both of these projects were completed in There are no Transportation Control Measures (TCM s) in the State Implementation Plan (SIP) and therefore there are no specific TCM s recommended for implementation in this TP. As such, the SIP doesn't contain any transportation control measures with which the TP can contradict. Additionally, the TP doesn't contain any goals, directives, recommendations, or projects that contradict in a negative manner any specific requirements or commitments in the SIP. 3) Assurance that the TP provides for transportation control measures in the SIP. As stated in the previous section, the SIP does not contain any transportation control measures for the Billings nonattainment area that are of the nature for inclusion in the TP or TIP. Therefore, an assurance that the TP provides for the timely implementation of transportation control measures in the SIP is not applicable. 4) Determination that the TP contributes to CO emissions reductions. An October 1995 EPA policy for limited maintenance plans in nonclassifiable CO nonattainment areas included a discussion of the applicability of the conformity rule requirements in these areas. The following is in response to the applicable requirements. A limited maintenance plan attainment area is not required to project emissions over the maintenance period, because the air quality design value for the area is low enough that the stationary source permitting program, existing SIP controls and Federal control measures provide adequate assurance of maintenance of the CO standard over the initial 10-year maintenance period. The design value must continue to be at or below 7.65 ppm. The CO average design value for the Billings area is 5.5 ppm, which is well below the requirement. Therefore, the Billings area adequately demonstrates maintenance. Emissions budgets in limited maintenance plan areas may be treated as essentially not constraining for the length of the initial maintenance period because it is unreasonable to expect that such an area will experience so much growth in that period that a violation of the CO NAAQS would result. In Billings, Federal actions are considered to satisfy the transportation conformity rule s Section 4 Page 51
81 requirements for expeditious implementation of transportation control measure because there are no control measures in the Billings CO SIP element. For general conformity in limited maintenance plan areas, all projects are considered to satisfy the budget test specified in 40 CFR (a)(5)(i)(A) once the redesignation request has been approved by EPA. For transportation conformity, federal actions requiring conformity determinations are considered to satisfy the budget test once the limited maintenance plan for the area has been found adequate by EPA. The limited maintenance plan and redesignation request for Billings have been approved by EPA. Tracking CO for the Billings area consists of monitoring and analyzing CO concentrations by the Montana Department of Environmental Quality to demonstrate ongoing compliance with the CO NAAQS. Based on the satisfaction of these requirements, as noted, no regional emissions analysis under Sections or of the conformity rule is required for plan conformity. CONCLUSION: It is the conclusion of this determination that because of the satisfaction of the aforementioned conditions and requirements, the 2005 Transportation Plan for the Billings Urban Area is found to be in conformance with the Clean Air Act Amendments of 1990 and the Carbon Monoxide State Implementation Plan for the State of Montana. Section 4 Page 52
82 Transportation System Management (TSM) Strategies In addition to the long range street and highway projects, there are numerous smaller projects that would improve operation of the street and highway network and reduce travel delay. Generally, these are referred to as Transportation System Management (TSM) strategies that represent low-cost opportunities to better manage and operate the existing transportation infrastructure for the near-term future. They often include traffic signal coordination and upgrades, intersection improvements, access control, operational changes, etc. Table 13 illustrates the Short-range/TSM projects not yet implemented from the 2000 Transportation Plan as well as the new TSM measures developed as part of this 2005 Transportation Plan. Short-range projects and TSM elements with this plan update are approximately $13 million of improvements that will optimize the transportation system in the Billings Urban Area over the next 10 years. Included in the cost is continuation of the City-wide Signal Priority Program (at $150,000 per year) and the City-wide Sidewalk Installation Program (at $300,000 per year). Section 4 Page 53
83 Table 13 - Short Range & TSM Plan Project Elements SHORT RANGE PROJECTS Priority Rank INTERSECTION PROJECTS PROJECT DESCRIPTION Project Type EST. COST Potential Funding Sources LOS Score Accident Score ADT Score Total Score 1 King Avenue West, 32nd St. W. to I-90 1 Main Street / 6th Avenue North 1 Main Street / Lake Elmo Drive 2 Main Street / Hilltop Road 3 24th Street West, King Avenue West to Grand Avenue 4 Division Street - Grand Avenue to Montana Avenue 4 Grand Ave, Division St to 24th St W 5 Broadwater Ave., Division to 24th Street West 6 Central Avenue, 6th St. West to Stewart Park Rd. Table 13 continued on next page. Provide coordinated signal system for corridor Striping on SB approach to improve right-turn capacity and geometry Improve SB Lake Elmo right turn capacity through geometry Provide double left-turn lanes for NB Main Street Signal Coordination., access mgt. plan Signal Coordination, access management Provide Traffic Signal Coordination Signal Coordination., access mgt. plan Signal Coordination., access mgt. plan Signal System $430,000 1,2,8,14, Recon., Striping $25,000 1,2,3,9,14, Reconstruction $375,000 2,3,9,14, Reconstruction $250,000 1,2,3,9,14, Signal System $400,000 1,2,14, Signal System $300,000 1,2,8,14, Signal System $634,000 1,2,8,14, Signal System $350,000 1,2,14, Signal System $350,000 1,2,14, Section 4 Page 54
84 Table 13 continued. INTERSECTION PROJECTS Priority Rank PROJECT DESCRIPTION Project Type EST. COST Potential Funding Sources LOS Score Accident Score ADT Score Total Score 7 Moore Lane / Laurel Road 8 15th Street West, Central Avenue to Grand Avenue 14 27th St./Railroad Grade Crossing 14 Hilltop Road / Nutter Boulevard 14 Rimrock Road / Rehberg Lane 15 1st Avenue South, State Ave. to Minnesota Ave th Street West / Parkhill Drive 16 N. 18th Street / 1st Ave. North 16 S. 27th Street / I-90 EB Ramps 17 Lewis Avenue / 8th Street West 18 1st Avenue South / S 31st Street NR City-wide Signal Priority Program* Co Blue Creek Road, South of Jellison Table 13 continued next page. Study for geometric and safety improvements (inc. Grade Crossing) Signal Coordination, widen for aux. lanes at intersections Grade crossing and signal improvements Study $8,000 8,10,11,14, Signal System $425,000 2,14, Multiple projects $600,000 9,10, Reconstruction, Signs, Recon., Signs $13,500 1,14, Markings Signal, auxiliary lanes Signal $150,000 1,8,14, Signal Coordination Signal System $200,000 1,2,14, Reconstruct to eliminate "jog", Signals Improve turn radius for NB to EB turns Reconstruction, Signs, Markings Study alternatives to signalization Reconstruction Reconstruction Reconstruction $140,000 8, $50,000 1,8,14, Recon., Signs $15,300 7,9,14, Study $12,000 8, Reconstruction $6,400 1,14, Annual Signal installation Signals $150,000 2,14, 16 program (mixed) Intersection auxiliary lanes Reconstruction $200,000 1,14, 16 Section 4 Page 55
85 Table 13 continued. INTERSECTION PROJECTS Priority Rank PROJECT DESCRIPTION Project Type EST. COST Potential Funding Sources LOS Score Accident Score ADT Score Total Score Co Highway 312 / Dover- Reconstruction, Signs, Recon., Signs $18,000 1,14 Bitterroot Drive Markings Co Highway 87E / N. Frontage Road Reconstruction, Signs, Markings Recon., Signs $177,500 9,14 MDT I-90 Lockwood to Johnson Lane Mill & Overlay - Seal & Cover $260, MDT Pinehills Interchange Overlay $968,000 7 West MDT Shiloh/Monad Turn Bay $241,000 8 MDT Electrical - Various Signing/Flashers $150,000 8 Locations MDT Various Safety Turn Bays $522,000 8 Improvements: 1) 24th St W. & Phyllis Right in/out Island 2) State Avenue 1st Ave. S. to 27th Street Re-Stripe to 3 Lanes 3) Hardin Road & 4-Way Stop Islands Lockwood 4) I-90 Lockwood Interchange Ramp Modifications MDT Johnson Lane Electrical Signal Phasing $11,000 8 MDT Moore Lane R.R. Crossing $458,000 10, 11 MDT Gabel Road R.R. Crossing Signal $143, MDT Johnson Lane R.R. Crossing Signal $118, MDT 1st Avenue S. R.R. Crossing Circuitry Upgrade $126, Table 13 continued next page. Section 4 Page 56
86 Table 13 continued. Priority Rank NON-INTERSECTION PROJECTS PROJECT DESCRIPTION Project Type EST. COST Potential Funding Sources LOS Score Accident Score ADT Score Total Score 9 19th Street West, Central Avenue to Grand Avenue 9 Lewis Avenue, Division Street to 8th Street West 10 Lake Elmo Drive, Robertson to Rolling Hills 18 N. 13th Street, 1st Avenue North to 4th Avenue North Priority Rank Remove parking, restripe, add bike lanes 3-lane plus bike lanes, remove pkg. Widen to 3-lanes with sidewalk Reconstruction to 3-ln, remove parking, Signs, Signals TSM Reconstruction Widen/Reconstr uction. $100,000 2,4, $20,000 2,4, $200,000 2,4, Recon., Signal $50,000 1,14, NEW LINKS PROJECT DESCRIPTION Project Type EST. COST Potential Funding Sources LOS Score Accident Score ADT Score Total Score NR City-wide Sidewalk installation** PROJECT COST TOTAL Additional 9 years of sidewalk program Additional 9 years of signal program Annual construction program New Const. $300,000 2,4,14 $8,946,700 $2,700,000 $1,350,000 TOTAL COST YEARS : $12,996,700 NR = Not rated because project is ongoing Co = County Projects * Ranking of signal projects is covered under a separate program ** Ranking of sidewalk projects is covered under a separate program Section 4 Page 57
87 Potential Funding Sources: 1. STPU - Surface Transportation Program - Urban Funds 10. STPRP - Rail/Highway Crossing Protective Devices Program 2. MACI - Montana Air & Congestion Initiative Guaranteed Program 11. STPRR - Rail/Highway Crossing Elimination of Hazard Program 3. MDT Discretionary - Air & Congestion Program 12. HBRRP - Highway Bridge Replacement and Rehabilitation Program 4. CTEP - Community Transportation Enhancement Program 13. FTA - Federal Transit Administration - Section 5307, 5309 & STPP - Surface Transportation Program - Primary Funds 14. State Fuel Tax Funds - City and County 6. STPS - Surface Transportation Program - Secondary Funds 15. Developer Construction 7. IM - Interstate Maintenance Funds 16. Arterial Fee 8. STPHS - Surface Transportation Program - Hazard Elimination Funds 17. SFC - State Funded Construction 9. NHS - National Highway System Funds 18. STPX - Flexible Section 4 Page 58
88 Figure 21 - Short Range Plan/TSM Project Locations Section 4 Page 59
89 Billings Urban Area 2005 Transportation Plan Administrative Update Travel Demand Management (TDM) Strategies There is a wide range of strategies available to the Billings Urban Area to manage travel demand and potentially to reduce the number of vehicle trips made on a daily basis. The TDM strategies recommended for consideration include: 1. Alternate Work Hours/Schedules Staggered hours/compressed work week Flex-time Telecommuting 2. Bike & Pedestrian Programs Bike loaner programs Bike tool libraries Lockers/racks Trails/bike lanes - on-street and off-street 3. Education and Outreach Employer-based transportation management associations (TMA s) to encourage use of alternate modes Promotional/episodic events - Great Commute Week, Pollution Solution, Find Another Way Day, etc. 4. Trip Reduction Mandates Emissions/VMT tax Trip reduction ordinances 5. Parking Management Auto-restricted zones Close-in/preferential parking for carpools/vanpools Parking fee structure with preference for carpools/vanpools Parking fee cash-out for using alternate mode Park-n-ride/remote parking w/shuttles 6. Regional Ridesharing Carpool matching/formation Vanpool/jitney services 7. Transit On-site sales/discounted bus passes Shelters/transfer facilities Express/subscription services 8. Urban Design/Land Use Mixed use development Transit/pedestrian-oriented design The Billings Urban Area, specifically through the Metropolitan Planning Organization (MPO), should implement a TDM program incorporating the strategies listed above in order to help reduce travel demand, particularly automobile traffic on the roadway network, and to improve air quality and the overall quality of life in Billings. These programs are recommended and would be available on a voluntary basis; the potential reduction in trip making could be 2-5% depending on the level of participation. Some strategies, such as flex-time, would lengthen the peak travel period and thereby reduce the impact of the traffic volumes during those peak periods. Section 4 Page 60
90 Billings Urban Area 2005 Transportation Plan Administrative Update Estimates of Future Traffic Volumes The fiscally constrained list of projects, those most likely to be implemented over the next 20 years, were used to model travel demand and traffic volume conditions at two future horizons; the year 2015 and the year The traffic model was executed with the prioritized constrained projects for both forecasting horizons. Traffic assignments obtained from the modeling were adjusted to recognize base-year model assignment error and are reported as shown in Figures 22 and 23 for the 2015 and 2025 forecasting horizons respectively. The design traffic volumes shown on these two figures are based on implementation of only the fiscally constrained projects identified for these planning horizons (recommended improvements). The implementation of the recommended projects does have positive impacts on the regional transportation system. The recommended projects relative to expected congestion in year 2025 are shown in Figure 24. Commonly referenced regional measures of the transportation system include regional Vehicle Miles Traveled (VMT), Vehicle Hours Traveled, and Average Speeds for system elements. Table 14 summarizes the existing and committed system parameters for these elements as well as the parameters for the regional system with the recommended improvements in place. The data indicates travel is removed from the Local streets and carried more by Minor and Principal Arterial streets with recommended improvements. The data also indicates an overall reduction of travel time and increased travel speeds. Functional Class 2005 Existing Table 14 Summary of System Performance Statistics 2015 Committed Vehicle Miles Traveled 2015 Recommended 2025 Committed 2025 Recommended % Change Interstate 344, , , , , % Principal 894,107 1,013,410 1,163,276 1,132,713 1,300, % Minor 375, , , , , % Collector 326, , , , , % Local 338, , , , , % Total 2,281,117 2,699,960 2,793,823 3,118,802 3,227, % Functional Class 2005 Existing 2015 Committed Vehicle Hours Traveled 2015 Recommended 2025 Committed 2025 Recommended % Change Interstate 5,864 7,425 7,653 8,985 9, % Principal 41,008 48,995 44,597 56,981 51, % Minor 14,308 19,397 18,505 24,486 23, % Collector 12,697 17,138 14,502 21,580 18, % Local 35,122 46,854 47,804 58,585 59, % Total 109, , , , , % Section 4 Page 61
91 Billings Urban Area 2005 Transportation Plan Administrative Update Functional Class 2005 Existing 2015 Committed Speed 2015 Recommended 2025 Committed 2025 Recommended % Change Interstate % Principal % Minor % Collector % Local % Section 4 Page 62

92 Billings Urban Area 2005 Transportation Plan Administrative Update Figure 22 - Design Traffic Volumes, Year 2015 Section 4 Page 63

93 Billings Urban Area 2005 Transportation Plan Administrative Update Figure 23 - Design Traffic Volumes, Year 2025 Section 4 Page 64
94 Billings Urban Area 2005 Transportation Plan Administrative Update Figure 24 - Recommended Projects Relative to Expected Congestion Design Traffic Volumes, Year 2025 Section 4 Page 65
95 Section 5. Public Transit and Transportation Element Existing Public Transit Services The City-operated Metropolitan Transit System (MET) in Billings provides service Monday through Friday on 18 fixed routes within the Billings city limits (as shown in Figure 26). MET operates a fleet of eleven 35-foot RTS buses, six 35-foot Nova Buses, two 30-foot low floor Eldorado buses, and six 35-foot Gillig buses. The eleven RTS buses will be replaced with 35- foot Gillig buses over the next three years. MET also provides service on Saturday with 9 fixed routes. The 18 M-F routes include nine all-day routes, seven peak-hour only routes, and two midday only routes. There are also two tripper routes near school times. The MET system operates on a pulse system with all of the buses arriving at and departing from the downtown transfer area at the same times to allow convenient transfers from one route to another. The downtown transfer area is located along 3 rd Avenue North between 25 th Street and North Broadway. The bus routes also meet in the Stewart Park Transfer Center near the Rimrock Mall which serves as a second major transfer area for the system. Service is generally provided from 6:05 AM to 6:45 PM, Monday through Friday, and from 8:10 AM to 5:45 PM on Saturdays. The M-F service is generally provided on a 60-minute headway or frequency, with a few exceptions of routes that operate on 30-minute or 90-minute headways. The Saturday service is provided on a 70-minute headway. Over time, MET has experienced increasing difficulty maintaining these headways due to increasing traffic volumes along the routes. There may be opportunities to further improve traffic signal progression or consider signal pre-emption along various routes to facilitate schedule maintenance. Figure 25 illustrates the annual ridership trends on the fixed route MET service. The significant increase in 1988 and 1989 reflects a change in the School District s busing policy. The Board changed service from the 1-mile limit to the statewide requirement of a 3-mile limit, thus reducing the number of students who could be carried on school buses. After a decline in ridership in the1990 s, MET ridership seems to be leveling off. Middle school students still represent a major portion of the total fixed route ridership. Figure 25 MET Annual Ridership Trends Fixed Route Ridership 1,000, , , , , , , , , , / / / / / / / / / /93 Section 5 Page / / / / / / / / / / /04
96 Figure 26 - Met Bus Route Map - Weekdays Section 5 Page 2
97 MET ridership and other operating statistics are summarized in Table 15 and Figure 27. As shown, ridership has varied over time but has generally been leveling off during the past several years; farebox revenue has varied along with ridership. Table 15 Billings Transit Fixed Route Operating Statistics Fixed route 1991/ / / / / /97 Annual ridership 715, , , , , ,354 Total operating cost $1,491,856 $1,625,121 $1,671,160 $1,727,609 $1,860,330 $1,899,441 Farebox revenue $220,281 $207,838 $178,947 $175,681 $193,774 $221,712 Property tax revenue $930,079 $706,702 $645,929 $807,991 $982,833 $1,124,345 Federal grant revenue $397,079 $517,770 $684,092 $508,575 $443,806 $332,854 State grant revenue $43,546 $102,516 $93,075 $108,971 $136,158 $109,673 # of buses operated # of routes operated # of rev. hours operated 40,784 40,799 40,799 40,820 40,575 39,725 # of rev. miles operated 627, , , , , ,639 Aver. Passengers/mile Aver. Passengers/hour Aver. Cost/pass. trip $2.09 $2.40 $2.59 $2.58 $2.79 $2.70 Aver. Cost/mile $2.38 $2.57 $2.61 $2.66 $2.88 $3.00 Aver. Cost/hour $36.58 $39.83 $40.96 $42.32 $45.85 $47.81 Farebox recovery 14.77% 12.79% 10.71% 10.17% 10.42% 11.67% Fixed route 1997/ / / / / /03 Annual ridership 692, , , , , ,567 Total operating cost $1,833,140 $2,045,406 $2,105,496 $2,378,111 $2,585,259 $2,589,190 Farebox revenue $226,500 $246,304 $244,580 $228,138 $171,370 $184,197 Property tax revenue $1,172,090 $1,000,821 $1,111,254 $1,191,102 $1,601,011 $1,606,327 Federal grant revenue $332,854 $690,968 $763,692 $830,760 $879,622 $964,059 State grant revenue $135,668 $124,306 $121,029 $135,592 $110,712 $108,760 # of buses operated # of routes operated # of rev. hours operated 39,562 40,333 40,410 37,433 39,069 38,748 # of rev. miles operated 629, , , , , ,858 Aver. Passengers/mile Aver. Passengers/hour Aver. Cost/pass. trip $2.65 $2.99 $3.22 $3.86 $4.00 $3.98 Aver. Cost/mile $2.91 $3.19 $3.27 $3.94 $4.11 $4.12 Aver. Cost/hour $46.34 $50.71 $52.10 $63.53 $66.17 $66.82 Farebox recovery 12.36% 12.04% 11.62% 9.59% 6.63% 7.11% Source: MET Operating Statistics Section 5 Page 3
98 Figure 27 Billings MET Transit Fixed Route Ridership & Cost Trends 3,000,000 2,500,000 2,000,000 1,500,000 1,000, , / / / / / / / / / / / /03 Annual ridership Farebox revenue Total operating cost Primary funding comes from the local transit-designated 10-mill levy property tax approved by voters in 1980, supplemented by farebox and advertising revenue and by Federal Transit Administration (FTA) grants. The property tax supports about 62% of the total annual operating cost and the farebox revenue supports about 7% of the total operating cost. The MET operating statistics and performance measures are very typical of similar size operating systems around the country. MET s operating costs have increased by $1,100,000 or 74% between FY1991/92 and FY2002/03. The cost per passenger has increased by 91% during the same period; the cost per mile has increased by 73%; and the cost per hour has increased by 83%. MET is now facing these operating cost increases (primarily labor costs) and is limited in its ability to consider service changes or expansion. The monthly MET ridership varies as shown in Figure 28 and reflects the typical pattern of ridership declines during the summer months when other modes are available and children are not in school. Ridership during the other months of the year is fairly consistent. Figure 28 Billings MET Transit Seasonal Fixed Route Ridership Unlinked Passenger Trips 70,000 60,000 50,000 40,000 30,000 20,000 10,000 0 January 03 February March April May June July August September October November December Section 5 Page 4
99 The current route structure is very comprehensive throughout the City and provides bus service within 2-3 block walk for a very large proportion of the entire Billings population. The routes also serve a large number of employment and other activity centers. However, the primary MET patrons (77%) are transit-dependent, i.e., those persons who do not have an automobile or other means to make their trips. MET management is exploring ways of attracting choice riders, i.e., those persons who have an automobile or other choice of mode for their trip. Figure 29 illustrates the areas of the City where current riders live and use the bus for their trip to work, based on 2000 census data. The majority of people leave their homes for work between 7:30 and 8:00 AM, and that the average travel time to work is minutes. These statistics are important because they point out the fact that travel time in Billings is typically very short, which makes attracting choice riders to MET buses difficult. The statistics also point out that the majority of commuters are traveling to work in the same peak time period and contributing to traffic congestion levels. One program implemented by MET management in July 1996 to attract additional ridership is the Bike & Ride program. MET buses are equipped with bike racks to allow persons to ride their bicycle to a MET bus stop, board the bus and ride it to their destination, and then use their bicycle for the last leg of the trip, or to ride the bus to work and then ride their bike home. This program has been a huge success, even in winter months, with 520 bike-and-ride users in January of 2003 and 1,411 bike-and-ride users in July of Another successful MET fixed route program has been the accessible bus fleet which is now 100% accessible. The accessible fleet has allowed effective service to persons using wheelchairs and walkers at much lower cost than the specialized paratransit service discussed below. Fixed route ridership by wheelchair users has increased from 1,400 in 1992 to 3,475 in Also, one particular fixed route (Rt. 1M-MET-Link) provides close to the door service around the Medical Corridor and to downtown Billings. This includes hospitals, medical clinics, some shopping centers and senior housing centers, and provides connections at the downtown transfer center. This route operates on 30-minute headways from 8:40 AM to 3:45 PM Monday through Friday. The fare for fixed route passengers (including the MET-Link route) is $0.75 for the general public and $0.25 for elderly and disabled citizens. There are also discounted passes for unlimited monthly rides. Besides the fixed route service, the MET also operates the MET Special Transit (MST) service (a specialized, demand-responsive paratransit service). This MST service makes public transportation available for those persons whose disabling condition prevents the use of fixed route transit. This service is available as a means for agencies to contract for service for their clients. It also serves as the City s MET-PLUS day-before advance reservation service that provides full compliance with the Americans with Disabilities Act (ADA) requirements. Average MST ridership is about 64,000 rides per year at an annual cost of about $700,000. The fare for passengers is $1.50 per trip. Public transportation services are also provided by several private companies. Private for-profit public transportation providers operating in and through the Billings Urban Area include intercity bus lines, charter and rental bus services, and taxicab services. Greyhound Lines connects Billings with Forsyth, Miles City and Glendive to the east, and to Laurel, Livingston, Bozeman, Butte, Garrison, Missoula and Superior to the west. Powder River Trailways connects Billings to Cody, Lovell and Sheridan, Wyoming. Rimrock Trailways connects Billings to Bozeman, Section 5 Page 5
100 Helena, Butte, Great Falls, Missoula and Kalispell, as well as other smaller cities. The Trailways service also links Billings via Havre, Shelby and Whitefish with Amtrak service to St. Paul/Chicago and Seattle/Portland. Section 5 Page 6
101 Figure Work Trips by Bus Section 5 Page 7
102 Long Range Transit Improvements The roadway network obviously provides the backbone of the transportation system in the Billings Urban Area. However, the City residents are fortunate to also have alternative travel modes available in terms of a sound transit system, bikeways and pedestrian facilities, and opportunities for other modes besides the single-occupant automobile. As previously indicated, the City-operated Metropolitan Transit System (MET) consists of 18 fixed routes operating Monday through Friday and 9 routes operating on Saturday throughout the City of Billings. The route coverage is excellent, with roughly 80% of the population within an industry-standard ¼-mile walk of a bus route. The buses operate on 30-minute or 60-minute headways and provide about 650,000 passenger trips per year. MET also operates paratransit service for citizens who cannot use the fixed route public transportation service due to their disabling conditions. The paratransit service provides about 64,000 passenger trips per year. Fixed route ridership peaked in 1989/90 with 859,760 riders and has leveled off at about 650,000 riders. Fixed route ridership is expected to remain stable while demand for paratransit is envisioned to grow, especially as the baby boomer population cohort continues to age. The MET transit ridership is equivalent to approximately 2,800 trips per day or about 0.25% of the nearly one million total daily trips being made each day in the Billings Urban Area and about 1% of the daily work trips. The City can anticipate the likely continuation of transit ridership trends experienced in the past. The predominant mode of travel in the Billings Urban Area is clearly the automobile. The primary users of the transit system are the transit dependent, i.e., those without access to automobiles. The MET system is serving that population very well and is achieving performance standards that are comparable to other communities of similar size. The MET transit services are excellent, however it is important for MET to continue to monitor changing demographics and adjust services to meet demand as funding is available. MET should also continue to focus on attracting choice riders, or those who have a choice of travel modes without compromising service to the transit dependent population. In order to attract choice riders, transit service must be competitive with the automobile or in other words the service must be convenient, frequent, comfortable, reliable, and direct. Advanced Public Transportation Systems (APTS) can help with these objectives and should be considered over the long term especially as they become increasingly affordable. APTS technologies are numerous and include Automatic Passenger Counters, Advanced Traveler Information Systems, Automatic Vehicle Location, Electronic Fare Payment, In-Vehicle Information Systems, Traffic Signal Priority, etc. Another way to attract choice riders is to implement Bus Rapid Transit (BRT) on one or more routes. Bus Rapid Transit attempts to make bus systems operate more similarly to rail with a combination of: frequent service; on-line stations; fixed guideways and/or routes; increased speed; reliable service; and attractive vehicle, guideway, and station design. BRT uses rubbertired vehicles that can range from the diesel powered buses to alternative fueled vehicles. To implement BRT, potential funding strategies should be considered and are discussed below. The long range role of transit in Billings could become more important over time as concerns about air quality and quality of life in the community are raised. Having an excellent system to build on will be very important. The key issue then will be the re-distribution of available funding from other uses to increase the support required for an expanded transit system. Section 5 Page 8
103 Over the past several years, representatives of the Lockwood neighborhood, outside the City limits, indicated interest in having bus service between Lockwood and the rest of the Billings Urban Area. The travel demands between Lockwood and the other Billings neighborhoods are substantial and expected to increase in the future based on growth projections. Some of that demand could be captured by transit service, thereby reducing the number of vehicle trips. However, MET service currently is provided only within the City limits (which excludes Lockwood) since City residents support transit service with a city-wide 10 mill property tax levy (in which those outside the City limits do not participate). The City could contract with Lockwood to provide transit service based on a cost per bus hour of service. That cost would include all operating costs as well as funding requirements for capital costs such as additional buses and additional bus storage. Lockwood residents would have to determine whether the cost of service would be appropriate for the amount of benefit expected in terms of anticipated ridership and use of the service, and determine a funding mechanism to pay MET to provide the service. Another possibility would be an intergovernmental agreement between the City and Yellowstone County to allow expansion of bus service beyond the City limits when justified, with funding support from the County. As new development occurs, MET, if requested, would evaluate the potential benefits and costs associated with new service to the area, make a recommendation. Then, with concurrence of the City Council and the County, MET could provide service. A third possible funding mechanism that is closely tied to the intergovernmental agreement is the regional transit district or authority. This type of district would include an area beyond the City limits and have a dedicated funding source such as sales or property tax. A fourth possible funding mechanism for transit service in new areas outside of the City limits would be a dedicated service impact fee. Under this mechanism, the total cost of providing the new service would be calculated and then a fee would be assessed the developer of the new area for a 3-5 year period of operation. Alternatively, the service fee would be assessed each homeowner on an annual basis. Two issues associated with expansion that should be addressed are the purchase of buses and possible expansion of the MET operations and maintenance facility. MET currently schedules periodic replacement of aging buses and those costs are included in the 5-year financial projections. If additional transit service is extended into new, developing areas of the City or the urban area, additional buses will be required. In addition, if more buses are added to the fleet, MET will likely have to expand the operations and maintenance facility to provide sufficient capacity for bus storage and maintenance. Another issue related to possible fixed route system expansion is the federal Americans with Disabilities (ADA) requirement that comparable, accessible paratransit services be provided in the same service area as the fixed route service (i.e., within ¾-mile of any fixed route). Since the cost to provide such individualized paratransit rides is relatively high, this ADA requirement would significantly increase the total cost of providing additional services and should be considered carefully when expanded fixed route services are requested since it puts an increased burden on already limited resources. Even without expansion of the fixed route service, this ADA requirement presents a cyclical dilemma that needs to be considered. As noted before, there is likely to be increased demand for paratransit rides from the growing population of older adults (with their accompanying Section 5 Page 9
104 disabling conditions). In the absence of any increased funding availability, the increased cost for this paratransit service is likely to result in a reduction in fixed route service. However, a likely result is that, even if this fixed route service reduction is well-planned, some of the elderly and disabled citizens who had been able to use fixed route service would find themselves unable to use the reduced fixed route service since it would likely require a longer walk to catch the bus. This in turn would lead to even greater demand for the more costly paratransit service and continuation of this increasingly expensive cycle. Preservation of both the fixed route and paratransit service may well require increased funding. Examination of additional funding sources will be needed to preserve even the current service levels beyond Newly annexed areas should also be reviewed when considering long-term service changes. Demand for transit, available funding, and service structure, if any, will need to be analyzed. One recently annexed area is Briarwood. As Briarwood continues to grow, one option for servicing this area, if demand and resources are sufficient, is dial-a-ride service. With a dial-aride service, a bus would park near the Briarwood entrance during peak hours. The bus would depart at a set time. Passengers can walk down to the bus stop or pay an additional fee and have the bus travel to the person s home. This is sometimes referred to as flex-routing or route deviation. This is similar to the East End Dial-a-ride service in Aspen, Colorado. This service concept is designed for less dense areas and should be considered for Briarwood or other annexed areas. MET should also continue to take an active role in the review of new developments when requested by the Planning Division. Creating a community that can better utilize transit will improve the quality of life in Billings as well as make implementing transit services easier. The transit-oriented nature of developments should be part of this review as well as the impact of the development on the transit system. In summary, the MET transit system provides valuable service and enhances the level of personal mobility in Billings. The service should be continued and expanded where there is demonstrated demand and where it can be funded. MET transit staff should continue to develop strategies, alternatives and possible recommendations for improvements in transit services throughout the community. Short Range Transit Improvements MET should continue its promotional efforts to encourage new riders, particularly those who have a choice of travel modes. MET should also continue its periodic refinement of routes and schedules to optimize performance and attractiveness of the system. MET should plan for an automated fare collection system for improved safety, passenger convenience, and improved reporting. MET should pursue alternative fuel buses weighing both the long term cost/savings and environmental benefits. Additionally, MET should continue to proceed in the construction of a downtown transfer facility and continue to plan and coordinate with the medical community for a medical transportation facility. Finally, MET should continue careful tracking and controlling of costs to provide cost effective service. Since the transit system operates as a timed-transfer system, maintaining 30-minute running times is important. With increasing traffic volumes, maintaining the current running times may become more difficult. One possible short range modification to the bus service that the City should consider would be to institute scheduled stops along the routes to help maintain Section 5 Page 10
105 schedules. Currently, passengers can hail the buses at any corner along the routes. Those multiple stops tend to take more time and threaten schedule maintenance, and create greater potential for accidents. Installation of bus stop signs at specific locations would involve a relatively small capital expense. Another alternative for maintaining running times would be implementation of traffic signal priority treatments at appropriate intersections as previously mentioned. Another short range recommendation would be to continue installation of additional bus benches and passenger shelters at high use locations as appropriate, as well as route/schedule information to facilitate use of the system and increase rider comfort. In order to promote the system to choice riders, i.e., those who have a choice of travel mode, MET should continue to offer and promote the discounted bus pass program through all of the large employers, particularly in the downtown area, similar to the bus pass program currently utilized by City employees. Employers could offer bus passes in lieu of parking spaces and realize approximately the same cost to the business. MET should also offer free transit days or weeks to get more residents to simply try the bus and discover that the service can serve some if not all of their travel needs and thereby reduce some of the automobile trips on the roadway network. The key is creating the habit of using the bus system on a regular basis. In conjunction with a carpool/vanpool system discussed below, MET might offer a guaranteed ride home for emergencies to those using the bus or ridesharing. This safety valve can reduce most people s fears of getting to work and not having access to their automobile in case of emergencies during the day. MET continually analyzes services and operations, capital and operating budgets, and available funding sources. Those analyses should continue to provide the link between the long and short-range elements of this 2005 Transportation Plan and the Billings Transportation Improvement Program (TIP). These analyses will also provide the detailed refinements in routing, scheduling and general operations of the transit system. Airport Facilities/Access Billings Logan International Airport serves as a regional hub for air traffic with non-stop service to Seattle, Denver, Minneapolis, Salt Lake City, Las Vegas, Portland, Cincinnati, Boise, Phoenix, and eight cities in Montana. The Federal Aviation Administration (FAA) classifies the Airport as a small hub with a local market area extending throughout central and eastern Montana and northern Wyoming. The Airport's importance to the region and the State has been growing with passenger enplanements reaching 412,000 in 2004, an 11% increase over The airlines currently serving Billings Logan International Airport are Northwest, Big Sky (regional service), United, Mesa, Sky West, Frontier, and Horizon. The Airport has also seen continuing growth in air cargo and mail operations, with a total of 35,058 tons passing through the Airport in Three large air cargo companies serve the Billings market (United Parcel Service, DHL, and Federal Express) as well as several smaller cargo feeder airlines. The Airport facilities consist of a 175,000 square foot Terminal Building, a 39,000 square foot Operations Center, and 6 acres of long and short term parking facilities. The airfield is comprised of three active runways; a 10,518 foot precision/instrument main carrier runway, a Section 5 Page 11
106 5,501 foot non-precision cross wind runway, a 3,800 foot general aviation runway. The runway/taxiway system is supported by 500,000 square feet of cargo ramp. The Airport is financially self-supporting and remains the only airport in Montana that does not use local tax revenues. The total local economic impact of the Airport, including direct and indirect impacts, is estimated at over $180 million per year. Obviously, the Airport is not only an important element of the Billings/Yellowstone County transportation system, but a significant economic force as well. The Airport complex, encompassing 2,300 acres of property owned and operated by the City, is located on a rimrock plateau approximately two miles north of the downtown area, with the primary access via North 27 Street. The intersection of North 27th Street, Highway 3, State Secondary Highway 318, and the entrance/exit of the Airport is located just south of the Airport. This is a four way intersection with three of the movements being controlled by stop signs. The northbound movement from North 27th Street is unrestricted due to steep approach grades; a configuration that has contributed to numerous vehicular accidents and traffic congestion during periods of peak traffic. Over the years, various studies have looked at the impacts of this intersection on access to and from the Airport and the flow of east/west traffic on the highway system. In 1999, Federal Highway funds were appropriated and secured to improve Airport Road. In 2001, the City of Billings, Montana Department of Transportation, and HKM Engineering began the design/development of the Airport Road Improvement Project that includes a new intersection at the Airport and N. 27 th Street. In 2004, designs for this intersection were taken forward to the public. These design options will be reviewed and a preferred alternative will be selected in Construction of this project is anticipated in the spring of Section 5 Page 12
107 Freight Movement Services & Facilities Billings/Yellowstone County is a significant hub for freight movement to/from throughout the region. Figure 30 shows the railroad tracks and major highway (truck) routes in the region and in the Billings Urban Area, as well as the locations of the intermodal facility and two rail yards in the downtown area. Billings has two freight movement hubs. One is the Central Business District core from North 30th Street to North 9th Street. The other is in the southern part of the City, bounded by Industrial Avenue, Plainview, the railroad tracks, and Edwards. The biggest issues in these areas are the loading/unloading zones, geometric design of streets and intersections to accommodate the large turning radii required for trucks, physical site design, site distance, and truck routes providing access to the sites. The Burlington Northern/Santa Fe Railroad and Montana Rail Link operate in Billings and Yellowstone County, as well as in much of the rest of the State of Montana. Figure 30 shows the numerous rail connections that occur in or close to Billings, as well as the location of the BNSF-operated intermodal facility and rail yard just east of downtown Billings. The Burlington Northern/Santa Fe Railroad operates the largest portion (65%) of the statewide rail system, followed by Montana Rail Link with 25% as shown in Table 16 below. Table 16 Montana Railroad Trackage Operated in 1996 Railroad Company Montana Route Miles Owned, Leased & Operated % of Total State Route Miles Operated Burlington Northern/Santa Fe (BNSF)* 2, % Central Montana Rail Dakota, Missouri Valley & Western Montana Rail Link (MRL)* Montana Western Rarus Union Pacific Total Miles 3, % Sources: Railroad Annual Reports to the Montana Public Service Commission, 1996; Montana Rail Plan Amendment * Operating in Billings Due to Montana s geographic location, the major railroads that serve the state are oriented toward transcontinental east-west flows. Consequently, the rail system handles large volumes of through traffic that neither originates nor terminates within the state, but simply passes through the state. Nevertheless, significant volumes of rail traffic also originate in the state, particularly coal and coal products, petroleum, farm products, lumber and wood products, and stone, clay, glass and concrete products. Of the nearly 53 million tons shipped by rail in 1996, about 90% was shipped out-of-state and 10% was shipped into the state. The two railroad companies operating in the Billings area, BNSF and MRL, move large volumes of coal and freight through the area and serve the downtown Billings intermodal facility which has had increased usage in recent years. A total of 27 million tons of coal and freight was moved by rail through Billings in A total of 1,536,000 tons of freight and coal was moved by rail in 1996 between Billings and Seattle, specifically. Montana Rail Link handles more than Section 5 Page 13
108 20,000 carloads of freight per month. It is clear from discussions with the railroads operating in the Billings area, that existing rail facilities are adequate and have sufficient capacity to accommodate current and anticipated freight movement demand. One issue raised during the development of this plan is the need for one or more grade separations between downtown streets and the railroad tracks that traverse the area. In September 2003 the City of Billings contracted with Short Elliot Hendrickson (S.E.H.) to evaluate alternatives to the existing at-grade railroad crossings in Downtown Billings. The study is now complete and available for review. The current delays experienced at the existing grade crossings are due to an average of 20 through freight trains and 10 switch trains per day at the 27 th street crossing. This delay results in cars queuing for 2-3 blocks on either side of the tracks. More than 75% of Montana commodities are moved by truck. The busiest truck route in the State is I-90 west of Billings; that route carries on average more than 1,000 commercial vehicles per day. Other busy truck routes in the Billings Urban Area are I-94, MT 3 and US 87. There are no designated truck routes within the City, and truck traffic is specifically banned from using 27 th Street through the downtown area. Local deliveries are made using the entire arterial and collector street system, so the truck traffic is dispersed. Considering public input from various neighborhood groups, the clear preference is to continue the current truck travel patterns in a dispersed manner, rather than to concentrate truck traffic on a small number of designated facilities. The obvious interest is to avoid negative impacts to neighborhoods such as noise, congestion, safety problems and pavement deterioration. The large amount of truck traffic to/from industries in the Lockwood area will continue to utilize the existing roadway network as well as new connections to major state highway truck routes identified in this plan. However, no additional facilities will be designated as truck routes. Another consideration for truck freight movement is the Camino Real north-south trade route connecting Canada, the US and Mexico via I-25, I-90 and I-15 (also included are I-10, MT 3, US 12, US 191, and US 87). Most all segments of this key NAFTA trade route and transportation corridor are interstate and have at least 4-lanes, but travel by interstate highway requires considerable out-of-direction travel to reach I-15 north from Great Falls. US 87 and MT 3 present a much more direct route for the Billings-to-Great Falls segment, and this route is heavily used by trucks. Section 5 Page 14
109 Figure 30 - Railroad Tracks and Major Highway (truck) Routes Section 5 Page 15
110 Section 6. Pedestrian & Bicycle Element Pedestrian and bicycle facilities represent additional non-motorized modes of travel that offer alternatives to the single occupant automobile. This element of the 2005 Transportation Plan focuses on these two modes and the recommended improvements. Pedestrian Facilities The City-wide sidewalk policy is the mechanism used to establish a City-wide system of sidewalks. Prior to the establishment of the 4-1/2 mile planning jurisdiction, the County and City had varying standards in the urban area. As a result, there are several areas of town without sidewalks. Joint standards have still not been established. Until 1995, the sidewalk policy was well defined, requiring all development in the City to construct walks on both sides of all streets. The policy is currently undergoing reconsideration by City Council. The sidewalk policy, in combination with the Yellowstone River Greenway Master Plan (trails), Heritage Trail and School Sidewalk Program comprise the extent of comprehensive planning for pedestrians. City Engineering has identified four areas of the City Sidewalk Program that need to be addressed by City Council. These areas include 1) repair and maintenance program, 2) new or missing improvements, 3) school routes, and 4) developer-related improvements. Current Policies The annual sidewalk repair program is established from public complaints, staff recommendations and property owner requests. Existing criteria for curb, gutter, and sidewalk repair are used as the baseline, followed by input from individual property owners. Currently, costs of repairs are assessed to the property with some subsidies available. Criteria to construct missing improvements are based on neighborhood requests, staff recommendations, coordination with other projects and are often governed by existing subdivision improvements agreements, with many areas covered by waivers and other public interest. Based on a 1995 City Council policy, the sidewalk requirements are subject to review. Costs for construction of new improvements are borne by the property owner with some subsidies available. A 1992 School Sidewalk Study prioritized sidewalk construction along school routes. The implementation policy outlined in this plan establishes priorities based on the route and scope of work needed, although projects of lower priority may be reassessed by City Council. Developers are typically required to construct missing improvements, however this requirement may be waived or a variance granted according to City policies and procedures. If the City constructs the improvement, the property owner is typically assessed the costs. Recent Council Action The Billings City Council has taken action to address the existing sidewalk policies. They have recently determined that there should be no change to the development/building permit policy. With regard to the School Sidewalk Program; Community Transportation Enhancement Program (CTEP) funds will be used to construct sidewalks along arterial and collector streets and priority school walking routes. Other walking routes not on collector or arterial streets will Section 6 Page 1
111 be constructed if requested through a neighborhood petition. The installation of other new sidewalks and maintenance of existing facilities will continue in accordance with recent policy discussion. However, most areas where sidewalks do not currently exist will likely remain that way into the foreseeable future. Bicycle Facilities Over the last decade, non-motorized transportation has become an increasingly important component of progressive growing communities like Billings and Yellowstone County. Increased levels of bicycling and walking result in significant benefits in terms of health and physical fitness, the environment, and transportation-related effects. Bicycle and pedestrian facilities are also often an expression of community pride and character, and in many cases a means of preserving the natural and historical resources of a region. It is important for Billings and Yellowstone County to have an adopted plan for non-motorized forms of transportation in order to be eligible for federal funds, as well as to avoid missed opportunities for trail and bikeway development. Since the adoption of the Intermodal Surface Transportation Efficiency Act (ISTEA) in 1991, and subsequent transportation bills (TEA-21), the federal government has legitimized walking and bicycling as transportation modes through higher levels of funding than ever before. Federal policy requires that communities develop and adopt a non-motorized element of their overall community transportation plan in order to be eligible for this funding. As the Planning Board, City Council, County Commission, and other policy bodies consider new land developments or public infrastructure projects, this is often only one opportunity to choose a solution that enhances non-motorized transportation. BikeNet, the original non-motorized transportation plan for the City of Billings, was adopted in When this took place, Billings took a decisive first step toward achieving a community vision of a city where quality of life is paramount. This vision included implementing a system of trails and bikeways that would invite Billings citizens to get off their couches and out of their cars. It also included a set of recommendations that addressed policies, land use, education, enforcement and design. BikeNet was truly a pioneering document for the Billings community, educating us on the importance of trails and leaving a lasting legacy of interest groups and trails that have set the stage for future development of the entire network. Heritage Trail recognizes the work that was developed through the BikeNet Plan and builds on a community-based planning process that had public participation and input as its cornerstone. Heritage Trail builds on the foundation provided by BikeNet, and enhances it in a number of important ways. A New Identity was explored to strengthen the opportunity for the trail system to be not just a functional and recreational system, but also one that offers interpretive opportunities. As trail corridors were identified and evaluated, it became evident that there were numerous cultural and historical places and events that offered a look back to our rich Heritage that could be identified, accessed and interpreted. This idea grew into the driving force behind the new identity of the trails system Heritage Trail. Heritage Trail expands the concept of BikeNet to embrace a larger constituency of users. It embraces walkers and runners, in-line skaters and skateboarders, equestrians and others. As a plan for the Greater Billings Area, Heritage Trail includes specific policy recommendations that will move the community closer to achieving its vision of a cohesive system of linked trails and bikeways. More than just a way to get from A to B, Heritage Trail also includes an interpretive component that will become a community treasure. The Heritage Trail updates the facility Section 6 Page 2
112 classifications that were included in the BikeNet Plan to be consistent with accepted national standards. While Heritage Trail stands alone as a plan for trails and bikeways in the Billings area, by reference it is part of the 2003 Growth Policy and will serve as the non-motorized component of the Billings Urban Area 2005 Transportation Plan. Since there is limited funding, the Heritage Trail cannot be implemented in its entirety all at once. However, the plan has developed an innovative method for prioritizing potential projects based on objective data and calculations. For the City of Billings, two separate prioritization methods were developed, one for proposed primary on-street bikeways (Figure 31) and another for proposed multi-use trails (Figure 32). The goal was to produce a ranking methodology as an on-going tool to compare one potential project to another. The criteria used for prioritizing onstreet facilities were route continuity, non-motorized travel demand, bicycle compatibility index, and public opinion. The criteria that were used for prioritizing multi-use trails were safety, connectivity/accessibility, route continuity, aesthetics/recreational value, non-motorized travel demand and public opinion. Heritage Trail is a vision for Billings future, and this plan presents a strategy for implementing that vision over the next 10 to 20 years. It should serve as a guide for local governing bodies and City staff as they make decisions, set policy, and prioritize projects and their funding. Heritage Trail should be a living document that adapts and changes along with the needs of the community. The success of the Heritage Trail system is dependent on many different factors. Perhaps the most important factor is broad-based community support from both public and private interests all working together to achieve a common vision. Even with the support of the majority, however, a well-conceived plan backed by real policies and programs is required to ensure implementation. Summary of Heritage Trail Plan Recommendations The Heritage Trail addresses policy, programs and facilities. Policy Recommendations and Issues: Since the adoption of the BikeNet Plan, a part time Alternate Modes Coordinator has been hired to focus on bike/pedestrian issues. Subdivisions are now reviewed for compliance with the Heritage Trail and for preservation of future corridors. Various funding sources have been secured and used for the development of specific projects. The plan inventoried the existing non-motorized facilities including corridors, right of ways and easements that have been preserved for future development. However, there is still a need to adopt local government policies, processes and standards that encourage and enhance nonmotorized transportation. Public involvement also needs to be a strong component in the planning and implementation of the Heritage Trail. 1. The plan recommends revising and updating local subdivision and site development policy to include incentive-based criteria for trail and bikeway development. 2. Institutionalize funding for construction and maintenance of trails and bikeways. To date, the majority of the funding for trails has been realized through CTEP. The Billing s community has also been fortunate to receive funds through TCSP, CMAQ, RTP, LWCF and several private grants. Most of these sources require a local match that has been provided for specific projects from the 1999 GO Bond. However, to ensure continued development of trails and bikeways, funding should be institutionalized, as is funding of public streets and utilities. Section 6 Page 3
113 3. The plan recommends developing and adopting a comprehensive set of local guidelines and standards for design, construction and maintenance of trails and bikeways. A design standards guideline has been established in 2004 for the Billings Public Works Department. 4. The plan recommends requiring that all site development projects and subdivision plats, as well as all public infrastructure and utility projects be reviewed by the City and County, where appropriate, for compliance with the Heritage Trail Plan. Cooperation should be encouraged between local governments and departments to plan and implement multiple-use and multiple benefit projects. Subdivisions are now being reviewed as part of the planning process and with the extension of sewer services to the Briarwood area, there is an effort to develop the trail in conjunction with the sewer line. 5. Encourage enforcement of existing parking and traffic laws and develop public and private bicycle parking facilities. 6. The plan recommends adopting revised roadway design standards to accommodate and encourage shared use of rights-of-ways by bicycles, pedestrians and motorized vehicles. 7. The plan encourages the development of trails in multi-use corridors, including particularly ditches, canals, utility rights-of-ways and railroads. To date, most of the ditch companies and the railroad have been reluctant to share their corridors with trails because of liability fears even though a recreational act was passed in Montana in the 90 s to help relinquish those concerns. 8. Monitor state and national policy, programs, and plans to take advantage of new opportunities and to insure that local programs are not adversely impacted. 9. The plan recommends creating a task force to oversee implementation of interpretive elements of the Heritage Trail. Trail construction has been the primary goal and unfortunately with limited funding, interpretive elements have not been able to be pursued. Program Recommendation: An important component to the long term success of the Heritage Trail is a comprehensive array of education and promotional programs. This includes partnering with community organizations and other agencies to sponsor programs that promote and encourage the use of non-motorized transportation. Some opportunities that have been realized are safety programs, health and wellness benefits, fundraising and awareness for the trails through BikeNet and the Ales for Trails event and the MET transit bike racks. Limited resources have impeded progress on implementing programs. Facility Recommendation: The Heritage Trail focuses on making the existing and future transportation system bicycle/pedestrian friendly by improving non-motorized transportation facilities through planning, design and improvement projects. Implementation of this goal requires public involvement and focuses on incorporating bikeways into the on-road system and providing trails and corridors for the off-road system. Both systems should be an integral part of the total transportation plan. Section 6 Page 4

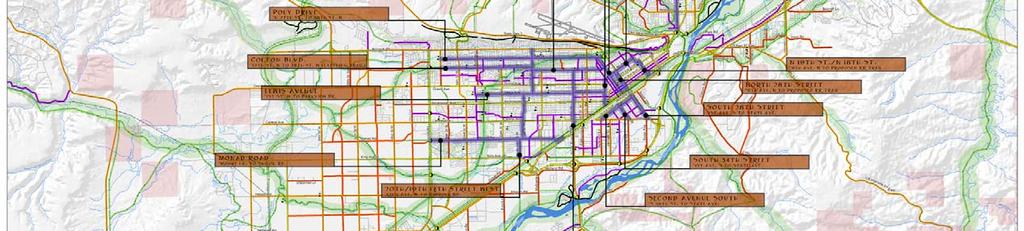
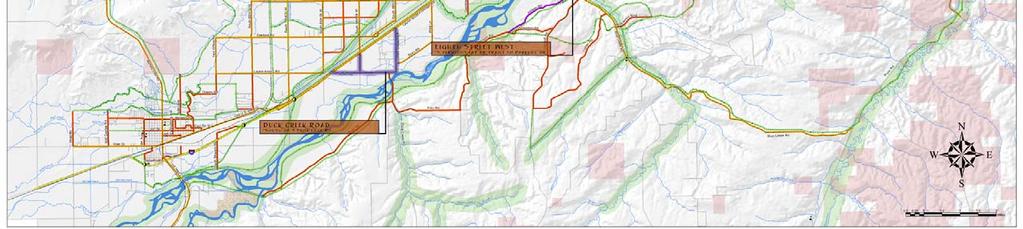
114 Figure 31 - On-street Non-Motorized Transportation Routes Section 6 Page 5

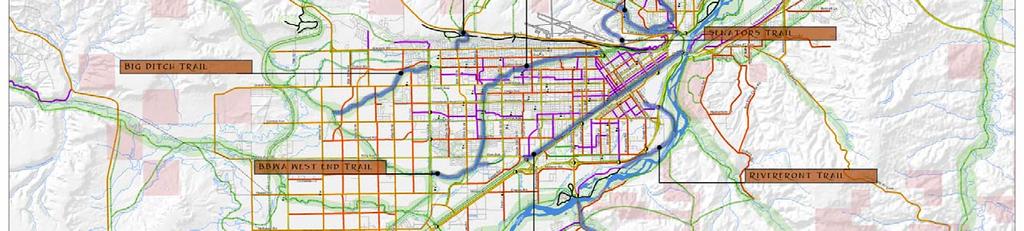
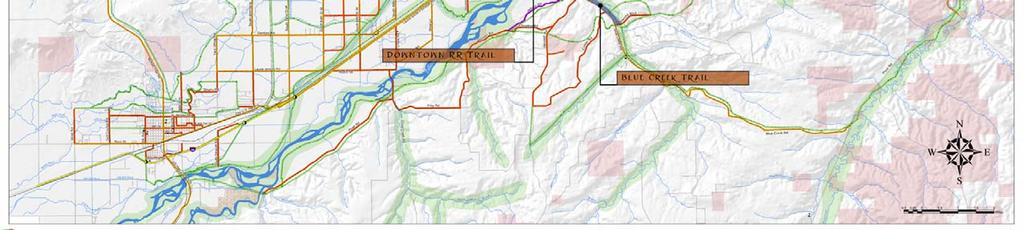
115 Figure 32 - Off-street Non-Motorized Transportation Routes Section 6 Page 6