Investor Presentation October NASDAQ:FWRD
|
|
|
- Caitlin Ramsey
- 5 years ago
- Views:
Transcription

1 Investor Presentation October 2018 NASDAQ:FWRD
2 Forward Looking Statements Disclosure Today s presentation and discussion will contain forward-looking statements within the meaning of the Private Securities Litigation Reform Act of Words such as expects, anticipates, intends, estimates, or similar expressions are intended to identify these forward-looking statements. These statements, which include statements regarding our competitive advantages, synergies, and scalable platform, and future technology investments are based on Forward Air s current plans and expectations and involve risks and uncertainties that could cause future activities and results of operations to be materially different from those set forth in the forward-looking statements. For further information, please refer to Forward Air s reports and filings with the Securities and Exchange Commission. To supplement the financial measures prepared in accordance with generally accepted accounting principles in the United States ( GAAP ), we have included the following non-gaap financial information in this presentation: adjusted revenue, EBITDA, adjusted EBITDA, adjusted EBITDA margin, adjusted operating income, adjusted operating margin, adjusted income taxes, adjusted net income and adjusted EPS. The reconciliations of these non-gaap measures to the most directly comparable financial measures calculated and presented in accordance with GAAP can be found in the Appendix to this presentation. Because these non- GAAP financial measures exclude certain items as described herein, they may not be indicative of the results that the Company expects to recognize for future periods. As a result, these non- GAAP financial measures should be considered in addition to, and not a substitute for, financial information prepared in accordance with GAAP. 2
3 Asset-Light Freight & Logistics Company EXPEDITED LTL Comprehensive national network Provides expedited regional, inter-regional and national LTL services Offers local pick-up and delivery, warehousing and other services Growing e-commerce, 3PL, D2D and final mile solutions TRUCKLOAD PREMIUM SERVICES Expedited Truckload brokerage Dedicated fleet services Maximum security and temperaturecontrolled logistics services Long-haul, regional and local services INTERMODAL High value intermodal container drayage Warehousing and other value-added services Regional linehaul Growing footprint from M&A and greenfield startups POOL DISTRIBUTION Customized consolidation, final-mile handling and distribution of time-sensitive products DC bypass, flow through, direct-to-store and reverse logistics services Expanding beyond retail into new verticals 3
4 Key Attributes Deliver premium solutions: expedited, time-definite, service-sensitive Most comprehensive provider of wholesale transportation services in North America, serving Freight Forwarders, Airlines, 3PLs, etc. Operate an asset-light model utilizing independent owner-operators and third-party carriers Provide our customers with safe, superior service Expanding into new areas organically and through acquisitions Leading technology lowers operating cost and improves customer service Superior service and operating flexibility regardless of economic cycle 4
5 $ millions (non-gaap) Revenue Growth 1,200 Consolidated Revenue 1, * Note: Historic revenue shown as non-gaap since it does not reflect the implementation of ASC 606, Revenue from Contracts with Customers * Non-GAAP adjustment, see appendix 12% annual revenue growth since 2010 Organic as well as acquisitive growth Expanded existing services and introduced new offerings (e.g., Intermodal) 5
6 $ millions (non-gaap) Operating Income Growth Consolidated Operating Income * 2016* 2017 Note: Historic operating income shown as non-gaap since it does not reflect the implementation of ASC 606, Revenue from Contracts with Customers * Non-GAAP adjustment, see appendix 11% annual operating income growth since 2010 Organic as well as acquisitive growth Expedited LTL key contributor; Intermodal growing rapidly 6
7 Addressable Market $ millions (non-gaap) Business Unit LTM Revenue TAM TAM Comments Expedited LTL 723 3,500 $1,500 traditional airport-to-airport + $2,000 3PL Truckload Premium Services 189 3,000 $1,500 expedited + $1,500 medical+refrigerated Intermodal 191 7,000 Midwest + SE region Pool Distribution 184 4,000 $1,500 retail + $2,500 other verticals Intercompany Eliminations (17) Total 1,270 17,500 7% of estimated total addressable market Note: Historic revenue shown as non-gaap since it does not reflect the full implementation of ASC 606, Revenue from Contracts with Customers Source: Studies performed by Tompkins International and SJ Consulting Currently serve 7% of total addressable market (TAM) Significant opportunity for future growth 7
8 Management Team Tom Schmitt President and CEO Glenn Adelaar SVP, Information Systems Matt Casey SVP, Safety Roger Gellis SVP, Pool Distribution Michael Hance Chief Legal Officer Matthew Jewell President, Logistics Services Kyle Mitchin SVP, Human Resources Mike Morris CFO & Treasurer Chris Ruble President, Expedited Services As of September 1, 2018 Previous: Schenker AG, Purolator, FedEx 18 years with Forward Air Previous: Sabre, American Airlines 1 year with Forward Air Previous: Forest City Technologies, Panther Premium Logistics 11 years with Forward Air Previous: Velocity Express, FedEx 12 years with Forward Air Previous: Baker, Donelson, Bearman, Caldwell & Berkowitz PLC 18 years with Forward Air Previous: Austin & Sparks, PC 4 years with Forward Air Previous: Panther Premium Logistics 2 years with Forward Air Previous: XPO/Con-way 22 years with Forward Air Previous: FedEx 8
9 Revenue & Operating Income Mix Revenue: LTM Operating Income: LTM Pool 14% TLS 15% IM 15% LTL 56% Pool 5% TLS 2% IM 16% LTL 77% Note: Historic revenue shown as non-gaap since it does not reflect the full implementation of ASC 606, Revenue from Contracts with Customers 10
 Growth Areas E-commerce solutions for freight intermediaries (forwarders, airlines, etc.")
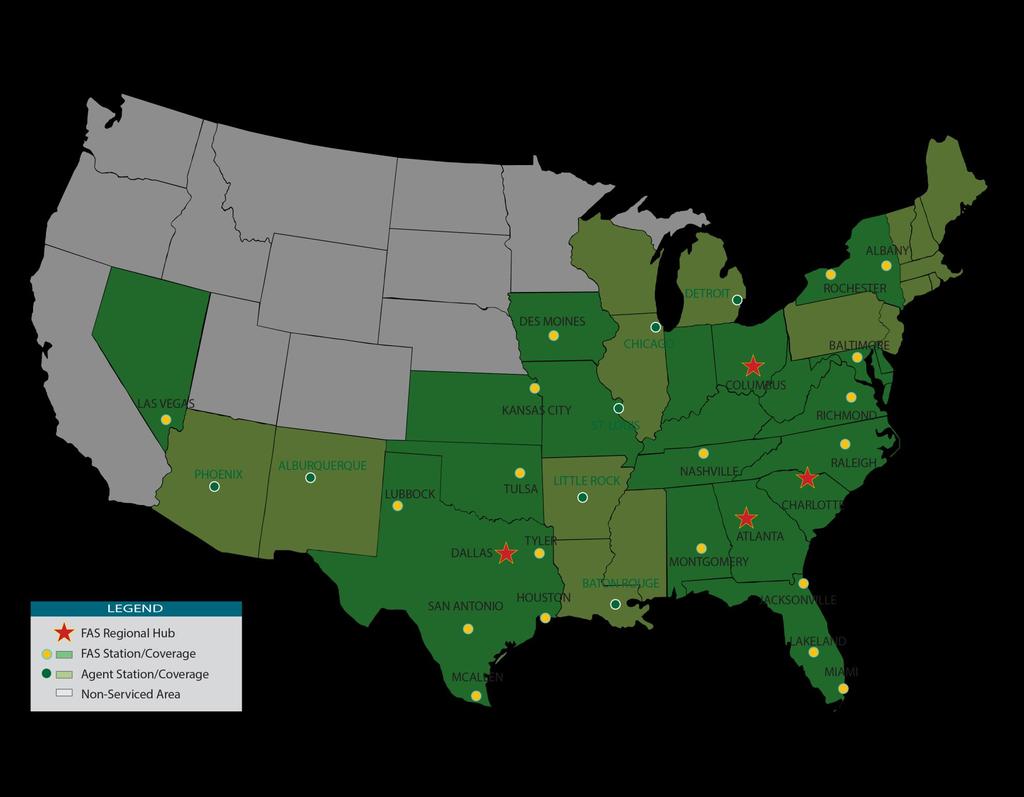
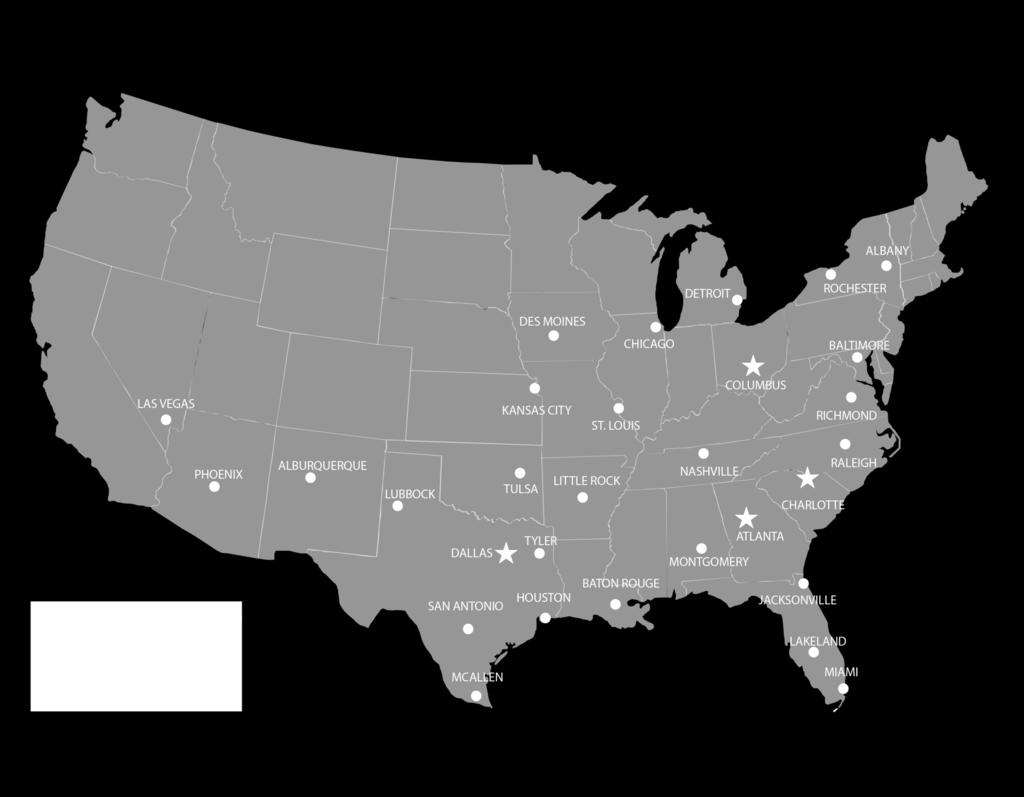
10 Expedited LTL Highlights Nationwide time-definite service Pick-up and delivery covering 96% of continental US zip codes Offer variety of freight management services (warehousing, dedicated finalmile, consolidation/deconsolidation, etc.) Growth Areas E-commerce solutions for freight intermediaries (forwarders, airlines, etc.) Expanding into 3PL market to supplement network density Door-to-door offerings for B2B and B2C solutions Heavy goods, white-glove final-mile service Expedited LTL Revenue Operating Income EBITDA Lbs per Day Shipments per Day Lbs per Shipment LTM $ 723 M $ 95 M $ 117 M 10.2 M 16.6 K 617 Lbs Note: Historic revenue shown as non-gaap since it does not reflect the full implementation of ASC 606, Revenue from Contracts with Customers 10

11 Expedited LTL Network 11
 for premium rates Dedicated owner-operator capacity drives competitive advantage Flexible capacity from qualified third party transportation providers Beneficial synergies through crossutilization")
12 Truckload Premium Services Highlights Premium services (expedited, timedefinite, high value, etc.) for premium rates Dedicated owner-operator capacity drives competitive advantage Flexible capacity from qualified third party transportation providers Beneficial synergies through crossutilization with Expedited LTL fleet Growth Areas Expedited linehaul for LTL carriers, airlines, forwarders, etc. Refrigerated and temperature-controlled logistics solutions for pharmaceutical and life-science companies Customized solutions for retail companies Truckload Premium Services LTM Revenue $ 189 M Operating Income $ 3 M EBITDA $ 9 M Total Miles 84.1 M Qualified 3rd Party Carriers 4,793 Tractors (avg) 325 Miles Per Tractor Per Week 2.4 K Note: Historic revenue shown as non-gaap since it does not reflect the full implementation of ASC 606, Revenue from Contracts with Customers 12

13 Intermodal Highlights Premium intermodal drayage for forwarders, airlines and steamship lines Branded as CST (Central States Trucking) Growing Midwest, Southeast and Southwest footprint Service partnerships with 20 of the top 100 importers Offer dedicated contract and CFS warehouse services Growth Areas M&A pipeline provides clear line of sight to revenue growth and footprint expansion Greenfield startups where right M&A candidate is not available Intermodal LTM Revenue $ 191 M Operating Income $ 20 M EBITDA $ 26 M Drayage Shipments 297 K Drayage Revenue Per Shipment $ 559 Note: Historic revenue shown as non-gaap since it does not reflect the full implementation of ASC 606, Revenue from Contracts with Customers 13

14 Intermodal Network 14

15 Pool Distribution Highlights High-frequency handling and distribution of time-sensitive products to multiple destinations for multiple consignees ( pooled final-mile solution) Branded as Forward Air Solutions Mid-Atlantic, Midwest, Southeast and Southwest footprint Leverages core competencies of Expedited LTL business Growth Areas Expansion into vendor pickup and consolidation within current retail vertical Applications in new verticals, such as healthcare, hospitality and parts distribution Pool Distribution LTM Revenue $ 184 M Operating Income $ 6 M EBITDA $ 13 M Cartons 88.7 M Revenue Per Carton $ 2.07 Note: Historic revenue shown as non-gaap since it does not reflect the full implementation of ASC 606, Revenue from Contracts with Customers 15
16 Pool Distribution Network 16
17 Technology Advanced technology is a cornerstone of every Forward Air business operation Our technology priorities include: Extensive use of mobile and wireless technologies to drive operational efficiencies Real-time customer shipment visibility E-commerce links with our customers, drivers, trading and service partners via APIs and EDI Data analytics to enhance pricing and profitability analysis Web portals and messaging tools for owner-operators Forward Air is committed to making long-term, on-going investments in technology to provide high level service and security 17
18 Financial Overview
19 Financial Overview Goal to deliver superior returns to shareholders through profitable organic growth and disciplined acquisitions Commitment to return capital to shareholders through dividends and share repurchases LTM Revenue (Reported) $ 1,270 M $ 1,101 M $ 983 M Adjusted Operating Income $ 116 M $ 109 M $ 102 M Adjusted Operating Margin 9.1% 9.9% 10.4% Adjusted EPS $ 3.36 ** $ 2.89 ** $ 2.08* Adjusted EBITDA $ 158 M $ 150 M $ 141 M Adjusted EBITDA Margin 12.4% 13.6% 14.3% ROIC (w/o Goodwill & Intang.) 29.7% 28.1% 29.1% ROIC (w/goodwill & Intang.) 15.2% 14.4% 14.5% Capital to Shareholders $ 70 M $ 67 M $ 56 M Debt / Adjusted EBITDA 0.3 x 0.3 x 0.2 x * * * * Shown as non-gaap since it does not reflect the full implementation of ASC 606, Revenue from Contracts with Customers ROIC is calculated as Non Operating Profit After Tax (adjusted for the amortization of intangibles) divided by Operating Invested Capital; assumes comparable 25% tax rate for all periods * Non-GAAP adjustment, see appendix ** LTM and 2017 EPS of $3.36 and $2.89 includes a positive $0.53 impact from Tax Cut and Jobs Act 19
 (CAGR = 11%) EPS (non-gaap) (CAGR = 15%) * * * + * * ++ ++")

 ++ LTM and 2017 EPS of $3.36 and $2.89 includes a positive $0.")
20 Revenue & Earnings History Revenue (non-gaap) (CAGR = 12%) EBITDA (non-gaap) (CAGR = 11%) EPS (non-gaap) (CAGR = 15%) * * * + * * Shown as non-gaap since it does not reflect the full implementation of ASC 606, Revenue from Contracts with Customers * Non-GAAP adjustment, see appendix + Adjusted to exclude CST acquisition costs ($0.02) ++ LTM and 2017 EPS of $3.36 and $2.89 includes a positive $0.53 impact from Tax Cut and Jobs Actcc 20
21 ($ in millions) Strong Cash Flow Generation $160 $140 $120 $130 $139 $100 $103 $80 $60 $77 $69 $91 $92 $86 $40 $20 $0 $54 $52 $38 $39 $40 $33 $36 $20 $20 $ LTM Net Capex Cash Flow From Operations 21
22 Value Proposition Sustainable Revenue Growth Flexible Asset-Light Model Solid Capital Returns Proven Operating Leverage Strong Balance Sheet 22
23 Appendix
24 Reconciliations GAAP vs Non-GAAP Reconciliation ($ in millions, shares in 000s) GAAP Revenue Reconciliation LTM GAAP Revenue (Reported) 1, , Towne Integration Adjusted Revenue 1, , GAAP Financials (Reported) LTM Operating Income Operating Margin 9.1% 9.9% 6.1% 8.5% 12.3% 12.9% 14.3% 14.4% 11.1% Net Interest & Other Expense (1.8) (1.2) (1.6) (2.1) (0.3) (0.4) (0.3) (0.5) (0.6) Income Taxes Net Income (Loss) Fully Diluted Share Count 29,371 29,964 30,444 31,040 31,072 30,762 29,536 29,435 29,111 Income Allocated to Participating Securities (0.9) (0.7) (0.5) (0.4) (0.4) Fully Diluted EPS Non GAAP Adjustments LTM Towne Integration (24.3) TQI Impairment - - (42.4) Operating Income - - (42.4) (24.3) Net Interest & Other Expense (0.4) Income Taxes - - (6.4) (15.7) Net Income (Loss) - - (36.0) (9.0) Fully Diluted Share Count 29,371 29,964 30,444 31,040 31,072 30,762 29,536 29,435 29,111 Fully Diluted EPS - - (1.18) (0.29) Segment EBITDA Reconciliation Expedited LTL LTM GAAP Operating Income 94.6 (+) Depreciation & Amortization 22.3 = EBITDA Truckload Premium Services LTM GAAP Operating Income 2.9 (+) Depreciation & Amortization 6.5 = EBITDA 9.4 Intermodal LTM GAAP Operating Income 19.8 (+) Depreciation & Amortization 6.2 = EBITDA 26.0 Pool Distribution LTM GAAP Operating Income 6.4 (+) Depreciation & Amortization 6.9 = EBITDA 13.3 Non GAAP Financials LTM Adjusted Operating Income Adjusted Operating Margin 9.1% 9.9% 10.4% 11.1% 12.3% 12.9% 14.3% 14.4% 11.1% Net Interest & Other Expense (1.8) (1.2) (1.6) (1.7) (0.3) (0.4) (0.3) (0.5) (0.6) Adjusted Income Taxes Adjusted Net Income (Loss) Fully Diluted Share Count 29,371 29,964 30,444 31,040 31,072 30,762 29,536 29,435 29,111 Income Allocated to Participating Securities (0.9) (0.7) (0.5) (0.4) (0.4) Adjusted EPS Adjusted Operating Income Depreciation & Amortization (Reported) Adjusted EBITDA Adjusted EBITDA Margin 12.4% 13.6% 14.3% 15.0% 16.3% 16.6% 17.9% 18.3% 15.3% 24
25 Thank You For Your Time Investor Relations Contact: Mike Morris, CFO & Treasurer (404)