The Evolution of the PJM Market in the United States: Looking Back to Look Forward
|
|
|
- Ronald Page
- 5 years ago
- Views:
Transcription

1 The Evolution of the PJM Market in the United States: Looking Back to Look Forward Feasibility Study for ASEAN Multilateral Power Trade September 5-6, 2018 Jakarta, Indonesia Craig Glazer Vice President PJM Interconnection September 5, A PJM Interconnection PJM 2018 Company

2 The PJM Model What Makes It Work? Topics History: Evolution, Progress and Pitfalls Industry Players Market Fundamentals IP and Physical Infrastructure Requirements Lessons Learned 2

3 Brief History Topic One: PJM History, Evolution, Progress and Pitfalls Looking forward by looking back 3


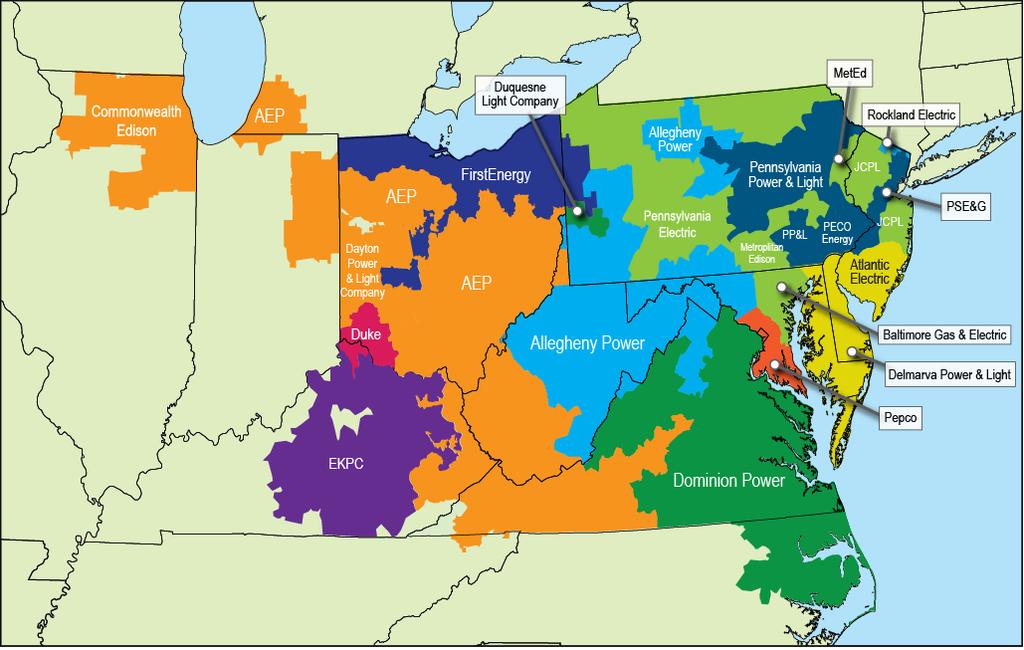
4 PJM as Part of the Eastern Interconnection Key Statistics Member companies 1,040+ Millions of people served 65 Peak load in megawatts 165,492 MW of generating capacity 178,563 Miles of transmission lines 84, GWh of annual energy 773,522 Generation sources 1,379 Square miles of territory 243,417 States 27% served of generation in Eastern Interconnection 13 + DC 27% of generation in Eastern Interconnection 28% of load in Eastern Interconnection 20% of transmission assets in Eastern Interconnection 21% of U.S. GDP produced in PJM As of 2/2018 4

5 PJM Evolution 5


6 PJM East and PJM West Two Different Evolutions 1. PJM West: Vertically Integrated Utilities Each utility plans and dispatches its own system Trading only when opportunity arises/split the savings Investment arrangements: Long-term contracts available but utility has obligation to build/procure 2. PJM East (Traditional PJM Region): Power Pools for Sharing of Capacity and Single Dispatch 6
7 A Look Back in History PJM Western Region Evolution Original Model in the PJM Western Region: Vertically Integrated Utilities with Limited Cross-Border Trading State regulator reviewed utility builds Originally after-the fact prudence reviews 1970 s to 1980 s Moved in the 1980 s to integrated resource planning 1980 s to 1990 s Rate-making treatment required crediting to customers of percentage of off-system sales and timely recovery of purchased power costs Cross-border trades approved by federal regulator (FERC) 7


8 A Look Back in History PJM Western Region Evolution Advantages of the Model: Maintained individual state sovereignty over utility decisions Localized planning and expansion meant individual state needs Disadvantages of the Model: Costly, inefficient power plant and transmission development Burden on customers due to their having to pay full infrastructure build-out costs with limited recognition of offsetting benefits 8

9 PJM Eastern Region: Power Pool Arrangement Utilities agree to share reserves from large hydro-electric project Cost sharing of transmission lines Single dispatch of the hydro plant as a whole so as to optimize dispatch with individual utility needs 9
10 A Look Back in History PJM Eastern Region Evolution Original Model in the PJM Eastern Region: Power Pool Arrangement (continued) Transmission and purchased power cost sharing agreement approved by the federal regulator Individual state regulators cannot change rates for interstate wholesale transactions but can question prudence of utility entering into individual transactions to meet their customer s demand Rates originally set at cost as determined by federal regulator 10
11 Power Pools: Advantages Sharing of hydroelectric project and transmission build-out costs Single dispatch maximized use of each pool member s generation Transmission planning maximized transfer capabilities Smoothed out lumpy investment Advantages of diversity of peaks/weather conditions and customer profile (agricultural vs. urban vs. government) Allowed each utility to meet its customer s needs at least cost 11
12 Power Pools: Disadvantages Structure was closed to IPPs Required agreements on new builds Challenges if each participant does not meet its obligations to the pool Degree of savings depended on each individual utilities resource choices potential for cost shifting within the region Large customers bore costs of subsidies to agriculture, government or residential customers 12

13 Rethinking Both Models The 1980s: History Fast Forward Cracks in the regulatory framework cause review of the traditional model Worldwide demands for new capital bring into question the governmentowned model 13

14 Major Changes in PJM: Introduction of Wholesale and Retail Competition: 1990 s 14

15 Market participants (utilities, customers) came forward under pressure from state and federal regulators to open the power pool single dispatch to competition Creation of a real-time market: 1998 Regulator finds market model the basis to move away from regulated cost-ofservice rates and depend on the market to discipline prices. 15

 Wholesale")

16 Development of PJM Markets Drivers Present Future Outlook FERC Landmark Orders 888/889 Promote wholesale competition Transmission open access Functional Separation of generation/marketing from transmission Mandated unbundling of electric services Retail Competition starting in several States (PA, NJ, MD, DE) Wholesale competition necessary to support effective retail competition Initial mandate was to provide a platform for wholesale energy trading that also supported open access to transmission system 16


17 Topic 2: Who Participates in the Market? 17
18 Self Supply Load serving entities that own generation assets to serve their load Vertically Integrated Utilities The Players Typically incumbents that own and operate assets through the entire supply chain Independent Power Producers (IPP) Demand Response and Energy Efficiency Curtailment Service Providers Financial Players Use Financial Transmission Rights (FTRs) or virtual bids to provide market liquidity 18

19 Topic 3: How Did the PJM Market Evolve? Early attempts and reforms along the way 19

20 PJM Initial Market Design Initially a simple pricing mechanism (single zone) and trading rules to promote bilateral trading Minimized interaction between market incentives and physical power system operation Result was market failure generators were incented to act in a manner contrary to system reliability PJM had to initiate emergency procedures to direct generation reductions Market design was abandoned and replaced with flow-based Locational Marginal Pricing (LMP) system on April 1,
 auctions Resource capacity market Ancillary services markets Coordinated regional transmission expansion planning Demand response/distributed resource")
21 PJM Current Present Future Outlook Introduction, and progressive evolution, of: Real-time locational marginal pricing (LMP) market Day-ahead market Financial transmission rights (FTR) auctions Resource capacity market Ancillary services markets Coordinated regional transmission expansion planning Demand response/distributed resource programs 21

22 Evolution of Markets 22
23 PJM s Markets Day-Ahead Energy Market (June 1, 2000) Real-Time Energy Market (April 1, 1997, April 1, 1998) Capacity (January 1999) RPM (June 2007) Financial Transmission Rights (June 1, 1999) Ancillary Services Markets Regulation (June 1, 2000) Synchronized (Spinning) Reserve Market (December 1, 2002) Day-Ahead Scheduling Reserve (June 2008) Black Start Services (December 1, 2002) Reactive Services 23
24 Topic 4: Infrastructure Requirements Infrastructure Needed to Synchronize a Market with Dispatch 24
 or Distributed Network Protocol (DNP)")
25 Infrastructure Requirements All members required to provide and receive data to and from PJM System Control and Monitoring Billing (Accumulator data) Metering must meet ANSI and higher standards depending on application Data Provided over Inter-Control Center Communications Protocol (ICCP) or Distributed Network Protocol (DNP) 25

26 RTO Operation 26

27 Day-Ahead Energy Market Information Flow 27
 basis for each 5-minute interval. Corresponding generation dispatch signals are sent back to resource owners. 28")
28 Real-Time Operations and Markets Functionality X % of scheduling determined in the Day Ahead Market Real-time system operations and markets work hand in hand to ensure reliability in the most efficient manner possible Market prices are calculated on a nodal (locational) basis for each 5-minute interval. Corresponding generation dispatch signals are sent back to resource owners. 28

29 Topic 5: Lessons Learned 29

30 Lessons Market Establishment Market establishment is a complex challenge, with high stakes Electricity market establishment programs are large, high-profile, multi-disciplinary undertakings, critical to the overall market reform agenda. Scope is a moving target Often processes are being defined, and systems specified, while the market design and rules are still being finalised. This is a frequently unavoidable reality, that must be carefully managed. Capability involves more than just systems Establishing the market involves not just complex IT, but significant organizational change and process development. 30


31 Lessons Market Establishment Provide a soft landing Where participants are unfamiliar with market constructs, they face substantial commercial risk at market opening. Constructs such as vesting contracts are essential in managing this Lack of participant readiness is a frequent cause of market delay It is essential to involve participants early in the market establishment process, and frequently assess their readiness to ensure they are commercially prepared: Provide extensive training and certification Track ongoing readiness Conduct Market Simulations and Market Trials prior to go-live 31
32 LET S TALK Craig Glazer Vice President-Federal Government Policy PJM Interconnection Washington, D.C., USA craig.glazer@pjm.com 32
33 Technical Appendix Topic 1: A Day in the Life of the System Operator Topic 2: PJM Governance Structure Topic 3: Technical Requirements on Market Participants Topic 4: Looking Back Market Development in Hindsight Topic 5: Future Challenges 33

34 Topic 1: A Review of Markets and Operations Today A Day in the Life of a System Operator 34
35 Overall Market Timeline Long Term Up to 4 years ahead Hours Ahead Week Ahead Day Ahead Real Time (operating day) Hours Ahead Minutes Ahead Bilateral forward contracts/ over the counter Transmission reservations - ARR allocations - Annual FTR auctions Outage analysis Load forecast Forward reliability analysis Day-ahead market Reliability analysis Unit commitment Near-term reliability analysis Real-time market Unit dispatch system Ancillary service markets - FTR secondary market Monthly FTR auctions - Generation capacity market 35

36 Energy Market Cycle (Cont.) 36

37 Almost all modern electricity markets utilize the concept of marginal pricing : Represents the cost of the last flexible increment of supply. All buyers pay, and all sellers are paid, the marginal price, regardless of their individual bids/offers. Typically determined through a periodic auction, with a price set for each trading period. Marginal Pricing 37
38 Topic 2: PJM Governance Structure 39


39 Independence and Governance Process Independent Board of Managers Members Committee Market Monitor Independent Board of Managers Stakeholder process provide balanced stakeholder input Established process for discussion of market evolution ISO funding and startup 40
 ahead of the operating window through web based portals Lead time requirement for submission depends on the parameter and market product")
40 Participating in PJM s Markets PJM s business manuals clearly establish roles, responsibilities, and timelines for action Participants submit required information (bids and other information) ahead of the operating window through web based portals Lead time requirement for submission depends on the parameter and market product 41

41 Topic 3: Technical Requirements on Market Participants 42
42 Unit Parameters in Markets Gateway Unit Unit Status Resource Type MW Operating Limits Ramp Rates Weather and Wind Forecasts Startup & No-Load Costs for price-based units Schedule Schedule Types and Selection Offer Curves MW Operating Limits Startup & No-Load Cost for cost-based schedules Startup/No-Load switch Startup and Notification times Min and Max Data Condenser Data Hourly Updates Commit Status MW Operating Limits 43
, based on actual power system security")
 and")


43 Locational Marginal Pricing (Nodal Pricing) Spot market with flow-based pricing at individual transmission buses (nodes), based on actual power system security constraints. Implemented via security-constrained economic dispatch (Real Time) and security-constrained unit commitment (Day Ahead). LMP: A method to price energy purchases and sales Generators get paid at generation bus LMP Loads pay at load bus LMP Transactions pay differential between source and sink LMP LMP Timeline = System Energy Price Transmission Congestion Cost Cost of Marginal Losses 1998: Used in Real-Time Energy Market 2000: Implemented Day-Ahead Energy Market 2012: Shortage Pricing 44
44 Topic 4: Looking Back Market Development in Hindsight 45
45 Incremental Market Development PJM s markets have developed in an evolutionary fashion, rather than a big bang a deliberate risk management strategy. Real-Time Market Uniform price Frequency regulation market Nodal pricing Synchronized reserve market Shortage pricing Non-synchronized reserve market Ancillary services co-optimization Financial Transmission Rights (FTRs) FTRs allocated FTR auctions FTR options Day-Ahead Market Day-ahead market (nodal pricing) Day-ahead scheduling reserve Capacity Market Installed/unforced capacity market Reliability pricing model for capacity Capacity performance
46 Incremental Market Development in Perfect Hindsight With perfect hindsight, and the technology now available, we would still implement incrementally, but would probably group implementation activities as shown below. Real-Time Market Phase 1 Nodal-price real-time market Co-optimized regulation and reserves FTRs FTRs allocated Phase 2 FTR auction and reconfiguration Phase 4 FTR options Day-Ahead Market Non-market unit commitment Phase 3 Day-ahead market (nodal) Day-ahead scheduling reserve Capacity Market RPM-based capacity market w/ capacity performance 47


47 Topic 5: Future Challenges in PJM 48

48 Challenges Integrations Coordinating Loop Flow Co-optimization of Energy and ancillary services Gas/Electric Coordination Demand Response Capacity Product Quality Subsidies and Efficient Market Pricing Distributed Energy Resources 49
49 LET S TALK Craig Glazer Vice President-Federal Government Policy PJM Interconnection Washington, D.C., USA craig.glazer@pjm.com 50