Developing a Large Scale Hybrid Simulation Model of the Minneapolis Metropolitan Area
|
|
|
- Maria Shepherd
- 5 years ago
- Views:
Transcription
1 Developing a Large Scale Hybrid Simulation Model of the Minneapolis Metropolitan Area Derek Lehrke Minnesota Traffic Observatory, University of Minnesota 26th Annual Transportation Research Conference, May 20 th, 2015
2 Overview Objectives Methodology Geometry Demand Control Calibration Lessons Learned Conclusions
3 Project Objectives 1. Build a Twin Cities Metro-wide Traffic Simulation model. 2. Introduce dynamic components in the Regional Planning Model (RPM) Mode Choice step. Use it to evaluate impact on the network from the implementation of the Green line LRT.
4 Methodology Build a multi-resolution traffic simulation model of the Twin Cities metropolitan network or a large part of it. High resolution (Microscopic) representation of the two LRT corridors and surrounding roadways Medium (Mesoscopic) resolution on rest of region Utilize equilibrium based DTA to represent stable but dynamic route choice behavior

5 Methodology: Multilevel Hybrid Simulation Static Traffic Assignment (Macro) Replicate RPM results Generate best guess static routes Utilize entire network to run a Hybrid Dynamic User Equilibrium simulation Study area is microscopic Border of study area is mesoscopic-fine Greater network is mesoscopic-rough Hybrid Lessons learned: Having all levels under the same application greatly reduces build effort and duplication Need to upgrade to a multiuser environment so modelers can work in parallel.
6 Introduce dynamic components in the RPM Mode Choice step. Replace the Traffic Assignment step in the RPM and form a loop with the Mode Choice step. LL: Make sure there is a formed relationship between the two models before you start building them.

7 Geometry: Entire Network 24 Hour Demand 9,126,634 Total Trips 1630 Centroids 28,500 Individual Sections 10,500 Nodes

 Lesson learned: Some times too much detail is not a good thing.")
8 Geometry: Enhanced Detail Areas inside the red and blue lines represent areas where the details of the network were updated with additional information (Traffic control, Geometry, etc.) Lesson learned: Some times too much detail is not a good thing. Neighborhood streets did not offer much utility and increased routing calibration effort
9 Demand Demand generated by the RPM 3 vehicle matrices for each demand interval (72 total) SOV, HOV, Truck LRT lines simulated based on schedules Combined Multiple RPM demand intervals to form peak period demands AM Peak (6:00am 8:30am) PM Peak (3:30pm 6:00pm)
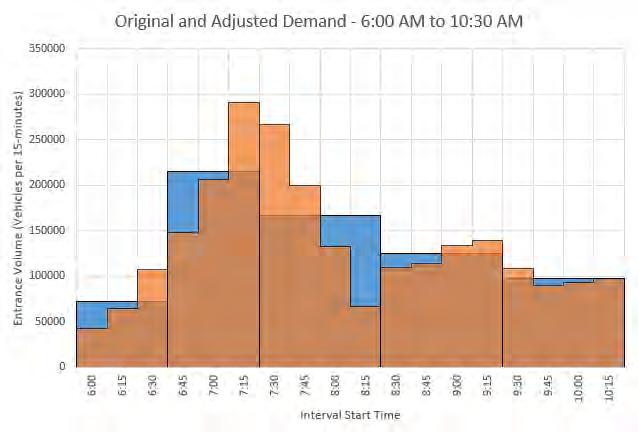
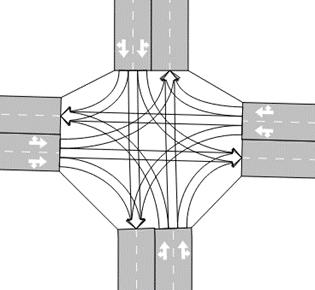
10 Demand Segmentation
11 Traffic Control 798 signals in Hybrid Network 3 Time periods (AM, PM, Off-Peak) Light Rail Control 11+ preemption Full interruption of signal and immediately advancing to the LRT movement. LRT does not have to stop 40+ Actuated LRT phase (Transit Signal Priority) Reduces phases before LRT movement to minimum green time. LRT may come to a complete stop at the intersection Skip left turn phase if no vehicle present Signal timings constantly adjusted Lesson learned: Need to organize traffic control information and promote a unified, electronic format. No PDFs!


12 Real Data for calibration MnDOT Freeway detector counts/speeds/flows Turning movement counts Minneapolis from TCMS University Ave from City of Saint Paul Traffic Operations Tube counts for CCLRT Corridor Data available is concentrated heavily around AM and PM peak hours Counts do not agree with each other. Need methodology to make adjustments.

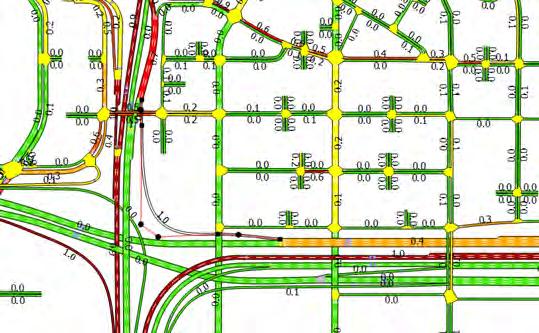
13 Results: Hybrid model validation 7:30am to 8:30am
14 Implementation of the Hybrid Model Evaluate the impact on the network from the implementation of the Green line LRT. Develop two alternatives, before Green line and after Green line Use to evaluate the changes in traffic conditions on surrounding roadways Full Report on the impact is available through the CTS website Evaluating Twin Cities Transitways Performance and their Interaction with Traffic on Neighboring Major Roads
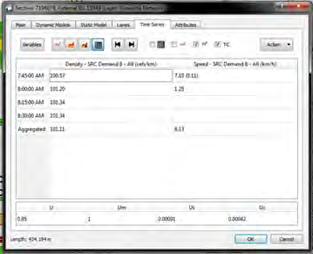
15 Lessons Learned: Sensitivity Effect of Mesoscopic model parameters Delay Speed Travel Time Mean Queue sec/km km/h sec/km veh Base RT up.2 sec RT up.4 sec RT up.6 sec

16 Lessons and bugs Meso-rough intersection conflicts Jam density gridlock
17 Lessons and bugs Long run times make calibration difficult Large memory requirements restrict simulation duration Pre Green Line Network Green Line Network Demand Interval RAM (GB) Iterations Run Time (hr) RAM (GB) Iterations Run Time (hr) 6 6:00-6: :45-7: :30-8: :30-15: :30-16: :30-17: :30-18: Multi-Demand 6-8 6:00-8: :30-18: Have a good Database and GIS based container to store and visualize the results. Too big for native programs and traditional methods
18 Conclusions Large scale simulation is feasible Interfacing with Travel Demand Model also feasible Requires more work in streamlining calibration One must be careful of the software used. All have bugs that are accentuated with network size. Process can be institutionalized like the RPM and generate a Dynamic Traffic Assignment Regional Simulation Model Improve resolution with each project Provide model as a cost saving resource Open source paradigm
19 Questions? Derek Lehrke Research Engineer, MTO T E lehr0063@umn.edu John Hourdos Director, MTO T F E Hourdos@umn.edu Minnesota Traffic Observatory (MTO)