Clustering-Based Heuristics for the Two-Echelon Vehicle Routing Problem
|
|
|
- Marshall Stewart
- 5 years ago
- Views:
Transcription
1 Clustering-Based Heuristics for the Two-Echelon Vehicle Routing Problem Teodor Gabriel Crainic Simona Mancini Guido Perboli Roberto Tadei November 2008
2 Clustering-Based Heuristics for the Two-Echelon Vehicle Routing Problem Teodor Gabriel Crainic 1,2,*, Simona Mancini 3, Guido Perboli 1,3, Roberto Tadei 3 1 Interuniversity Research Centre on Enterprise Networks, Logistics and Transportation (CIRRELT) 2 Department of Management and Technology, Université du Québec à Montréal, C.P. 8888, succursale Centre-ville, Montréal, Canada H3C 3P8 3 Department of Control and Computer Engineering, Politecnico di Torino, Corso Duca degli Abruzzi, 24 - I Torino, Italy Abstract. The Two-Echelon Vehicle Routing Problem (2E-VRP) is an extension of the classical VRP where the delivery from a single depot to customers is managed by routing and consolidating the freight through intermediate depots called satellites. We presented several meta-heuristics based on separating the first and second level routing problems and solving iteratively the two resulting routing subproblems, while adjusting the satellite workloads linking them. The two main meta-heuristics use a clustering and a multi-depot approach, respectively. We present experimental results comparing the meta-heuristics among them and with an exact method, as well as examining the impact of different customer and satellites spatial distributions on the performance of the methods and the cost of the distribution system. The experiments show that the clustering-based metaheuristics perform very well and that a two-echelon system may significantly reduce the cost of distribution. Keywords. Two-echelon vehicle routing, meta-heuristics, clustering. Acknowledgements. Partial funding for this project has been provided by the Italian Ministero dell Universite della Ricerca through Progetto PRIN Problemi Integrati di Vehicle Routing e Container Packing: Modelli ed Algoritmi. Funding has also been provided by the Natural Sciences and Engineering Research Council of Canada (NSERC), through its Industrial Research Chair and Discovery Grants programs, by the partners of the Chair, CN, Rona, Alimentation Couche-Tard and the Ministry of Transportation of Québec, and by the Fonds québécois de recherche sur la nature et les technologies (FQRNT Québec) through its Team Research grants program. Les résultats et opinions contenus dans cette publication ne reflètent pas nécessairement la position du CIRRELT et n'engagent pas sa responsabilité. * Corresponding author: Teodor.Gabriel-Crainic@cirrelt.ca Dépôt légal Bibliothèque et Archives nationales du Québec, Bibliothèque et Archives Canada, 2008 Copyright Crainic, Mancini, Perboli, Tadei and CIRRELT, 2008
3 1 Introduction In Multi-Echelon Vehicle Routing Problems, the delivery from one or more depots to customers is managed by routing and consolidating the freight through intermediate depots called satellites. This approach is strongly connected to the design of City Logistics systems for large cities, where it provides the means to efficiently keep big trucks out of the city center, small and environment-friendly vehicles providing the last leg of distribution activities. This family of problems differs from multi-echelon distribution systems present in the literature, which focus on the utilization of facilities and the flow assignment between levels, while the management of the fleet and the global routing of vehicles in the system are key elements in the case we consider. In this paper, we address the basic, static version of the problem, denoted the Two- Echelon Vehicle Routing Problem (2E-VRP), characterized by a single depot and a given number of satellites. The first level routing problem address the depot-to-satellites delivery, while the satellites-to-customers delivery routes are to be built at the second level. We are given a homogeneous fleet of fixed dimension at each level, and capacity limits exist for vehicles and satellites. One product is considered and split deliveries are permitted at the first level only. The goal is to ensure an efficient and low-cost operation of the system, while the demand is delivered on time and the total cost of the traffic on the overall transportation network is minimized. The literature on 2E-VRP is limited. A formulation for the 2E-VRP has been presented by Feliu et al. (2007), with which instances up to 20 customers were solved to optimality. In the same paper, the authors derived two math-heuristics able to address instances up to 50 customers. A general time-dependent formulation with fleet synchronization and customer time windows was introduced by Crainic et al. (2007) in the context of two-echelon City Logistics systems. The authors indicated promising algorithmic directions, but no implementation was reported. In this paper we introduce and compare meta-heuristics for the 2E-VRP based on separating the first and second level routing problems and applying an iterative procedure where the two resulting subproblems are solved sequentially. Different meta-heuristics are obtained by varying the method used to address the second-level subproblem, clustering and multi-depot VRP, as well as the improvement heuristics performed once a good solution is built. We also report the results of an experimental phase, performed on problem instances of various sizes and layouts, aimed at evaluating the performance of the various meta-heuristics, as well as analyzing the impact of customer and satellites spacial distributions on the cost of the distribution system. We describe the methodology in Section 2 and report on the computational results and analyzes in Section 3. Conclusions and perspectives are presented in Section 4.
4 2 Methodology We proceed in two phases. The first phase builds a good feasible solution, while the second aims to improve it. We apply throughout a separation strategy splitting the problem into two routing subproblems, one at each level. A solution for the second level is computed first, which yields a customers-to-satellite assignment configuration. Based on the latter, a solution is built to the first-level VRP, where satellites are considered the customers with a demand equal to the sum of the demands of the customers assigned to them. The solution to the first-level VRP modifies the parameters defining the secondlevel subproblem to be solved next, and so on and so forth in a recursive way. Two approaches are proposed for the second-level routing subproblem, where satellites are the depots. The first clusters customers and assigns them to satellites, thus decomposing the problem into several, small VRPs, while the second addresses it as a multi-depot VRP. Several heuristics modifying the routes at the second level and, thus, the customer-to-satellite assignments are proposed for the second phase. We present first the two approaches for the first phase, followed by the description of the second-phase heuristics. 2.1 First phase: Clustering Clustering (Dondo and Cerdà, 2007) customers and allocating them to satellites can be used to decompose the second-level VRP into a number of small and independent, single depot (the satellite) VRPs. The initial clustering is based on a simple distance-based rule and is then refined through a pseudo-greedy multi-start procedure. Figure 1 illustrates a clustering of customers around six satellites. Figure 1: Clustering illustration 2
5 The initial clustering is based on the direct shipment criterion, which assigns a customer to its nearest satellite in euclidean distance. The assignment must be feasible with respect to the fleet-size restriction (e.g., in a system with two satellites, a fleet of four vehicles with equal capacity of 6000 units, and a total customer demand of units, an assignment resulting in a demand of units for one satellite and 8000 units for the other requires at least 5 vehicles and is thus not feasible). If the assignment is not feasible, the customer is assigned to the second nearest satellite, and so on until a feasible assignment is found (the actual nearest satellite is marked as second-nearest satellite). The resulting independent VRPs are solved using a standard solver (we used the commercial software ILOG Dispatcher) and the cost of the second-level solution is calculated as the sum of the distances covered by all vehicles. The demand of each satellites is updated according to the assignment and the first level VRP is solved. The combination of the first and second-level VRPs yields a feasible solution to the 2E-VRP denoted the current solution with a cost equal to the sum of the second and the first level routing costs. The following procedure is then used to attempt improving the initial clustering solution: 1. Sort customers in increasing order of the difference in distances between the customer and its nearest and second-nearest satellites, respectively; 2. Consider the first customer on the list and assign it to its second-nearest satellite (e.g., in Figure 2 a customer is moved from the green to the pink cluster); 3. If the new cluster assignment is not feasible with respect to the fleet size constraints, consider the next customer on the list; 4. Otherwise, solve the small independent VRPs for the new clusters; 5. Update the demand of each satellite according to the new assignment and solve the first-level VRP; 6. Compute the global cost of the new solution and compare it to the cost of current solution; If 7. If the new solution is better, keep it as the new current solution, and re-start the procedure; Otherwise, consider the next customer of the list until either the list is empty or a given stopping criterion (number of iterations or computing time) is reached. 3
6 Figure 2: Customer moves from green to pink cluster in improving procedure 2.2 First phase: Multi-Depot VRP The second-level routing problem may be viewed as a multi-depot VRP where all satellites and customers are considered simultaneously. The first phase then becomes: 1. Solve second-level routing problem as a multi-depot VRP and compute the corresponding demand of each satellite; 2. Solve the first level VRP; 3. Compute the global cost of the solution as the sum of the first and second-level routing costs. Solving the multi-depot VRP should be faster than the clustering method, since it avoids the time-consuming cluster improvement step. On the other hand, solutionprecision issues might arise when the size of the problem grows. 2.3 Second phase: Improvement heuristics The first phase yields The feasible solution resulting from the first phase is constructed based on customer-satellite distances and assignments. The improvement heuristics presented in this section are no longer operating on these attributes, but focus directly on the routes. Three different heuristics are presented. The split-large-route heuristic aims to avoid routes with long distances between two consecutive customers by increasing the number of routes. Let n be the number of customers in a route and k its length. The heuristics then proceeds as follows: 4
7 1. Consider the routes successively and, for each route, consider the distance d(i; i+1) between each customer i within the route and its successor in the route (if there is one); 2. If d(i; i + 1) >= 2 n/k, then split the route into two shorter routes, where the vehicle covering the first route returns to the satellite after serving customer i and another vehicle starts from the satellite, goes directly to customer i + 1, and then cover the remaining part of the initial route as illustrated in Figure 3. Figure 3: The split-large-route heuristic The next two heuristics implement modifications involving two routes at a time. Such modifications may change the demand associated to satellites, when the two routes belong to different satellites, and thus, potentially, the first-level routing. Both heuristics are thus repeated for a fixed number of iterations, t, unless no changes occur for an entire iteration, when they are stopped. The add heuristic focuses on moving one customer from its current route to another route, following the principles of the well-known insertion heuristic (Salhi and Nagy, 1999; Laporte et al., 2000; Laporte and Semet, 2002; Cordeau et al., 2002; Gendreau et al., 2002): 1. Consider each route successively and, for each customer i in route l find the nearest node j on a a different route k i; 2. If the capacity of the vehicle covering route k is smaller than the demand of customer i 5
8 (a) Remove customer i from route l; (b) Add customer i to route k just after j (see Figure 4): (c) Update the second-level costs and satellite demands; (d) If the satellite demands have been modified, solve the first-level VRP; (e) Update the global-solution cost; (f) If the new solution is better than the current solution, keep it as the new current solution. Figure 4: The add heuristic The third method is an exchange heuristic that swaps two customers within two different routes (Potvin and Rousseau, 1995; Laporte et al., 2000; Laporte and Semet, 2002; Cordeau et al., 2002; Gendreau et al., 2002): 1. Consider each route successively and, for each customer i in route l find the nearest node j on a a different route k i; 2. Identify within route k, customer w, which is nearest to a customer, denoted z, of route l; 3. If the capacity of the vehicle covering route k minus the demand of w is smaller than the demand of customer i and if the capacity of the vehicle covering route l minus the demand of i is smaller than the demand of customer w, then (a) Remove customer i from route l and add it to route k just after j; (b) Remove customer w from route k and add it to route l just after z; 6
9 (c) Update the second-level costs and satellite demands; (d) If the satellite demands have been modified, solve the first-level VRP; (e) Update the global-solution cost; (f) If the new solution is better than the current solution, keep it as the new current solution. 3 Experimentation The goal of the experimentation is twofold. First, to compare the performances of the proposed heuristics, both among each other and with the exact method of Feliu et al. (2007). Second, to perform an analysis of the impact of different customer-satellites distributions and satellite location patterns on algorithmic efficiency and solution quality. In this section, we present the problem instances used for experimentation and the result analysis on the smaller sets. The results on the larger problem sizes are analyzed in the next section. 3.1 Problem instances Experiments were performed on several sets of instances with a single (first level) depot, fixed fleet sizes at both levels, and satellites located directly over customer locations. For comparison purposes, we considered the two sets of six small instances with 21 and 32 customers, respectively, proposed by Feliu et al. (2007). For all instances, the depot occupies a central position and the two satellites are located on opposite sides with respect it and at more or less the same distance from it (Figures 5 and 6). The maximum number of second-level vehicles is fixed at 4 for all instances, but the vehicle capacity is fixed at 6000 units for the first set and at 8000 units for the second set. The amount of total demand is in the 90% 95% range of the maximum sustainable load (93, 375% and 91, 781%, respectively) to make sure vehicles are fully loaded, while still making finding feasible solutions relatively easy. 7
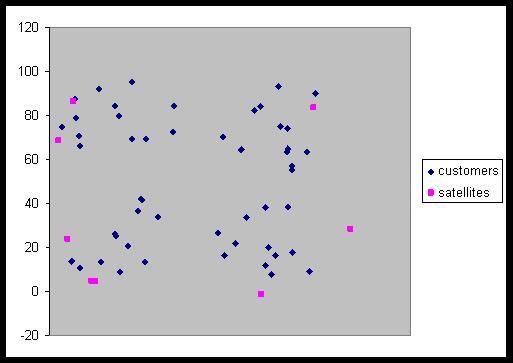
10 Figure 5: A small, 21 customers, instance Figure 6: A small, 32 customers, instance To broaden the scope of the analysis, we also generated three sets of larger instances, with 50, 100, and 150 customers, respectively, combining three customer distributions and three satellites location patterns. Two instances were generated for each combination of customer distribution, satellite location pattern, and number of customers, for 54 instances in total. In all cases, the region where customers are located was represented as a square of space units and the depot was randomly located within a space-units rectangle placed 50 space units above the customers square. The three customer distribution patterns are: Random to represent a regional distribution. The x and y coordinates of customers were randomly chosen with a [0, 100] uniform distribution (Figure 7); Centroids to represent downtown and suburb zones in a large city. The downtown zones were represented as a square located in the center of the big square standing for the city, while four squares placed in the corners of the large square represented the suburbs. Six customer centroids were first located within the central zone and one for each corner zone. An imaginary circle of 10 space-units radius was drawn around each centroid and a fixed number of customers was randomly located within each. The number of customers around each 8
.")

11 centroid depended on the total number of customers and was given by an integer approximation of the ratio customers/number of centroids (Figure 8). Quadrants to simulate the case of small towns located on the side of a river, a major route, or in a valley, where customers are clustered into large zones (e.g., on the sides of the river, etc.). The square standing for the zone of possible customer locations was divided into four quadrants. A customer is randomly located in each quadrant in a position allowing a 20 space-unit-radius circle around it completely within the square. A fixed number of customers given by an integer approximation of the ratio customers/number of quadrants was then randomly located within each of these circles (Figure 9). Figure 7: Random customer location Figure 8: Centroid customer location 9

12 Figure 9: Quadrant customer location Satellite location can be constrained by various geographic, land-use or logistics restraints. To better understand the relations between these conditions and the performance of a two-level distribution system, three different satellite location patterns were considered: Random. This pattern simulates a situation without land-use, geographic, or logistic constraints, in which satellites can be distributed all around the city. The satellites are thus randomly located in an annulus of thickness 20 space units around the customer location square. This may result in several satellites being located close to one another and a large zone of the city not receiving any satellite as illustrated in Figure 10; Sliced. This pattern addresses the location gap issue identified previously. The annulus around the customers is divided into n slices, where n represents the number of satellites to be located, and a satellites is randomly placed inside each slide (see Figure 11); Forbidden Zone. Various conditions, e.g., the city is located near the sea or a mountain, may forbid the location of satellites in certain zones of the city. To recreate such cases, an angle Θ in the range [0, 360] is randomly chosen and satellites are not located in the part of the annulus defined by that angle (Figure 12). 10


13 Figure 10: Random satellite location Figure 11: Sliced satellite location Figure 12: Forbidden Zone satellite location 11
14 SAT SOLUTION GAP CPU TIME ,07 0,00% ,96 0,00% ,42 0,00% ,50 0,00% ,22 0,00% ,78 0,00% 1000 Table 1: Exact method results on 21-customer instances SAT SOLUTION GAP CPU TIME ,36 6,54% ,74 13,38% ,91 11,14% ,78 17,05% ,94 4,41% ,31 4,75% 5000 Table 2: Exact method results on 32-customers instances 3.2 Analysis of results on small instances Tables 1 and 2 report the performance of the exact method of Feliu et al. (2007) to which the behavior of our methods are compared. For the 21-customer instances the optimum is always attained, even though significant computational times are generally required. For the 32-customer instances, optimality gaps between 4% and 20% are obtained (average gap around 10%) within 5000 CPU seconds. In the following, we present the performance results of the meta-heuristics we propose. The behavior of the first phase clustering and multi-depot heuristics is analyzed both as stand alone methods and combined to the second-phase improvement heuristics. In all tables, the gap columns indicate the difference in percentage between the solutions obtained by the respective heuristic and the exact method. All procedures are coded in C++. The results obtained by the clustering heuristic appear in Tables 3 and 4, where the first two columns correspond to the initial clustering, while the next two report results following the cluster-improvement step. The iter column indicates the iteration where the best result has been identified, while the total number of iterations performed appears in the last column. The results are very encouraging and show that clustering offers a fast method for 12
15 INIT CLUST GAP CLUST GAP ITER ITERMAX 438,53 5,14% 417,07 0,00% ,84 0,74% 387,84 0,74% ,27 3,00% 487,27 3,00% ,59 8,18% 404,59 8,18% ,99 7,33% 460,99 7,33% ,63 7,72% 425,63 7,72% 1 10 Table 3: Clustering results on 21-customer instances INIT CLUST GAP CLUST GAP ITER ITERMAX 819,42 9,35% 773,61 3,24% ,33 11,25% 740,10-1,55% ,99 6,72% 758,99 3,98% ,44 10,17% 835,20-1,95% ,65-1,34% 756,65-1,34% ,33 6,23% 812,97 3,16% Table 4: Clustering results on 32-customer instances obtaining good-quality feasible solutions, On the 21-customers instances, results are good, but the optimum is reached in only one case. The time required is of the order of times faster than the exact method, however, each iteration taking 12 milliseconds CPU time only! Even better performances are observed on the 32-customer instances, where the exact method is outperformed for half of the problem instances. Moreover, it appears that increasing the size of the problem instances does not impact the performance of the method. Finally, the clustering-improvement step is beneficial, particularly on larger instances. The results of the clustering heuristic combined to the phase two improvement heuristics are displayed in Tables 5 and 6. Improving heuristics do not seem to do much on the smallest, 21 customers, instances. Only the add heuristic manages to significantly improve the solution quality for two instances. The performance is better when the number of customers increases, the add and exchange heuristics improving the solution quality on certain problems (with a slight advance to the exchange heuristic). Not surprisingly the heuristic splitting long routes does not contribute anything, the starting solutions yielded by clustering being already of good quality. The multi-depot heuristic is fast (of the order of 10 ms CPU time) but it does not perform well, as illustrated in Table 7 where important gaps are observed for almost all instances compared to the exact method. The performance improves significantly when the phase-two heuristics come into play, as indicated by the figures in Tables 8) and 9). 13
16 CLUST GAP SL GAP ADD GAP EXCH GAP 417,07 0,00% 417,07 0,00% 417,07 0,00% 417,07 0,00% 387,84 0,74% 387,84 0,74% 387,84 0,74% 387,84 0,74% 487,27 3,00% 487,27 3,00% 487,27 3,00% 487,27 3,00% 404,59 8,18% 404,59 8,18% 383,80 3,20% 404,59 8,18% 460,99 7,33% 460,99 7,33% 437,351 2,32% 460,99 7,33% 425,63 7,72% 425,63 7,72% 425,63 7,72% 425,63 7,72% Table 5: Clustering plus phase-two heuristics for 21-customer instances CLUST GAP SL GAP ADD GAP EXCH GAP 773,61 3,24% 773,61 3,24% 773,61 3,24% 733,60-2,10% 740,10-1,55% 740,10-1,55% 740,10-1,55% 740,10-1,55% 758,99 3,98% 758,99 3,98% 748,43 2,54% 752,59 3,11% 835,20-1,95% 835,20-1,95% 835,20-1,95% 835,20-1,95% 756,65-1,34% 756,65-1,34% 756,65-1,34% 756,65-1,34% 812,97 3,16% 812,97 3,16% 793,87 0,83% 785,47-0,23% Table 6: Clustering plus phase-two heuristics for 32-customer instances The add and exchange heuristics yield, again, very good results in improving the solution quality, and their positive impact is stronger when the problem size increases. Figures 13 and 14 illustrate the relative performance of the methods with respect to solution quality, for the 21 and 32-customer instances, respectively. Comparing all the methods, the exact method gives very good results for small instances, achieving the optimal solutions for all 21-customer instances. Yet, the simple clustering heuristic obtains rather good results within a computational time times inferior, good results are obtained by both the clustering (with improvement) and multi-depot heuristics within a computational time inferior, and very good results can be obtained by combining the clustering heuristics with add/exchange phase-two improvement heuristics MULTI (21) GAP (21) MULTI (32) GAP (32) 466,41 10,58% 801,01 6,45% 387,42 0,63% 784,19 4,32% 495,77 5,11% 815,39 11,71% 421,96 11,96% 893,60 4,91% 465,91 8,30% 833,33 8,66% 407,15 3,53% 837,67 6,40% Table 7: Multi-depot results on 21 and 32-customer instances 14

17 MULTI GAP SL GAP ADD GAP EXCH GAP 466,41 10,58% 466,41 10,58% 448,78 7,07% 437,82 4,74% 387,42 0,63% 387,42 0,63% 387,42 0,63% 387,42 0,63% 495,77 5,11% 495,77 5,11% 471,95 0,32% 482,75 2,55% 421,96 11,96% 421,96 11,96% 404,09 8,07% 421,96 11,96% 465,91 8,30% 465,17 8,16% 455,98 6,31% 465,17 8,16% 407,15 3,53% 407,15 3,53% 399,66 1,72% 407,15 3,53% Table 8: Multi depot plus phase-two heuristics for 21-customer instances MULTI GAP SL GAP ADD GAP EXCH GAP 801,01 6,45% 801,01 6,45% 758,33 1,18% 749,63 0,04% 784,19 4,32% 784,19 4,32% 784,19 4,32% 784,19 4,32% 815,39 11,71% 815,39 11,71% 815,39 11,71% 758,05 3,71% 893,60 4,91% 893,60 4,91% 893,60 4,91% 892,26 4,54% 833,33 8,66% 833,33 8,66% 794,36 3,45% 833,33 7,97% 837,67 6,40% 837,67 6,40% 837,67 6,40% 786,2-0,14% Table 9: Multi depot plus phase-two heuristics for 32-customer instances Figure 13: Solution quality for all methods on 21-customer instances 15

18 Figure 14: Solution quality for all methods on 32-customer instances within a computational time 1000 times inferior. The exact method is no longer competitive as soon as the number of customers is increased to 32. The clustering heuristic obtains the best results. It beats the exact method within a a computational time inferior and it achieves the best overall results when combined to the phase-two heuristics within a computational time 1000 inferior to that of the exact method. Similar results were obtained on the 54 larger instances. The multi-depot heuristic does not perform well in the present context. Part of the reason might be within the precision of the method used to solve the multi-depot VRP. Part of the answer might also be found in the fact that, considering all customers and satellites at once, a multi-depot approach over optimizes for a general algorithmic idea based on decomposition and gradual adjustment of the parameters linking the first and second-level routing problems. 4 Analysis of Customer and Satellite Distribution Patterns The 54 larger problem instances were used in the second wave of experiments aimed to gain insight into the impact of customer and satellite distribution patterns on the distribution costs. Recall that the set of problem instances is composed of two instances for each combination of the three customer distributions (random, centroids, quadrants), three satellite location patterns (random, sliced, forbidden zone), and three dimensions of the customer population (50, 100, and 150 customers). For each instance, the cases with 2, 3 and 5 satellites were considered. To obtain a smoother presentation, the detailed figures mentioned in this section are grouped in an annex at the end of the paper. These 16

19 figures display the total distribution cost for the six instances corresponding to fixing two of the three problem characteristics. Computation results reported in this section were obtained using the clustering heuristic. For all customer-population dimensions, the distribution costs for random-customer distribution are higher than those for centroid and quadrant distributions, independently of the number of satellites (Figures 19, 20, and 21 in the Annex). This result is not surprising, because in the latter two cases, customers are already clustered in certain regions, which makes it easier to assign customers to satellites and identify an efficient distribution strategy. Notice that, the differences tend to decrease as the number of satellites increases, a larger number of satellites making it easier to manage more complex customer distribution, such as those generated by the random distribution process. We also note that a bad satellite location decision may impact very strongly the cost of distribution, as illustrated in the 150-customer case (Figure 21), where for one problem instance the global cost is three times higher than in the other cases. This resulted from a very unfavorable disposition of the satellites (see Figure 15). Obviously, such a case should be avoided from the initial design phase of the system or a satellite relocation should strongly contemplated. Figure 15: An unfavorable satellite location 17
20 Examining the results from the point of view of the distribution of satellites, a number of observations can be made (Figures 22, 23, and 24). For low numbers of customers, there are not significant differences and, actually, when the number of satellites is large compared to that of customers, even a random distribution of locations is acceptable. When the number of customers grows, a sliced strategy appears to work best. Obviously, however, these results serve only to emphasize the need for a methodology for distribution systems with two-echelon routing to locate satellites according to the respective customer distribution. Figure 16: Comparison of different numbers of satellites situations for 50 customers instances Contrasting the total distribution cost between the two-echelon routing case and the more traditional VRP, it appears that satellites and the coordination they imply are beneficial. Figures 16, 17, and 18 illustrate these comparisons, displaying the total distribution costs for the VRP and the 2E-VRP with various numbers of satellites for 50, 100, and 150 customers, respectively. Costs are always lower for 2E-VRP and the advantage appears to increase with the number of customers and satellites. For example, for 100 and 150-customer cases, the system using five satellites has a cost less than 50% of the classical VRP. Of course, the appropriate number of satellites has to be determined using a formal model, but these results emphasize the interest of two-echelon models for situations with more than 50 customers. 18

21 Figure 17: Comparison of different numbers of satellites situations for 100 customers instances Figure 18: Comparison of different numbers of satellites situations for 150 customers instances 5 Conclusions We presented several meta-heuristics for the basic Two-Echelon Vehicle Routing Problem, a distribution system where the delivery from a single depots to customers is managed by routing and consolidating the freight through intermediate depots called satellites. The meta-heuristics are based on separating the first and second level routing problems and solving iteratively the two resulting routing subproblems, while adjusting the satellite workloads (customer assignments) linking them. The two main meta-heuristics use a clustering and a multi-depot approach, respectively. 19
22 The experimental results showed that, while an exact method is applicable to smallsized instances (even though computational times may be significant), heuristics are required when dimensions increase. Both the clustering and the multi-depot heuristics perform well on small problems, particularly given the very limited computational effort required. For larger problems, the clustering method outperformed all other methods on the problem sets we addressed. We also reported the results of experiments looking into the impact of different customer and satellites spatial distributions on the performance of the methods and the cost of the distribution system. The experiments showed that the clustering-based metaheuristics perform very well in many different spatial situations. They also emphasized that a two-echelon system may significantly reduce the cost of distribution. Of course, the trade-offs between these costs and those to built and manage a satellite-based system should be fully investigated. We also plan to investigate generalizations of the simple 2E-VRP through integration of customer and satellite time windows and multiple depots. Acknowledgments Partial funding for this project has been provided by the Italian Ministero dell Universit e della Ricerca through Progetto PRIN Problemi Integrati di Vehicle Routing e Container Packing: Modelli ed Algoritmi. Funding has also been provided by the the Natural Sciences and Engineering Council of Canada (NSERC), through its Industrial Research Chair and Discovery Grants programs, by the partners of the Chair, CN, Rona, Alimentation Couche-Tard and the Ministry of Transportation of Québec, and by the Fonds québécois de recherche sur la nature et les technologies (FQRNT Québec) through its Team Research grants program. While working on this project, T.G. Crainic was NSERC Industrial Research Chair on Logistics Management and Adjunct Professor with the Department of Computer Science and Operations Research, Université de Montréal, and the Department of Economics and Business Administration, Molde University College, Norway. The authors wish to thank their friend and colleague, Professor Michel Gendreau, for many enlightening discussions. 20
23 References J.-F. Cordeau, M. Gendreau, G. Laporte, J.-Y. Potvin, and F. Semet. A Guide to Vehicle Routing Heuristics. Journal of the Operational Research Society, 53: , T.G. Crainic, N. Ricciardi, and G. Storchi. Models for Evaluating and Planning City Logistics Transportation Systems. Publication CIRRELT , Centre interuniversitaire de recherche sur les réseaux d entreprise, la logistique et le transport, Université de Montréal, Montréal, QC, Canada, submitted to Transportation Science. R. Dondo and J. Cerdà. A cluster-based optimization approach for the multi-depot heterogeneous fleet vehicle routing problem with time windows. European Journal of Operation Research, 179(3): , J.G. Feliu, G. Perboli, R. Tadei, and D. Vigo. The Two-Echelon Capacitated Vehicle Routing Problem. Working paper, Control and Computer Engineering Department, Politecnico di Torino, Torino, Italy, M. Gendreau, G. Laporte, and J.-Y. Potvin. Metaheuristics for the Vehicle Routing Problem. In P. Toth and D. Vigo, editors, The Vehicle Routing Problem, SIAM Monographs on Discrete Mathematics and Applications, pages SIAM, Philadelphia, PA, G. Laporte and F. Semet. Classical Heuristics for the Vehicle Routing Problem. In Toth, P. and Vigo, D., editors, The Vehicle Routing Problem, SIAM Monographs on Discrete Mathematics and Applications, pages SIAM, Philadelphia, PA, G. Laporte, M. Gendreau, J.-Y. Potvin, and F. Semet. Classical and Modern Heuristics for the Vehicle Routing Problem. International Transactions in Operational Research, 7(4/5): , J.-Y. Potvin and J.-M. Rousseau. An Exchange Heuristic for Routing Problems with Time Windows. Journal of the Operational Research Society, 46: , S. Salhi and G. Nagy. A cluster insertion heuristic for single and multiple depot vehicle routing problems with backhauling. The Journal of the Operational Research Society, 50(10): ,
24 Annex - Satellite-Customer Distribution Results The figures in this Annex display the total distribution cost for the six instances corresponding to fixing two of the three problem characteristics, customer distributions, satellite location pattern (for 2, 3, and 5 satellites), and size of the customer population. 22

 3, and c) 5 satellites;")
25 (a) (b) (c) Figure 19: Comparison of different customer locations with a) 2, b) 3, and c) 5 satellites; 50-customer instances 23

 5 satellites; 100-customer")
26 (a) (b) (c) Figure 20: Comparison of different customer locations with a) 2, b) 3, and c) 5 satellites; 100-customer instances 24

 2,")

27 (a) (b) (c) Figure 21: Comparison of different customer locations with a) 2, b) 3, and c) 5 satellites; 150-customer instances 25

 2,")

28 (a) (b) (c) Figure 22: Comparison of different satellites locations with a) 2, b) 3, and c) 5 satellites; 50-customer instances 26
 2, b) 3, and c) 5 satellites; 100-customer")
29 (a) (b) (c) Figure 23: Comparison of different satellites locations with a) 2, b) 3, and c) 5 satellites; 100-customer instances 27
 2, b) 3, and c) 5 satellites; 150-customer")
30 (a) (b) (c) Figure 24: Comparison of different satellites locations with a) 2, b) 3, and c) 5 satellites; 150-customer instances 28