Intermodal Team. Joe Leppert
|
|
|
- Deirdre Wade
- 5 years ago
- Views:
Transcription

1 Team Joe Leppert
2 Business Dimensions Revenue $1.9 Billion Revenue CSXI 8% Premium 6% International 51% Pacer 28% IMC / Truckload 24% Steamship 34% Domestic 49%
3 Organizational Structure Commercial Network Design Finance Operations
4 Revenue and Contribution Contribution CAGR = 13% Revenue CAGR = 4% Total Revenue Total Contribution
5 Business Drivers Market - Strong International Trade - Domestic Economic Growth Price - Premium Products - Capture Asset Value Penetration - New Chicago Facility - Premium & Domestic - Major Growth Lanes
6 Business Development Initiatives Strategic Partnerships Mexico Market Market Research Initiatives Lane Balance Opportunities Non-Seasonal Baseload Customers Non-Peak Vs. Peak Growth in Major Lanes
7 Major Growth Lanes Major Lanes L.A. to Memphis Market Size ($ Billions) Cost Advantage vs. Truck L.A. to New Orleans Oakland to Chicago Chicago to Portland Chicago to L.A. Chicago to Mexico $0 $1.5 0% 50%

8 Major Lanes Portland Chicago Oakland Los Angeles Dallas Memphis New Orleans Mexico Houston
9 Margin Improvement Target (%) % from Productivity & Asset Utilization % from Revenue Growth Price Volume & Mix Double Stack Train Length HP/TT Other Drivers
10 Team John Newman
11 Contribution Volume Margin Improvement 57% Price Productivity Productivity Volume Price

12 L.A. to Houston/New Orleans Margin Improvement +82% Day-of-Week Rationalization Price Improvement Double Stack Efficiency So. Calif New Orleans Houston Network Redesign

13 Lane Contribution Lane by Lane Analysis

14 Lane Contribution Trains by Lane Detail
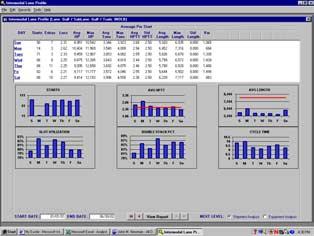
15 Lane Contribution Day-of-Week Demand

16 Lane Contribution Customer Detail
17 Scorecard - L.A. to Houston/New Orleans 2002 versus 2001 Lane Evaluation Change in Contribution Unfavorable Favorable Description Units - Decrease / + Increase +4% Revenue +5% Revenue Per Car +1% Traffic (% of Lane) Domestic 31% International 69% Operating Statistics Train Starts +3% Loads Per Train +7% Double Stack Percent +9% Horsepower/Trailing Ton -7% Train Length +2% Margin Improvement + 21% Revenue Costs Productivity & Asset Utilization Avg. Revenue / Car Volume Fuel Price Wage Inflation Others C-Rate Slot Utilization Double Stack Horsepower/TT Train Length Others

18 Profitability Management Lane Organizational Structure Tactical Working Team Quarterly Lane Reviews Monthly Business Team Reviews Quarterly Senior Management Reviews
19 Team Barry Michaels

20 Operating Initiatives Line-of-Road Train Frequency Train Size Slot & Stack Utilization Horsepower per Trailing Ton Terminal Lift Productivity Dwell Time Gate Processing
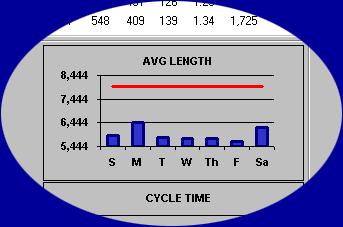
21 Productivity / Efficiency Measures Train Length Feet 5,500 5,000 4,500 4,000 3,500 Operational Drivers Network Redesign Day of Week Volume Customer Commitment Rationalization Business Rules - Annulments/Consolidations 3,
22 Productivity / Efficiency Measures Double Stack Percent 79% +13% 89% Operational Drivers Terminal Management Asset Utilization Containerization Car Type
23 Productivity / Efficiency Measures Lifts Per Unit Operational Drivers On-Dock Operations Interchange Partners
24 Productivity / Efficiency Measures Terminal Dwell 2.77 Days -14% 2.37 Operational Drivers Customer - Data Sharing Assessorial Collection Reduced Free Time Increased Storage Rates

25 L.A. to Dallas/Memphis Margin Improvement +64% Differentiated Product Interchange Partnerships Line-of-Road Productivity Memphis So. Calif Dallas
26 Scorecard - L.A. to Dallas/Memphis 2002 versus 2001 Lane Evaluation Change in Contribution Unfavorable Favorable Description Units - Decrease / + Increase +24% Revenue +20% Revenue Per Car -3% Traffic (% of Lane) Domestic 35% International 65% Operating Statistics Train Starts +12% Loads Per Train +11% Double Stack Percent +4% Horsepower/Trailing Ton -3% Train Length +11% Margin Improvement + 13% Revenue Costs Productivity & Asset Utilization Avg. Revenue / Car Volume Fuel Price Wage Inflation Others C-Rate Slot Utilization Double Stack Horsepower/TT Train Length Others
27 Future Margin Initiatives Increase Train Length Reduce Terminal Gate Processing Time Reduce Lifts per Unit Handled Price Improvement Truck-Like Fuel Price Recovery
28 Revenue Growth Potential Ag Products Autos Chemicals Energy Industrial Products TOTAL GDP 0% 1% 2% 3% 4% 5% 6% 7%
29 Union Pacific