Texas Transportation Asset Management Plan. Maintenance Division
|
|
|
- Mary Golden
- 5 years ago
- Views:
Transcription

1 Texas Transportation Asset Management Plan Maintenance Division
2
3 Table of Contents List of Figures... 5 List of Tables... 7 List of Acronyms... 9 Executive Summary Transportation Asset Management Federal Requirements & Guidelines Texas Transportation Assets Life Cycle Planning Risk Management Financial Plan and Investment Strategies Key Findings and Planned Enhancements References Chapter 1: Introduction and Background Overview Texas Highways Serving a Growing Economy and Population TxDOT Transportation System NHS System Pavement and Bridge Asset Management Practices in Texas This Document Chapter 2: Asset Management Objectives Overview TxDOT Priorities Asset Management as Expressed in TxDOT s Planning Documents Chapter 3: Asset Inventory, Performance Measures, and Condition Overview Texas TAMP Assets Inventory Condition Measurement Bridge and Pavement Current Condition Chapter 4: Life Cycle Planning Overview LCP for Pavements TxDOT s LCP Process for Pavements TxDOT Pavements LCP Process for Bridges Chapter 5: Risk Management Overview Environmental Impacts Risk Management Process
4 Recurring Events Chapter 6: Financial Plan Overview Sources of Revenue Revenue for Planning Projects Asset Valuation Investment Strategies Investment Strategies Pavements Investment Strategies Bridges Chapter 7: Gap Analysis and Enhancements Overview Financial Gaps Technical Gaps Chapter 8: Communications Overview Information Gathering Information Dissemination Chapter 9: Compliance Checklist Overview Definitions (515.5) Process for Establishing the Asset Management Plan (515.7) Asset Management Plan Requirements (515.9) Deadlines and Phase-in of Asset Management Plan Development (515.11) Minimum Standards for Developing and Operating Bridge and Pavements Management Systems (515.17) Organizational Integration of Asset Management (515.19) References
5 List of Figures Figure 1. Texas TAMP Implementation Figure 2. Texas Economy Figure 3. Texas Highway System and Historical Growth Trends (10) Figure 4. Changes in Texas Demographics and Transportation System Figure 5. Texas Roadways Today Figure 6. NHS in Texas Figure 7. TxDOT s Transportation Planning and Programming Documents Figure 8. TxDOT On-System Pavement Inventory-Lane Miles Figure 9. Texas On-System and Off-System NHS Pavement Inventory-Lane Miles Figure 10. FHWA Pavement Performance Indicators Texas On-System and Off-System NHS Lane Mile Basis Figure 11. Texas On-System and Off-System NHS Bridge Condition-Based on Number of Bridges Figure 12. TxDOT On-System Bridge Condition-Based on No. of Bridges Figure 13. Texas On-System and Off-System NHS Bridge Condition-Based on Bridge Deck Area (Millions of sq. ft.) Figure 14. TxDOT On-System Bridge Condition-Based on Bridge Deck Area (Millions of sq. ft.) Figure 15. Typical Life Cycle Costs of a Highway (15) Figure 16. Life Cycle Strategies Figure 17. TxDOT LCP Process Flow Chart Figure 18. Statewide Historical and Predicted Percent Good/Very Lane Miles for Statewide Network in 10 Years of LCP Period Figure 19. Deck Area by Age and Condition Group (NHS and On-System Bridges) Figure 20. Risk Management Process Figure 21. Storm Surge Resulting from Different Category Hurricanes in the Houston Area Figure 22. Vulnerable Lane Miles due to Storm Surge by Hurricane Category Figure 23. Example FEMA Flood Plain Map Figure 24. Lane Miles Affected by Flood Severity Figure 25. Erosion Repair and Scour Protection (Gabion Mattresses) Figure 26. FM Guadalupe River in the San Antonio District Erosion Repairs and Installation of Embankment Protection Measures (Gabion Mattresses) Figure 27. Emergency Expenditures over Time Figure 28. Sources of Revenue: Total Transportation Figure 29. Total Transportation Revenues Figure 30. Sources of Funds for Planning Projects Figure 31. Project Funding Process Figure 32. Estimated Percent of 10-Year Funding Allocation, by Impact Area Figure 33. Pavement Funding: NHS and Non-NHS, On- and Off-System
6 Figure 34. Bridge Funding: NHS and Non-NHS, On- and Off-System Figure 35. Application of Polymer Overlay Deck Surface Treatment Project (SH 31 WB over Trinity River in the Tyler District) Figure 36. Typical Concrete Substructure Repair Project to Remediate Severe Column Spalling Figure 37. Typical Steel Painting Project, Showing Localized Defects (Left), the Bridge during the Painting (Top Right), and the Bridge after Being Reopened (Bottom Right) Figure 38. TxDOT System Performance Management Process Figure 39. Planning and Programming Documents and Products Figure 40. Planning, Development, and Construction Process Figure 41. Transportation Planning and Programming Processes Figure 42. TxDOT Funding Sources and Categories Figure 43. Organizational Structure for TxDOT TAMP Preparation Figure 44. Predicted Pavement Condition Figure 45. Compliance Requirements (23 CFR 515)
7 List of Tables Table 1. TxDOT On-System Pavement Inventory-Lane Miles Table 2. Texas On-System and Off-System NHS Pavement Inventory-Lane Miles Table 3. Off-System NHS Ownership Table 4. Lane Miles and Percentiles for the Different Pavement Types Table 5. TxDOT On-System Bridge Inventory Table 6. Texas On-System and Off-System NHS Bridge Inventory Table 7. Distress, Ride, and Condition Score by TxDOT Descriptive Class Table 8. Federal Requirements for Pavement Condition Thresholds Table 9. Bridge Component Condition Rating Table 10. Bridge Condition Groups Table 11. SD Bridge Quantities, 1992 versus Table 12. TxDOT Bridge Condition Score Groups Table 13. Pavement Condition based on TxDOT Performance Indicators Table 14. TxDOT On-System Historic Performance Based on Distress Table 15. TxDOT On-System Historic Performance Based on Ride Quality Table 16. TxDOT On-System Historic Performance Based on Overall Condition Table 17. FHWA Performance Indicators Texas On-System and Off-System NHS Pavement Condition-Lane Miles Basis-Percent Table 18. Texas On-System and Off-System NHS Bridge Condition-Based on Number of Bridges Table 19. TxDOT On-System Bridge Condition-Based on No. of Bridges Table 20. Texas On-System and Off-System NHS Bridge Condition-Based on Bridge Deck Area (Millions of sq. ft.) Table 21. TxDOT On-System Bridge Condition-Based on Bridge Deck Area (Millions of sq. ft.) Table 22. Treatment Definitions for Flexible Pavements Table 23. Treatment Definitions for CRCP Pavements Table 24. Treatment Definitions for Jointed Concrete Pavement-Concrete Pavement Contraction Design (JCP-CPCD) Pavements Table 25. Different Funding Scenarios for the 10-Year Analysis Period Table 26. Pavement Treatment Unit Costs Table 27. Bridge Conditions (NHS and On-System Bridges) Table 28. Texas Climate Variables with Potential Asset Impacts Table 29. Bridge Assets Vulnerable to Flood Risk Table 30. Estimated Emergency Expenses in a Given Year Table 31. Risk Analysis Matrix Table 32. TAMP Risk Register Table 33. Estimated Total Transportation Available Revenues (in Billions$) Table 34. Estimated SHF Revenues (in Billions$) Table 35. Estimated Revenues Available for Planning Projects (in Billions$)
8 Table UTP Funding Authorizations (in Billions) Table 37. Pavement and Bridge Funding (in Billions$) Table 38. Pavement Funds (in Billions$) Table 39. Pavement Funding FY 2018 to FY 2022 (in Millions$) Table 40. Bridge Funds (in Millions$) Table 41. Bridge Funding FY 2018 to FY 2027 (in Millions$) Table 42. Asset Valuation Table 43. Predicted Performance of TxDOT On-System Pavements Table 44. Pavement Technical Gaps Table 45. Bridge Technical Gaps Table 46. Compliance Check List for Section of 23 CFR
9 List of Acronyms AASHTO ACP BMIP BPM BRG CRCP DOT FEMA FHWA FO GRID HBP HR IH IRI LCP LR Maint Ops MAP-21 MPO MR NBI NBIS NHS NOAA non-ih PA PM SD SHF SLRTP SME SOGR SR STIP TAMP TTP TxDOT UTP American Association of State Highway and Transportation Officials Asphalt Concrete Pavement Bridge Maintenance and Improvement Program Bridge Preventive Maintenance Program Bridge Division Continuously Reinforced Concrete Pavement department of transportation Federal Emergency Management Agency Federal Highway Administration functionally obsolete Geospatial Roadway Inventory Database Highway Bridge Program heavy rehabilitation Interstate Highways International Roughness Index Life Cycle Planning light rehabilitation Maintenance Operations Moving Ahead for Progress in the 21st Century Act metropolitan planning organization medium rehabilitation National Bridge Inventory National Bridge Inspection Standards National Highway System National Oceanic and Atmospheric Administration Non-Interstate Highways Pavement Analyst preventive maintenance structurally deficient State Highway Fund Statewide Long Range Transportation Plan Subject matter expert state-of-good-repair sufficiency rating Statewide Transportation Improvement Program Transportation Asset Management Plan Texas Transportation Plan Texas Department of Transportation Unified Transportation Program 9
10
11 Executive Summary Transportation Asset Management TxDOT has constructed, maintains, and inspects the largest state network of pavements, bridges, and other assets in the country. In that service, TxDOT is responsible for, among other things, ensuring the safety of the traveling public as well as the long-term operation of those assets. The latter of these two is often achieved through Asset Management. Transportation asset management can be summarized as the usage of data to make informed decisions which, when implemented, sustain a desired level of network performance. In its agency goals and objectives, TxDOT outlines a number of priorities that coincide with the goals of transportation asset management: Deliver the Right Projects, Foster Stewardship, Optimize System Performance, and Preserve our Assets. In pursuit of these goals and in accordance with federal requirements, TxDOT will continue to advance its use of transportation asset management. This document serves as TxDOT s initial Transportation Asset Management Plan (TAMP). Federal Requirements & Guidelines Through recent transportation funding bills (MAP-21 and the FAST Act), federal law requires each state to develop and implement a Risk Based Asset Management Plan for the National Highway System (NHS) to improve or preserve the condition and performance of the system. Promulgating this requirement into federal regulations, the Federal Highway Administration (FHWA) has provided states with requirements for TAMP development and implementation. At the core of this framework are Life Cycle Planning, Risk Management, Financial Planning, and Investment Strategies. Failure to comply with these regulations results in significant funding penalties. FHWA has also adopted new performance measures for pavements and bridges. (3) Some of these performance measures cannot be directly correlated with TxDOT s historic pavement and bridge performance measures. This gap, however, will close with time. TxDOT s initial TAMP will be used by FHWA to certify TxDOT s transportation asset management processes. For that reason, TxDOT has made use of federal requirements as the basis for its initial TAMP development. Texas Transportation Assets The scope of TxDOT s initial TAMP consists of pavements and bridges that correspond to travel ways either on the NHS or on the State Highway System ( On System ). Pavements and bridges corresponding to travel ways neither on the NHS nor On System are excluded. 11
12 The NHS and On System inventory contains nearly 200,000 lane-miles of pavements and nearly 37,000 bridges. Pavement conditions are quantified using TxDOT s Distress, Ride, and Overall Condition performance indicators as well as FHWA s percent Good, Fair, and Poor performance measures. More than 83% of On System pavements have an Overall Condition of Good or Very Good ; only about 5% have an Overall Condition of Poor or Very Poor. Applying federal performance measures to the NHS, 49.5% of pavements are in Good condition and 11.1% are in Poor condition. Bridge conditions are evaluated via routine visual inspections that follow national specifications, standards, and TxDOT policy. TxDOT and FHWA use data obtained from these inspections to calculate network performance measures and assess the health of Texas bridge inventory. Applying FHWA performance measures to the NHS, 50.8% of bridge deck area is in Good condition, while 0.8% is in Poor condition. Life Cycle Planning Life Cycle Planning (LCP) is defined by FHWA as a process to estimate the cost of managing an asset class, or asset sub-group over its whole life with consideration for minimizing cost while preserving or improving the condition. LCP is a process that can be used to 1) forecast network-level funding needs to sustain performance of the inventory, and 2) recommend the most cost-effective project for a given asset to optimize long-term condition. TxDOT utilizes Pavement Analyst software for retaining pavement condition data and life cycle planning analysis. The 2018 Unified Transportation Plan (UTP) funding levels are used as the baseline for the LCP analysis in TxDOT s initial TAMP. This planned funding level ($17.74 billion) is expected to sustain pavement conditions over the next ten years with a slight increase in percent Good or Very Good. Reductions in funding or the use of worstfirst investment strategies would cause a decline in network conditions. TxDOT is currently advancing its bridge management system to include life cycle planning capabilities. In lieu of a formal LCP analysis for TxDOT s initial TAMP, historic data sets are examined to predict short-term performance measure trends. These trends are used by TxDOT in developing targets for federal performance measures. Risk Management Risk management is the process and framework through which TxDOT manages uncertainty related to system performance. Based on previous experience with natural weather events, it is widely accepted that flooding poses one of the greatest risks to Texas pavements and bridges. A geospatial analysis of TxDOT s pavement and bridge inventory using flood maps is performed to estimate the quantity of assets vulnerable to these events. By engaging 12
13 stakeholders across Divisions and Districts, TxDOT has identified and prioritized additional risks, and developed preliminary management strategies for high-priority risks. Financial Plan and Investment Strategies Investment levels for pavement and bridge management are estimated through Fiscal Year 2027 in concurrence with TxDOT s 2018 UTP. A forecast of funding sources and revenue totals over this time period is also used to estimate additional funding through sources outside of the State Highway Fund. According to current cost replacement valuation methods, the value of NHS system pavement assets is $47 billion, and the estimated replacement value of NHS bridges is $43 billion. Key Findings and Planned Enhancements TxDOT has been able to maintain our assets in a condition above the national average due to successful funding programs. As our network of pavements and bridges continues to grow and our existing infrastructure ages, advanced programming becomes more critical. TxDOT s performance on federal measures as well as current workflows, largely satisfy the federal requirements. Further, the federal requirements are not anticipated to significantly alter TxDOT projects or procedures. Instead, TxDOT plans to leverage these requirements to help enhance cost-effective project selection and prioritization. In the initial TAMP, a gap analysis highlights financial and technical gaps which TxDOT plans to minimize through progressive implementation of transportation asset management practices. Future enhancements include increased transparency and communication with non-txdot stakeholders, improved accuracy of funding forecasts, adoption of life cycle planning into TxDOT s bridge management system, and continued development of risk management practices. 13
14 References 1 Moving Ahead for Progress in the 21st Century Act (MAP-21). Pub. L Stat July Asset Management Plans and Periodic Evaluations of Facilities Repeatedly Requiring Repair and Reconstruction Due to emergency Events, 23 CFR Parts 515 and 667, Department of Transportation, Federal Highway Administration, Federal Register, Vol. 81, No. 205, October 24, 2016, pages National Performance Management Measures; Assessing Pavement Condition for the National Highway Performance Program and Bridge Condition for the National Highway Performance Program, 23 CFR Part 490, Department of Transportation, Federal Highway Administration, Federal Register, Vol. 82, No. 11, January 18, 2017, pages
15 Chapter 1: Introduction and Background Overview Transportation asset management has been defined by the Federal Highway Administration (FHWA) as a strategic and systematic process of operating, maintaining, and improving physical assets with a focus on engineering and economic analysis based upon quality information to identify a structured sequence of maintenance, preservation, repair, rehabilitation, and replacement section that will achieve and sustain a desired state of good repair over the life cycle of the assets at minimum practicable cost (Error! Bookmark not defined., Error! Bookmark not defined., Error! Bookmark not defined.). FHWA enabling legislation in Moving Ahead for Progress in the 21st Century Act (MAP-21) (Error! Bookmark not defined.) and Fixing America s Surface Transportation Act (Error! Bookmark not defined.) indicates the following: States will develop and implement a Risk Based Asset Management Plan for the National Highway System (NHS) to improve or preserve the condition and performance of the NHS. FHWA will establish minimum standards for states to use in developing and operating bridge and pavement management systems. States will conduct periodic evaluations to determine if reasonable alternatives exist to roads, highway, or bridges that repeatedly require repair and reconstruction activities. Additional responsibilities of the states and FHWA are defined in 23 CFR 515 and 23 CFR 667 among other regulations (Error! Bookmark not defined.). These regulations require states to develop a Transportation Asset Management Plan (TAMP). This document is the initial Texas TAMP required by this legislation and described by a number of referenced FHWA documents (1). The Texas TAMP is governed by the Texas Department of Transportation (TxDOT) Administration and implemented by a steering committee with members from the Administration, Divisions (Bridge, Construction, Financial Management, Maintenance, Transportation Planning and Programming), and district representatives (Figure 1). A working group with membership from the Bridge and Maintenance Divisions is responsible for information gathering and report preparation. Sub-working groups have been formed to develop information and prepare documents for each of the major chapters of the document. The Bridge Division is responsible for all information and reporting on bridges while the Maintenance Division is responsible for all pavement information and reporting, and providing the overall support for the development of the TAMP. 15

16 Figure 1. Texas TAMP Implementation. Texas Highways Serving a Growing Economy and Population Texas has the second largest state economy in the nation. If Texas was a nation, it would be the 10th largest economy in the world with a gross state product of $1.6 trillion in the year Six of the largest 50 Fortune 500 companies are headquartered in Texas. In addition, 54 of the 500 largest corporations as defined by Fortune are headquartered in Texas (2). In 2016, Texas moved more than 2 billion tons of freight. More than half of the freight were moved by trucks on the state s highways. Freight movement is expected to double by 2045 (Figure 2) (Error! Bookmark not defined.). 16
.")
17 Figure 2. Texas Economy. Texas is the second most populous state in the nation with about 28 million people in With continued urbanization, the state s population is expected to grow by 45 percent to 39 million by 2045 (Error! Bookmark not defined.). The population has grown more than 50 percent over the last 25 years. During the same period, daily vehicle miles traveled have increased 70 percent and daily truck miles traveled have increased 110 percent on TxDOT maintained roadways, while roadway centerline miles have increased only 7 percent (Figure 3, Figure 4) (Error! Bookmark not defined.). 17

18 Figure 3. Texas Highway System and Historical Growth Trends (Error! Bookmark not defined.). It is important that the state continue to develop and maintain its system of highways to support the population, vehicle, and freight movement demand on its highways. Highways that are not maintained in a state-of-good-repair (SOGR) will increase transportation costs for people and goods. With increased congestion, the cost of travel and goods will increase as well. It is estimated that the trucking industry in Texas incurred 5.1 billion in congestion costs in 2016 (Error! Bookmark not defined.). 18
19 Figure 4. Changes in Texas Demographics and Transportation System. TxDOT Transportation System TxDOT maintains and operates approximately 73,410 centerline miles of pavements (or approximately 193,956 lane-miles of roads), which carry over 550 million vehicles miles annually. The state highway system encompasses more than 35,000 bridges and about 450 million sq. ft. of bridge deck area. Deck area is estimated as the sum of all bridge s span length multiplied by their width (Figure 5). TxDOT uses three different classifications of roadway miles: centerline miles, lane-miles, and roadbed miles: Centerline mile: A measure of length (in miles) of a highway along the centerline of the roadway. Lane-mile: A measure of the length of individual lanes on a highway in miles. A lanemile is a centerline mile multiplied by the number of lanes. Roadbed mile: The same as a centerline-mile except on a divided highway where each direction of traffic is carried on a separate road structure. 19
.")
20 Figure 5. Texas Roadways Today. NHS System NHS in Texas is designated by the U.S. Congress, through FHWA, in concert with TxDOT and other local governmental agencies. Figure 6 shows a map of NHS in Texas (Error! Bookmark not defined.). NHS includes Interstate Highways (IH) and non-interstate Highways (non-ih) (other principal arterials, and intermodal connectors) that are important to the national economy, defense, and mobility. The U.S. Department of Transportation in cooperation with state, regional, and local officials developed the NHS. MAP-21 expanded the system to include additional principal arterials, including those maintained by cities and counties. In addition, some highways owned, maintained, and operated by toll authorities and public/private partnerships are included in the NHS system. Thus, TxDOT is responsible for the design, construction, maintenance, and operation for the majority of the NHS. The information contained in this document is reported in categories if existing databases are inclusive and allow this segmentation. The terms on-system and off-system are used to define groups of data, NHS, and Non-NHS. These terms are defined as: 20

21 NHS all highways designed as on the NHS and include both IH and non-ih. Note that 91 percent of these highways are owned, maintained, and operated by TxDOT, and the remaining portion is owned by other entities including cities, counties, toll road authorities, and public/private partnerships, etc. Non-NHS all highways not designated as on the NHS. On-System all highways owned, maintained, and operated by TxDOT. Off-System all highways not owned, maintained, and operated by TxDOT. Of the 66,414 NHS lane-miles of pavements in Texas, 60,119 lane-miles are on the TxDOT system (referred to here as on-system) and 7,471 lane-miles are maintained and operated by cities, counties, and toll authorities (referred to here as off-system). The number of NHS bridges in Texas exceeds 17,000, with total bridge deck area near 340 million sq. ft. TxDOT maintains and operates more than 16,400 NHS bridges (320 million sq. ft. of bridge deck area) while other governmental agencies and private/partnerships maintain and operate around 1,000 NHS bridges (about 19 million sq. ft.). Figure 6. NHS in Texas. 21
22 Pavement and Bridge Asset Management Practices in Texas Pavement management systems in TxDOT have evolved from a basic Pavement Evaluation System in 1970 to a fully comprehensive Pavement Management System in the early The methods for measuring the condition of pavements and predicting future performance have also changed. The most recent change was initiated in 2016 with the implementation of a modern pavement management system and collections of semi-automated distress information. Bridge management systems have been operational in Texas for nearly two decades. The methods of evaluation and management have changed over the years. Methods to measure the condition of assets and the performance of the assets have changed and will continue to change in the future due to advancements in technology and development of new knowledge. However, historical data are valuable to obtain performance trends and develop predictive capabilities. This Document TAMP federal regulations (Error! Bookmark not defined.) require that a document be prepared by the states that meets the following minimum requirements: Description of NHS pavement and bridge assets inventory. Statement of the asset management objective and performance measures. Performance gap identification. Life cycle planning (LCP). Risk management analysis. Financial plan for a minimum of 10 years. Investment strategies. This document describes the processes that are used or will be used for pavement and bridge management. For more information on additional initiatives, readers are advised to review TxDOT publications titled Project Selection Process (3) and Project Development Process Manual (4). 22
23 Chapter 2: Asset Management Objectives Overview TxDOT views asset management as an important highway infrastructure management framework to improve and preserve the condition of assets and system performance. As identified previously, 23 CFR 515 of Federal Regulations (Error! Bookmark not defined.) describes the requirement for an asset management plan that satisfies FHWA requirements. These federal requirements are discussed in more detail in Chapters 3 to 8 of this document. The general federal requirements for asset management are compatible with TxDOT s asset management priorities. However, details associated with TxDOT s current asset management processes are not identical to the requirements defined by FHWA. These differences will be identified in other parts of this document. TxDOT s values, vision, mission, and goals are discussed below to illustrate the compatibility between federal requirement and the state s guiding documents. TxDOT Priorities TxDOT operates under the guidance of a commission appointed by the governor of Texas. The commission has adopted rules requiring performance measurement and reporting, including the condition of bridges and pavements (Error! Bookmark not defined.). The commission has also adopted seven goals for the agency, with specific objectives for each goal. These goals are (Error! Bookmark not defined.): 1. Deliver the right projects. 2. Focus on the customer. 3. Foster stewardship. 4. Optimize system performance. 5. Preserve our assets. 6. Promote safety. 7. Value our employees. While all of these goals deal with one or more elements of asset management, perhaps the most directly related one is Strategic Goal 5: Preserve our Assets: Deliver preventive maintenance for TxDOT s system and capital assets to protect our investments. Maintain and preserve system infrastructure to achieve a SOGR and avoid asset deterioration. Procure, secure, and maintain equipment, technology, and buildings to achieve a SOGR and prolong life cycle and utilization (Error! Bookmark not defined.). 23
24 Several other goals (Deliver the Right Projects, Foster Stewardship, Optimize System Performance) also speak to the role of asset management in the provision of mobility. TxDOT further believes that preserving assets supports its five statewide objectives/traits, which state that the agency shall be (Error! Bookmark not defined.): 1. Accountable to tax and fee payers of Texas. 2. Efficient such that maximum results are produced with a minimum waste of taxpayer funds, including through the elimination of redundant and non-core functions. 3. Effective in successfully fulfilling core functions, measuring success in advancing performance measures, and implementing plans to continuously improve these efforts. 4. Providing excellent customer service. 5. Transparent such that the agency can be understood by any Texan. The Texas legislature, through Senate Bill 20, directed TxDOT to adopt a performance driven project selection process. This process has generated a number of performance targets internal to TxDOT that coincide with the National Performance Goals and the federal TAMP requirements. More emphasis is being placed at all levels to have projects that contribute more effectively and efficiently to the maintenance or increase of the system performance. Asset Management as Expressed in TxDOT s Planning Documents TxDOT s planning and programing activities are guided by four key documents (Figure 7): Texas Transportation Plan (TTP) 2040, Statewide Long Range Transportation Plan (SLRTP) 2035, Unified Transportation Program (UTP), and Statewide Transportation Improvement Program (STIP). These documents are described briefly as follows. TTP 2040 The Texas Transportation Commission adopted the TTP 2040 to serve as TxDOT s longrange, performance-based transportation plan (Error! Bookmark not defined.). The TTP 2040 guides planning and programming decisions for the development, management, and operation of the statewide, multimodal transportation system in Texas over 25 years ( ). The TTP 2040 addresses the statewide planning requirements under the current federal surface transportation act, MAP-21, and Title 43, Texas Administrative Code, Chapter 16. SLRTP 2035 The SLRTP is the 24-year blueprint for the planning process that will guide the collaborative efforts between the department, local and regional decision-makers, and all transportation stakeholders to reach a consensus on needed transportation projects and services (Error! Bookmark not defined.). 24
25 UTP The UTP is a catalog of projects that are planned to be constructed and/or developed within the next 10 years (Error! Bookmark not defined.). STIP The STIP provides a listing and detail of projects to be let over the next four years. The current version is for the years (Error! Bookmark not defined.). Figure 7 shows a diagram of how each planning document relates to others in the planning process. Figure 7. TxDOT s Transportation Planning and Programming Documents. 25
26
27 Chapter 3: Asset Inventory, Performance Measures, and Condition Overview Asset inventory and condition are key information that feed into transportation asset management systems and the establishment of transportation planning and programming documents (Error! Bookmark not defined.). Key elements of an asset management plan such as LCP, financial plans and investment strategies, and risk analyses are all dependent on the asset inventory, condition, and performance information. Inventory information allows TxDOT to communicate the type and locations of assets; and condition information allows for measuring the current performance of the assets. Condition measurements are taken on individual assets and converted into condition indicators. This information is communicated in various forms to national, state, and local governments, while also providing the general public with valuable information. FHWA requirements for network segmentation, asset condition evaluation, and performance measurements are not the same as those used by many states. Texas is not an exception to this statement. Differences between FHWA and TxDOT criteria will be identified, and when data are available, they will be presented in both formats. The Texas highway transportation systems include assets owned and operated by a number of federal agencies, state agencies, tribal governments, cities, counties, toll authorities, and public/private partnerships. Highways on the NHS system are mostly owned, maintained, and operated by TxDOT; however, a portion of the NHS system is under the jurisdiction of cities, counties, and toll authorities. Assets identified in this document will be those on the NHS and the TxDOT system. Highways on the TxDOT system are owned, maintained, and operated by TxDOT. Texas TAMP Assets FHWA requires the TAMP to include a summary listing of the inventory and condition of the NHS designated pavement and bridge assets in that state. TxDOT has elected to report the pavement and bridge assets and their condition for the NHS and those on the state highway system. The Texas TAMP will report all pavements and bridges on the NHS and all pavements and bridges owned, maintained, and operated by TxDOT. Pavements and bridges have the highest value and annually expended dollars among all assets. In Texas, asset management practices have historically been observed for pavements and bridges and the data sets are more robust and therefore meaningful. 27
28 Inventory Pavement Inventory TxDOT maintains a current inventory of roadways through its internal Geospatial Roadway Inventory Database (GRID) (5). GRID contains information related to the extent, administrative designations, and physical characteristics of all state-owned highways at the roadbed level. This system documents the TxDOT-maintained on-system highway and roadway network. The TxDOT GRID database contains the following information: Mileage for every segment of the highway network. All secondary designations of any roadway segment. District responsibilities for any roadway segment. Highway segments that are part of the NHS. Highway segments that are part of the Texas Turnpike System. Physical properties of each highway and roadbed, including number of lanes, surface width, and traffic data. TxDOT maintains and operates approximately 73,410 centerline miles or approximately 193,956 lane-miles of roads, which carry over 550 million vehicle miles annually. NHS inventory and condition information is reported on an annual basis to both FHWA and in the state of Texas on a lane-mile basis, and this is the inventory unit that will be used in this document. For informational purposes, the current TxDOT on-system inventory is as follows: 73,410 centerline miles (This number was calculated based on mainlanes only not including frontage roads). 81,642 roadbed miles. 193,956 lane-miles. Table 1 and Figure 8 show TxDOT on-system pavement inventory information. TxDOT owns, maintains, and operates this system. The TxDOT on-system comprises around 193,956 lanemiles of which about 30 percent is on the NHS system and 70 percent is on the non-nhs system. Texas is one of a few states that has a relatively large portion of on-system pavements that are not on the NHS. Table 1. TxDOT On-System Pavement Inventory-Lane Miles. NHS-IH NHS-Non-IH Non-NHS Total Lane Miles 16,177 43, , ,956 Percent

29 Figure 8. TxDOT On-System Pavement Inventory-Lane Miles. Table 2 and Figure 9 show roadway or pavement mileage for the NHS in Texas. TxDOT NHS on-system mileage totals 60,119 lane-miles. Off-system pavement mileage for the NHS in Texas is 7,471. Thus, about 9.5 percent of the NHS is owned, maintained, and operated by non-txdot entities including cities, counties, and toll authorities. Table 3 shows the lane miles of pavements owned and operated by TxDOT entities. Table 2. Texas On-System and Off-System NHS Pavement Inventory-Lane Miles. Lane Miles IH On-System Total Non-IH On- System Off-System Non-IH Total NHS Highways 16,177 43,942 60,119 7,471 67,590* Percent *This number was calculated excluding bridge miles on NHS. 29

30 Figure 9. Texas On-System and Off-System NHS Pavement Inventory-Lane Miles. Table 3. Off-System NHS Ownership. Owner Lane Miles Cities 5,731 Counties 338 Toll Road Authorities 1,402 Total 7,471 Since pavement condition indicators for the federal requirements differ for various types of pavements, it is useful to inventory pavement lane-miles by pavement type. There are three broad pavement types commonly used in Texas, which include asphalt concrete pavement (ACP), continuously reinforced concrete pavement (CRCP), and jointed concrete pavement (JCP). Jointed concrete includes both reinforced and non-reinforced concrete pavements. Table 4 provides a listing of the NHS lane miles for the different pavement types. Table 4. Lane Miles and Percentiles for the Different Pavement Types. Pavement Type Lane Miles Percentage of Lane Miles On System Off System Total On System Off System Total ACP 47,656 7,461 55, % 99.88% 81.55% CRCP 9, , % 0.00% 14.18% JCP 2, , % 0.12% 4.27% Total 60,119 7,471 67, % % % 30
31 Bridges Texas has over 54,000 bridges in the state with about 35,000 owned and maintained by TxDOT. Table 5 shows the breakdown of on-system bridge inventory, and Table 6 shows the breakdown of NHS bridge inventory. Bridges are classified as structures having an end-toend distance of 20 ft or greater. For this plan, bridges are defined as highway structures longer than 20 ft in clear span length open to public vehicular traffic. Bridges are comprised of the following primary components: Deck The part of the bridge supporting traffic (including the riding surface). Superstructure The part of the bridge that supports the deck (often composed of beams or girders). Substructure The part of the bridge that supports the superstructure (columns, foundation elements, pier caps, etc.). Culvert Culverts are drainage structures that, if 20 ft in width or wider along the direction of the roadway, are considered bridges. These structures are often considered as one integrated component. Bridge data have been collected on the state s bridge inventory for decades. Defined in the National Bridge Inspection Standards (NBIS) (6, 7), the National Bridge Inventory (NBI) (8) is the aggregation of structure inventory and appraisal data collected to fulfill the requirements of the National Bridge Inspection Standards. In accordance with federal policy, Each State shall prepare and maintain an inventory of all bridges subject to the NBIS. TxDOT oversees the inspection of all Texas bridges open to public traffic to ensure that these requirements are met. Table 5. TxDOT On-System Bridge Inventory. Condition Group On-System NHS IH Bridges On-System NHS Non-IH Bridges On-System Non-NHS Total On- System Bridges Count of Bridges 4,663 (13.1%) 11,813 (33.2%) 19,117 (53.7%) 35,593 (100%) Deck Area (million sq. ft.) 87.0 (19.3%) (52.4%) (28.3%) (100%) 31
32 Table 6. Texas On-System and Off-System NHS Bridge Inventory. Condition Group On-System NHS, IH Bridges On-System NHS, Non-IH Bridges Off-System NHS Non-IH Bridges Total NHS Bridges Count of Bridges 4,663 (26.7%) 11,813 (67.5%) 1,015 (5.8%) 17,491 (100%) Deck Area (million sq. ft.) 87.0 (25.4%) (69.0%) 19.4 (5.7%) (100%) Condition Measurement TxDOT has long established methods to determine the condition of its pavements and bridges. Since the 1970s, TxDOT s pavement evaluation methods have evolved from a visual evaluation methods conducted by a team of raters to the current semi-automated system using 3-D technology and other automated equipment. For pavement, the interpretation of these data by TxDOT and FHWA to determine pavement condition vary. For bridges, TxDOT s condition measurement system has followed the NBIS for a number of years. The measurement methods used to determine pavement and bridge condition and performance are presented below (8). Pavements Historically TxDOT has used a visual condition survey to determine the condition of pavements (9, 10). The visual condition surveys have been performed under contract by a consultant. The visual condition surveys were performed on approximately 0.5-mile segments of roadway on all TxDOT on-system pavements and on samples for the NHS off-system pavements (owned, maintained, and operated by cities, counties, and toll authorities) on an annual basis. In 2016, TxDOT began using an automated/semi-automated method for obtaining pavement condition information. A van mounted 3-D camera and a line laser is used to capture continuous images of the pavement. The images are used to determine the type and extent of pavement surface distress as defined in reference (9). The information is captured and reported in 0.1-mile increments. This transition of condition measurement systems was implemented to modernize TxDOT s pavement management practices and to meet the new federal requirements. The data are summarized on 0.5-mile roadway segments for TxDOT reporting and 0.1-mile segments for FHWA reporting. The pavement condition data for the off system NHS are now collected for 100 percent of the roadbeds as a part of TxDOT statewide contract for automated/semi-automated pavement data collection. 32
33 Automated data collection is also used to determine rutting, ride quality, and faulting as briefly described below: Rutting: Automated pavement data collection equipment is used to establish transverse profiles for estimating rut depth and percentage of rutting levels for five rut categories in each wheel-path. Ride Quality: Certified Inertial Profilers are used in the data collection process to establish longitudinal surface profiles for computing the International Roughness Index (IRI), and the ride score. Faulting: Automated data collection equipment collects the faulting measurement on the JCP. The semi-automated method to determine pavement condition is subject to a quality control procedure that uses TxDOT and TTI personnel to visually evaluate about 6 percent of the pavement sections. In addition, all measurement equipment is calibrated on a regular schedule. Pavement condition surveys are now performed on a 0.1-mile increment to satisfy the FHWA requirements. Distress types and extent vary by pavement type. ACPs are evaluated for the presence of rutting, patching, failures, block cracking, alligator cracking, longitudinal cracking, transverse cracking, and total cracking percent. CRCPs are evaluated for the presence of spalled cracks, punch-outs, asphalt patches, concrete patches, and total crack percent. JCPs are evaluated for the presence of failed joints and cracks, failures, shattered slabs, slabs with longitudinal cracks, concrete patches, and total crack percent. TxDOT Performance Indicators TxDOT uses the measures described above to determine the condition of their pavements. These data are used to determine three measures of pavement conditions as shown below: Distress Score. Ride Score. Condition Score. The Distress Score represents the surface condition of the pavement in terms of type and extent of the different types of distress. The score ranges from 1 to 100 with 100 representing a pavement without distress (9). A Ride Score is determined from data collected by Inertial Profilers, which converts a pavement profile (roughness/smoothness) to an IRI. The IRI is converted to a Ride Score based on the Serviceability Index developed at the American Association of State Highway and Transportation Officials (AASHTO) Road Test. The Condition Score is a combination of the Distress Score and Ride Score and represents the overall condition of the pavement. Condition Scores range from 1 to 100 with 100 being 33
34 the best condition. TxDOT reports the condition of its pavements on an annual basis using these scores (11). Table 7 provides a conversion from the Distress Score, Ride Score, and Condition Score to a Descriptive Term used by TxDOT to communicate the condition of pavements from a surface distress standpoint. Table 7. Distress, Ride, and Condition Score by TxDOT Descriptive Class. Descriptive Class Distress Score Ride Score Condition Score Very Good Good Fair Poor Very Poor FHWA Methods United States Code, Title 23, Sections 119, 144 and 150 (1) and 23 CFR 515 (Error! Bookmark not defined.) provide general guides for states to use in developing and operating pavement and bridge management systems. These rules describe a process different than historically used by TxDOT. FHWA indicates that the condition of pavements on the NHS is to be reported for both IH and non-ih. All IH are on the TxDOT system (on-system) while NHS non-ih are both on-system and off-system. Condition surveys are at 0.1-mile increments. FHWA Performance Indicators NHS Interstate System (on-system) pavements are evaluated based on ride quality and pavement surface distress. Table 8 shows criteria for pavements designated as being in good, fair, or poor condition. A pavement section (0.1-mile in length) is classified as good condition if all of the metrics shown on Table 8 are good. The rating of a section will be poor if two or more metrics are evaluated as poor. All other pavement sections are given a fair evaluation. NHS non-ih (both on-system and off-system) use ride quality only for evaluation. The criteria for ride quality is the same for NHS IH and non-ih (Table 8). 34
35 Table 8. Federal Requirements for Pavement Condition Thresholds. Condition Threshold Metric Good Fair Poor IRI (inches/mile) (all pavement types) Cracking (%) < >170 ACP < >20 JCP < >15 CRCP < >10 Rutting (inches) (ACP) < >0.40 Faulting (inches) (JCP) < >0.15 Bridges Inspection and Condition Rating Methods All bridges in Texas are subject to standardized and regularly scheduled inspections. The inspections are conducted according to the TxDOT Bridge Inspection Manual and the NBIS (8, 12, 13). Bridge inspections serve two primary purposes: 1) to ensure the safety of the public and 2) to catalog accurate data reflecting each bridge s physical attributes and current condition. Bridge inventory and condition data are collected through the following inspection types: 1. Initial Inspection Performed on new bridges or when the bridge is first recorded in the inventory. 2. Routine Inspections Performed on all bridges according to a regular schedule (also referred to as routine safety inspections ). These are the most common form of bridge inspection and typically occur on a 24-month inspection frequency. 3. Event Driven Inspections Performed in response to an incident that might threaten bridge stability (i.e., collision, fire, flood, significant environmental changes, loss of support). These inspections are sometimes called Emergency Inspections and are performed on an as-needed basis. 4. In-Depth Inspections Performed typically as follow-up inspections to better identify deficiencies found in any of the above three types of inspection. Detailed Underwater Inspections and Fracture Critical Inspections are both considered a type of In-Depth Inspection; although these two inspection types are not necessarily performed as a follow-up to previous inspection findings. 35
36 5. Special Inspections Performed to monitor a particular feature, deficiency, or changing condition. Unusual bridge features (such as external, grouted, or posttensioned tendons) may compel TxDOT to pursue a Special Inspection. 6. Condition Assessment Surveys/Damage Assessment Surveys- Performed to evaluate, to a heightened level of detail, the features and defects that should be addressed by future work. These inspections are typically conducted in preparation for a bridge repair, rehabilitation, or replacement project. In Texas, bridge inspection policies have remained relatively constant over the past several decades. This stability has produced a rich set of historic data a tremendous benefit to asset management efforts. Of the many data items collected through bridge inspections, the following are most relevant to the Asset Management Plan: Facility carried by the bridge. Feature crossed by the bridge. Bridge location (TxDOT district, county, latitude and longitude, etc.). Length and width of the bridge. Which entities own and maintain the bridge. Deck condition (on a 1 9 scale with 9 being best). Superstructure condition (on a 0 9 scale). Substructure condition (on a 0 9 scale). Culvert condition (on a 0 9 scale, if the bridge is a bridge-class culvert). Channel condition (on a 0 9 scale, if the bridge crosses a water feature). Element conditions (quantity in conditions states 1, 2, 3, and 4 for each bridge element). While the first 10 of these have been collected consistently for decades, only recently have element condition data been considered for asset management in Texas. Furthermore, bridge element specifications have recently changed from AASHTO Commonly Recognized elements to AASHTO National Bridge Elements, making it problematic to rely on past data to forecast future trends. Because of those reasons, this asset management plan will focus on bridge conditions on a component-level only. Bridge component condition scores fall within a 0 9 numeric scale (Table 9). Technical definitions and additional details on each inspection item are available in TxDOT s Coding Guide (14). 36
37 Table 9. Bridge Component Condition Rating. Condition Value Description 9 Excellent Condition. 8 Very Good Condition no problems noted. 7 Good Condition some minor problems. 6 Satisfactory Condition structural elements show some minor deterioration. 5 Fair Condition all primary structural elements are sound but may have minor section loss, cracking, spalling, or scour. 4 Poor Condition advanced section loss, deterioration, spalling, or scour. 3 Serious Condition loss of section, deterioration, spalling or scour have seriously affected primary structural components. Local failures are possible. Fatigue cracks in steel or shear cracks in concrete may be present. 2 Critical Condition advanced deterioration of primary structural elements. Fatigue cracks in steel or shear cracks in concrete may be present or scour may have removed substructure support. Unless closely monitored it may be necessary to close the bridge until corrective action is taken. 1 Imminent Failure Condition major deterioration or section loss present in critical structural components or obvious vertical or horizontal movement affecting structure stability. Bridge is closed to traffic but corrective action may put back in light service. 0 Failed Condition out-of-service beyond corrective action. N Not Applicable. In accordance with NBIS, TxDOT annually reports statewide bridge inspection data to FHWA in support of the NBI. FHWA regulations require NBI reporting be done in a standardized fashion, specified by the Recording and Coding Guide for the Structure Inventory and Appraisal of the Nations Bridges (6). NBI data are compiled by FHWA and made available to the public (15). Additionally, a summary of network-level bridge information is published on TxDOT s website yearly (16). Each Report on Texas Bridges contains bridge conditions and funding information on a biennial basis. Bridge conditions are typically discussed as a function of all primary bridge components. For span-type bridges, this includes deck, superstructure, and substructure. For bridge-class 37
38 culverts, only the culvert condition rating is considered. Based on the minimum condition rating for each of its primary components, a bridge is assigned an overall condition score. Table 10 shows a bridge is classified as good, fair, or poor based on the criteria. Table 10. Bridge Condition Groups. Most Severe Component Rating Condition Group 7 or greater Good 5 or 6 Fair 4 or less Poor TxDOT Performance Indicators TxDOT and FHWA both use numerous performance measures for assessing the health of Texas bridge network. Network-level performance evaluations in Texas are typically executed by TxDOT s Bridge Division and are used to communicate with several key stakeholders including FHWA, state policymakers, the Texas Transportation Commission, TxDOT s Administration, TxDOT Districts, and the public. Network performance assessments are generally scoped to include Texas statewide inventory (on- and off-system bridges, NHS, and non-nhs). Prior to 2017, TxDOT s primary network performance measure was the statewide percent of good or better bridges. This measure had been used for several years as the principal decision-making aid to evaluate funding alternatives on a planning scale. A good or better bridge is one that is not classified as structurally deficient (SD), functionally obsolete (FO), or substandard for load only. The good or better bridges performance measure score is simply the percent of bridges (by count) classified as good or better. Historically, much of TxDOT s bridge funding has been directed toward improving this measure through replacing bridges not classified as good or better. Table 11 shows statewide totals of SD bridges for 2016 as compared to TxDOT has significantly lowered the percent of SD bridges from nearly 13 percent in 1992 to less than 2 percent in TxDOT has made substantial inroads at replacing or improving SD bridges. Reliance on bridge replacement projects has served TxDOT well. As TxDOT s bridge inventory continues to grow and more bridges approach the end of their service life, TxDOT is pivoting toward condition-based asset management. The transition to condition-based network performance measures is being furthered by FHWA. FHWA no longer classifies bridges as SD or FO. Bridges historically classified as SD are now referred to as poor per recent federal regulations, and the FO designation has been retired altogether by FHWA. 38
39 Table 11. SD Bridge Quantities, 1992 versus Year Total Inventory Number of Bridges SD* Percent of Total Inventory ,762 5, % , % *Historical classification; replaced by poor condition group Recently, the percent of good or better bridges has been replaced by a new measure based on condition criteria rather than service level. For TxDOT s Administration and the Texas Transportation Commission, the Bridge Division has developed a new bridge network performance measure, called the Bridge Condition Score. This new performance measure is intended to capture overall network health more directly than the percent of good or better bridges. However, the percent of good or better bridges is still reported annually to the Legislative Budget Board. The Bridge Condition Score is based on the most severe primary component condition rating. A composite score for the network is calculated as the average of each individual bridge s numeric score, weighted by deck area. Table 12 defines each condition group, their minimum component rating, and their corresponding numeric score. Table 12. TxDOT Bridge Condition Score Groups. Most Severe Component Rating Letter Grade Score Numeric Score 7 or greater A 95 6 B 85 5 C 75 3 or 4 D 65 2 or less F 50 This new measure has been used to forecast network performance and explore funding levels for the development of the 2018 UTP, primarily applied to the statewide bridge inventory. To best capture TxDOT s bridge management policies, the TAMP considers this composite bridge condition score for the total TAMP inventory NHS and Non-NHS, On- System bridges. By using this network performance measure to guide funding and asset management decisions, TxDOT is simultaneously supporting the federal performance measures (percent good deck area and percent poor deck area). 39
40 Although TxDOT s bridge management decisions are decentralized across a number of stakeholders, bridge network performance reporting is executed centrally by the Bridge Division. Performance reporting is used to inform five key stakeholders of network bridge performance: TxDOT s Administration, the Texas Transportation Commission, TxDOT districts, FHWA, and the public. Typically, network performance assessments are scoped to include Texas statewide bridge inventory. FHWA Performance Indicators FHWA, through recent regulations, has introduced performance measures to be evaluated for each state s NHS bridge inventory all bridges carrying NHS roadways. Similar to TxDOT s bridge condition score, FHWA s two federal performance measures are only a function of NBI ratings for primary bridge components: deck, superstructure, substructure, or culvert. Based on the most severe NBI component condition for each of these four items, a bridge is assigned an overall condition score. Dependent on its overall condition score, a bridge is classified as good, fair, or poor. Federal performance measures include 1) the percent of NHS bridge deck area in good condition, and 2) the percent of NHS bridge deck area in poor condition. 1 By inference, these measures can be used to calculate the share of NHS on bridges in fair condition. Alongside TxDOT s Bridge Condition Score measure, these two federal performance measures will be taken into consideration as condition-based bridge management strategies continue to be developed. Bridge and Pavement Current Condition TxDOT reports the performance data for pavements and bridges on an annual basis (11, 16). The reports present the historical condition of the pavements and bridges for the highway system and asset type. The pavement annual report also presents the maintenance level of service information. Pavements Condition of Pavements Based on TxDOT Indicators The condition of the NHS Interstate (on-system) and NHS non-interstate (on-system and offsystem) pavements are shown in Table 13 for the five performance score classes used by TxDOT. These data indicate that nearly 90 percent of the Interstate pavements on the NHS system are performing at a very good or good level with about 7 percent performing at the poor or very poor level. The non-ih NHS system for on-system has about 80 percent of their lane miles at a good or very good classification while about 10 percent are at a poor and very poor level. Typically, the IH pavements are expected to be at higher condition level CFR
41 Table 13. Pavement Condition based on TxDOT Performance Indicators. Measure Condition On-System Total Interstate Non-Interstate Distress %Very Good %Good %Fair %Poor %Very Poor Ride %Very Good Overall Condition %Good %Fair %Poor %Very Poor %Very Good %Good %Fair %Poor %Very Poor Table 14 to Table 16 show historic TxDOT on-system pavement performance with TxDOT measures of distress, ride, and overall condition. 41
42 Table 14. TxDOT On-System Historic Performance Based on Distress. Fiscal Year Percent of Very Good Lane Miles Percent of Good Lane Miles Percent of Fair Lane Miles Percent of Poor Lane Miles Percent of Very Poor Lane Miles Table 15. TxDOT On-System Historic Performance Based on Ride Quality. Fiscal Year Percent of Very Good Lane Miles Percent of Good Lane Miles Percent of Fair Lane Miles Percent of Poor Lane Miles Percent of Very Poor Lane Miles
43 Table 16. TxDOT On-System Historic Performance Based on Overall Condition. Fiscal Year Percent of Very Good Lane Miles Percent of Good Lane Miles Percent of Fair Lane Miles Percent of Poor Lane Miles Percent of Very Poor Lane Miles Condition of Pavements Based on FHWA Definition of Performance Table 17 and Figure 10 show the condition of the NHS pavements based on FHWA performance indicators. These data are reported on a lane mile basis. Data are available for on-system IH, on-system non-ih, and off-system non-ih. Data are aggregated as well. 43
 25,541 (58.13%) 860 (11.51%) 26,401 (51.35%) 33,430 (49.46%) Fair 9,126 (56.")
44 Table 17. FHWA Performance Indicators Texas On-System and Off-System NHS Pavement Condition-Lane Miles Basis-Percent. Condition On-System Off-System On-System & Off- System IH Non-IH Non-IH Non-IH Total NHS System Good 7,028 (43.45%) 25,541 (58.13%) 860 (11.51%) 26,401 (51.35%) 33,430 (49.46%) Fair 9,126 (56.41%) 15,073 (34.30%) 2,451 (32.81%) 17,525 (34.09%) 26,651 (39.43%) Poor 23 (0.14%) 3,327 (7.57%) 4,159 (55.68%) 7,486 (14.56%) 7,509 (11.11%) Total 16,177 43,942 7,471 51,412 67,590 (100%) Figure 10. FHWA Pavement Performance Indicators Texas On-System and Off- System NHS Lane Mile Basis. This data set indicates that when using the FHWA methods to determine pavement conditions, about 45 percent of the NHS IH pavement lane miles are considered in good condition and less than 1 percent are classified as poor condition. Non-IH NHS pavements (both Less than 1 percent of NHS IH lane miles are classified as poor condition. 44
45 on-system and off-system) have about 50 percent operating in the good classification and about 15 percent in the poor category. Bridges The condition of bridges reported in the document is based on the TxDOT methodology only. The condition of bridges according to FHWA methodology will require additional TxDOT effort. The maximum allowable NHS deck area in poor condition when determined by FHWA methodology is 10 percent according to FHWA regulations. Texas bridge condition falls well below this threshold as measured by the TxDOT methodology of determining bridge condition, with only about 1 percent of deck area classified as poor. There is no required minimum percent of NHS deck area in good condition. For both of these performance measures, FHWA requires that 1) TxDOT establish future targets, and 2) that TxDOT demonstrate progress toward achieving its targets. To best capture TxDOT s bridge management policies, the TAMP presents information that defines the percent good and poor for the NHS and Non-NHS, On-System bridges. Table 18 to Table 21 and Figure 11 to Figure 14 show the condition of bridges on the NHS system and on the TxDOT system (on-system). Table 18 (Figure 11) and Table 19 (Figure 12) show the information based on number of bridges for the NHS (Table 18) and the condition of the bridges on the TxDOT system (Table 19). Table 18 indicates that the NHS system has about 53 percent of its bridges in good condition with less than 1 percent in the poor condition. The TxDOT NHS on-system bridges are in slightly better condition than the off-system bridges. Table 19 shows the condition of the TxDOT system, which includes part of the NHS bridges. Fifty-three percent of TxDOT owned and operated bridges are in good condition while less than 1 percent are in poor condition. Only a small difference in performance classification level is noted between NHS and non-nhs bridges in the Texas system. Traditionally, TxDOT has not explicitly considered NHS designation when programming bridge preservation activities. 45
46 Table 18. Texas On-System and Off-System NHS Bridge Condition-Based on Number of Bridges. Condition Group On-System NHS, IH Bridges On-System NHS, Non-IH Bridges Off-System NHS Non-IH Bridges Total NHS Bridges Good 1,988* (42.6%) 6,811 (57.7%) 531 (52.3%) 9,330 (53.3%) Fair 2,645 (56.7%) 4,975 (42.1%) 481 (47.4%) 8,101 (46.3%) Poor 30 (0.6%) 27 (0.2%) 3 (0.3%) 60 (0.3%) Total 4,663 (100%) *Count of Bridges 11,813 (100%) 1,015 (100%) 17,491 (100%) Figure 11. Texas On-System and Off-System NHS Bridge Condition-Based on Number of Bridges. 46
47 Table 19. TxDOT On-System Bridge Condition-Based on No. of Bridges. Condition Group On-System NHS IH Bridges On-System NHS Non-IH Bridges On-System Non-NHS Total On-System Bridges Good 1,988* (42.6%) 6,811 (57.7%) 10,124 (53.0%) 18,923 (53.2%) Fair 2,645 (56.7%) 4,975 (42.1%) 8,878 (46.4%) 16,498 (46.3%) Poor 30 (0.6%) 27 (0.2%) 115 (0.6%) 172 (0.5%) Total 4,663 (100%) *Count of Bridges 11,813 (100%) 19,117 (100%) 35,593 (100%) Figure 12. TxDOT On-System Bridge Condition-Based on No. of Bridges. Table 20 (Figure 13) and Table 21 (Figure 14) show condition information based on bridge deck area for the NHS system (Table 20) and the TxDOT (on-system). About 50 percent of the NHS bridges are in good condition and less than 1 percent are in poor condition. Onsystem NHS bridges are performing at a somewhat higher level than off-system NHS bridges. 47

48 Table 21 shows the performance level based on bridge deck area for TxDOT system bridges. About 52 percent of TxDOT bridges are classified as in good condition while about 1 percent are in poor condition. Non-NHS bridges are performing at a somewhat higher level than NHS bridges (53 to 50 percent). Table 20. Texas On-System and Off-System NHS Bridge Condition-Based on Bridge Deck Area (Millions of sq. ft.). Condition Group On-System NHS IH Bridges On-System NHS Non-IH Bridges Off-System NHS Non-IH Bridges Total NHS Bridges Good 32.7 (37.6%) (55.8%) 9.6 (49.5%) (50.8%) Fair 52.3 (60.1%) (43.8%) 9.8 (50.5%) (48.3%) Poor 2.1 (2.4%) 0.8 (0.3%) 0.01 (0.0%) 2.9 (0.8%) Total 87.0 (100%) (100%) 19.4 (100%) (100%) Figure 13. Texas On-System and Off-System NHS Bridge Condition-Based on Bridge Deck Area (Millions of sq. ft.). 48
 131.8 (55.8%) 68.3 (53.4%) 232.7 (51.6%) Fair 52.3 (60.")
49 Table 21. TxDOT On-System Bridge Condition-Based on Bridge Deck Area (Millions of sq. ft.). Condition Group On-System NHS IH Bridges On-System NHS Non-IH Bridges On-System Non- NHS Bridges Total On-System Bridges Good 32.7 (37.6%) (55.8%) 68.3 (53.4%) (51.6%) Fair 52.3 (60.1%) (43.8%) 58.0 (45.4%) (47.4%) Poor 2.1 (2.4%) 0.8 (0.3%) 1.5 (1.1%) 4.4 (1.0%) Total 87.0 (100%) (100%) (100%) (100%) Figure 14. TxDOT On-System Bridge Condition-Based on Bridge Deck Area (Millions of sq. ft.). TxDOT is currently adopting a Memoranda of Understanding with metropolitan planning organizations (MPOs) and other parties; one component of these agreements is the sharing of inventory and condition data, which allows MPOs to establish performance targets. 49
50
51 Chapter 4: Life Cycle Planning Overview LCP is defined by FHWA (Error! Bookmark not defined.) as a process to estimate the cost of managing an asset class, or asset sub-group over its whole life with consideration for minimizing cost while preserving or improving the condition. LCP is a process that can be used to 1) identify performance gaps in the planning cycle and 2) determine the best life cycle scenarios to minimize any performance gaps between the current and desired SOGR. The objectives of LCP include the following: Establishing a long-term focus for improving and preserving the system. Estimating the condition that can be achieved with different alternative funding levels. Providing support for investment decisions with a thorough, data-driven analysis process. Reference (Error! Bookmark not defined.) provides an overview of LCP is provided and the methodology used by TxDOT. The life cycling planning implications performed with TxDOT s methodology and bridge condition historic trends for TxDOT on-system pavements is included. The LCP process does not include consideration for project duration and the associated user and non-user costs. LCP for Pavements LCP is conducted to maximize the performance of an asset over its lifetime through strategic and systematic planning of a well-planned reconstruction, rehabilitation, and maintenance strategy. Figure 15 shows an example of a typical life-cycle cost scenario of a highway without a preventive and routine maintenance strategy versus a scenario with a preventive and routine maintenance strategy (Error! Bookmark not defined.). 51

52 Figure 15. Typical Life Cycle Costs of a Highway (Error! Bookmark not defined.). Figure 16 shows an example of pavement conditions under three different strategies: reconstruction, rehabilitation, and maintenance. Through the process of LCP, alternative strategies such as those shown on Figure 16 can be compared to identify the lowest life cycle cost over a selected analysis period. 52
53 New Maintain Strategy Very Good Condition Good Fair Poor Rehab Strategy Very Poor Reconstruct Strategy Failed Years 30 Reconstruct Strategy Costs Rehab Strategy Maintain Strategy Figure 16. Life Cycle Strategies. Asset managers can use LCP on an asset level to help inform programmatic decisions that affect their network of assets as a whole. LCP can help answer questions for asset owner decision makers including: Which strategy provides the best level of service or condition of an asset given budget constraints? What level of funding is needed to achieve a desired level of service or condition for a particular asset or for the network? What are the consequences of funding alternatives to a particular asset or on the network? 53
54 LCP involves the use of a significant amount of data in a structured approach. Computer programs have been developed to perform LCP and have been available for decades. Improvements are constantly being made to these programs. Key elements of LCP include the following: Asset inventory information. Condition data over a period of time or performance data. Deterioration or performance models. Repair or treatment options. Decision trees, which allow the selection of repair alternatives. Repair alternatives costs. Life cycles of repair alternatives. Economic analysis approach based on engineering economic principles. TxDOT s LCP Process for Pavements In 2016, TxDOT implemented a new pavement management system, Pavement Analyst (PA). PA provides the ability to forecast pavement condition, perform advanced analysis to answer what-if scenarios, and recommend optimized pavement work plans for preventive maintenance and rehabilitation to maximize the condition of the network based on constrained funding. PA also provides easy access to data, right of way images, the ability to create maps, and reports. The system supports network-level pavement decisions at the Division, District, Area Office, and Maintenance Section level. TxDOT uses a comprehensive engineering and economic approach for conducting the LCP process: TxDOT s Pavement Management System (Error! Bookmark not defined.) and the PA (Error! Bookmark not defined.). The PA Program applies the treatment rules through decision trees and predicts the performance of the pavement network with the use of performance models. During an analysis period, the performance models predict the distresses and ride scores of each pavement section, in each year. Decision trees are used to recommend treatments for each pavement section based on the predicted conditions. Whether the recommended treatment is selected will be further determined by its treatment cost and the available funding. As a result, a set of different treatments for preventive maintenance (PM), light rehabilitation (LR), medium rehabilitation (MR), and heavy rehabilitation (HR) can possibly be adopted for each given section in a 10- year period. The Optimization Algorithm will pick the best treatment strategies from a network perspective. If a treatment is applied to a section for a given year, its condition will be reset and a deterioration or performance model will be applied to predict the condition in the subsequent years. In each year during the analysis period, the conditions of all sections will be summarized to generate the network-level condition statistics. 54
55 The types of maintenance and rehabilitation alternatives available in the decision tree include four broad categories. These broad categories include: Preventative maintenance Light rehabilitation Medium rehabilitation Heavy rehabilitation Table 22, Table 23, and Table 24 describe the treatment definition for ACP, CRCP, and JCP, respectively. The performance and cost of all specific maintenance and rehabilitation alternatives within each one of the four groups (PM, LR, MR, and HR) are assumed to be the same. Table 22. Treatment Definitions for Flexible Pavements. Treatment Level Preventive Maintenance Description Seal Coat Thin Overlay 2" Thick or Less Mill and Inlay 2" or less Hot In-Place Recycling Microsurfacing/Slurry Seal Scrub Seal Light Rehabilitation Medium Rehabilitation Overlay Greater than 2" Thick but Less than 4" Mill and Inlay between 2" to 4" Overlay between 4" and 6" Mill and Inlay Greater than 4" but Less than 6" Whitetopping Overlays Greater than 6" Mill and Inlays Greater than 6" Heavy Rehabilitation Full Reconstruction Full Depth Reclamation (Pulverization and stabilization) new HMA surface Full Depth Reclamation (Pulverization and add new base) new seal coat surface 55
56 Table 23. Treatment Definitions for CRCP Pavements. Treatment Level Preventive Maintenance Light Rehabilitation Medium Rehabilitation Heavy Rehabilitation Description Half Depth Repair/Full Depth Repair Diamond Grinding and Grooving Thin ACP Overlays 2" thick or less ACP Overlay Greater than 2" and Less than 4" ACP Overlay Greater than 4" and Less than 6" Reconstruction Rubblization & Overlay> than 6" Bonded Concrete Overlay Unbonded Concrete Overlay Table 24. Treatment Definitions for Jointed Concrete Pavement-Concrete Pavement Contraction Design (JCP-CPCD) Pavements. Treatment Level Preventive Maintenance Light Rehabilitation Description Diamond Grinding and Grooving Joint and/or Crack Sealing Half Depth Repair Slab Replacement Thin ACP Overlays 2" thick or less ACP Overlay Greater than 2" but Less than 4" Dowel Bar Retrofit and Grinding Medium Rehabilitation ACP Overlay Greater than 4" but Less than 6" Full Reconstruction Rubblizing and ACP Resurfacing Greater than 6" Heavy Rehabilitation Bonded Concrete Overlay Unbonded Concrete Overlay 56
57 Pavement deterioration or performance models have been developed considering numerous inputs for Texas. These inputs or factors that are considered include the following: Climate and subgrade zone-four climatic and subgrade zones. Pavement type and thickness-asphalt bound and Portland cement concrete pavements of different types and thicknesses. Treatment types or alternatives-preventive maintenance and light, medium, and heavy rehabilitation. Traffic loading levels-based on a truck traffic indicator (low, medium, and high level). Within each of the families defined above, a sigmoidal curve is used to project the pavement distress or ride quality loss, which are combined, into a distress score, ride score, and combined condition score based on their utility or weight values. The Texas LCP process is composed of five steps as shown in Figure 17 and briefly described below. Define Asset Analysis Scope Develop LCP Scenario Prepare Scenario Inputs Run Prediction and Optimization Analysis Figure 17. TxDOT LCP Process Flow Chart. Step 1: Define Asset Analysis Scope Asset Results The scope covers the highway network to be considered in the analysis. The data set for the assets under consideration are located and imported into the program. As a minimum, the current condition and inventory information for each section in the selected network is required. 57
58 Step 2: Develop LCP Scenario The LCP scenarios are heavily dependent on the funding levels in the planning period. TxDOT publishes the UTP annually (Error! Bookmark not defined.). This document contains a funding scenario for a 10-year period for several funding categories. A portion of the UTP fund is dedicated for pavement preventive maintenance and rehabilitation. In addition, there is a maintenance budget allocated for pavements. These funds may vary considering the uncertainty/risk in the financial forecast. TAMP will use various 10-year UTP and maintenance funds in the LCP analysis as described in the Financial Plan and Investment Strategies (Chapter 6). The main LCP scenarios are listed below: Current planned investment levels. Reduced funding investment levels (e.g., 10 percent lower than planned). Increased funding investment levels (e.g., 10 percent higher than planned). In addition, a scenario that sets the funding at a level to preserve the network is determined and included in this document. Step 3: Prepare Scenario Inputs For each LCP scenario, a series of factors is needed as input. These factors include network scope, start condition, analysis length, decision trees, financial parameters, etc. In addition, the most critical ones are the objective and constraints. In the LCP process, the objective is to maximize the performance of the network during the analysis period and the constraints are the available funding for each year. Step 4: Run Prediction and Optimization Analysis Once the inputs are prepared, each scenario can be run in the PA program to obtain the optimal solutions that meet the objective under the constraints. The optimal solutions include the right treatment at the right location and right time. As a result, the PA program will output the selected treatment and predicted condition for each section in the network in each year. It will also provide the summary statistics in condition, treated lane-miles, total treatment cost, etc. for the entire network. Step 5: Assess Results Based on the results in Step 4, the logical next step is to make an assessment from an engineering and economic perspective. This step typically involves answering the following questions: 58
59 What is the impact of different funding levels on the network level performance? What is the gap between the projected condition of the system and the established criteria for defining the SOGR for any given funding level? How does the financial plan address the gap? TxDOT Pavements The LCP process for TxDOT on-system pavements used the following inputs to the PA program: Analysis scope: The analysis was performed on all TxDOT on-system pavements. This included NHS system on-system pavements and on-system non-nhs pavements. At the current time, it is not possible to accurately segment funding for these highway categories. Thus, the LCP tool was used to reflect the operational reality at TxDOT (i.e., for the entire network). Start condition: The current condition of the network is based on information collected in The year 2017 was used as the start year in the prediction analysis. Funding level: Table 25 provides a series of funding levels. The planned funding level, or baseline funding, was obtained from information presented in Chapter 6, Financial Plan and Investment Strategies. On-system highways are estimated to account for 95 percent of the total pavement funding. This percentage was applied to the UTP funding in Table 38 to determine the baseline 10-year funding level used in the LCP analysis. For funding variation, a fluctuation of plus or minus 10 percent from the baseline was used. Table 25. Different Funding Scenarios for the 10-Year Analysis Period. Scenario No. Scenario Name Funding Level ($Billion) 1 Planned Fund $ % over Planned Fund (Planned Fund +10%) 3 10% under Planned Fund (Planned Fund 10%) $19.51 $ Worst-first $17.74 Financial parameters: A rate of return of 4 percent was used in the analysis. This is consistent with constant dollar economical life cycle approaches. The rate of return addresses the inflation rates associated with the time value of money. Material and 59
60 labor inflation rates beyond the time value of money impacts are not considered in the analysis. The unit costs vary among different pavement types including CRCP, JCP, and ACP, and work types including PM, LR, MR, and HR. Each unit cost represents the cost required to treat one lane-mile of pavement and is shown in Table 26. Table 26. Pavement Treatment Unit Costs. Pavement Type Treatment Type Treatment Unit Cost per Lane Mile ($) CRCP PM $81,703 LR $172,041 MR $210,144 HR $971,516 JCP PM $817,03 LR $172,041 MR $210,144 HR $971,516 ACP PM $534,62 LR $221,186 MR $296,023 HR $470,988 Figure 18 shows the results of the optimization analysis for the inputs described above for the funding scenarios described. For comparison, the historical percent of Good/Very Good pavement for the statewide network from FY2010 to FY2017 are shown. 60
61 % G/VG Historical Predic w/ PlanFund+10%(Optimize) Worst First(Worst First) Predict w/planfund(optimize) Predict w/ PlanFund 10%(Optimize) Figure 18. Statewide Historical and Predicted Percent Good/Very Lane Miles for Statewide Network in 10 Years of LCP Period. As expected, the predicted performance varies with different levels of funding. The percent of Good/Very Good increases with the increase of funding. Overall, gaps exist for these funding levels to make the entire network reach the goal of 90 percent Good or better: With the planned funding level, the network can perform slightly better than the current condition (86.30 percent Good/Very Good) by the end of 10-year period (86.83 percent Good/Very Good). With a 10 percent budget increase, the network can reach very closely to the TxDOT statewide goal of 90 percent Good/Very Good by the end of 10-year period (89.04 percent Good/Very Good). With a budget at 10 percent below the expected funding level, percent of the pavements will be classified as Good/Very Good at the end of the analysis period. Another scenario analysis was conducted to establish a funding level that will keep/preserve the network at the current condition in terms of percent lane miles Good/Very Good in the 10-year analysis period. It is determined that as the funding reaches $17.39 billion, the network will remain in the current condition. In addition to the above scenario runs based on the optimization algorithm, for comparison, Figure 18 shows the predicted network performance under a different strategy, the worstfirst scenario. The predicted percent Good/Very Good with worst-first is lower than the optimization result (Figure 18). 61
62 LCP Process for Bridges Through the TAMP document preparation, and in recognition of gaps in the TxDOT system, the LCP capabilities of TxDOT s bridge management system will be implemented. FHWA regulations stipulate that a LCP process for bridges must include the following components: the state department of transportation s (DOT s) performance measure targets, bridge deterioration models, bridge work types that preserve or improve assets, and strategies that lead to the managing of assets while minimizing costs during the whole life of assets (23 CFR 515.7(b)). One outcome of TxDOT s TAMP development process will be the use of a bridge management system to satisfy these requirements. This section will discuss bridge performance trends in consideration of LCP on a network level. Chapter 8 of this document will describe the specific process TxDOT plans to take to implement a bridge management system in support of LCP in the final TAMP. Although FHWA s good, fair, and poor performance measures have only recently been formally adopted, it is possible to apply these measures to previous years of bridge data. Doing so establishes a baseline for bridge performance in the state. Table 27 shows bridge condition information based on deck area and good, fair, and poor categories as defined by FHWA for NHS from 2007 to Table 27 shows bridge condition information for both NHS and other on-system bridges from 2007 to This table also includes anticipated values for percent good, fair, and poor deck area in the near future. TxDOT anticipates there will be a lag time between the development of condition-based bridge management processes and the actual impact on system performance measures. For that reason, it is expected that network performance measures will follow these linear trends in the short term. 62
63 Table 27. Bridge Conditions (NHS and On-System Bridges). Deck Area (million sq. ft.) Good Fair Poor Total (53.9%) (44.1%) 7.5 (2.0%) (100.0%) (52.6%) (45.7%) 6.7 (1.7%) (100.0%) (52.9%) (45.5%) 6.5 (1.6%) (100.0%) (52.9%) (45.7%) 6.1 (1.4%) (100.0%) (52.5%) (46.4%) 5.2 (1.1%) (100.0%) (51.5%) (47.5%) 4.4 (0.9%) (100.0%) Projected 2019* (51.6%) (47.6%) 4.0 (0.8%) (100.0%) Projected 2021* (51.4%) (47.9%) 3.4 (0.7%) (100.0%) Projected 2023* (51.2%) (48.3%) 2.9 (0.5%) (100.0%) *Projections for deck area in good, fair, and poor condition were developed via linear trend line analysis. Based on this historic data, two distinct trends can be observed. First, the percent of poor bridges has decreased steadily to the lowest practical level. Second, the percent of good bridges is also decreasing. This offers an opportunity to shift focus away from addressing primarily bridges in poor condition and adopting a more holistic approach to bridge management. Throughout the development and implementation of this report, TxDOT will be investigating alternative strategies that may yield network performance results more economically efficient in the long term. Bridges in Texas have typically been replaced after 50 to 70 years of service, once they transition into a poor condition state. Although this management strategy has served TxDOT well in the past, there is reason to believe it may be economically unsustainable in the long term. 63
64 Figure 19 shows the distribution of bridge deck area by condition group and age, highlighting that TxDOT s bridge asset management strategy must take into account the large number of bridges constructed during the interstate era that are approaching the end of their intended service lives Deck Area (Millions SF) Poor Fair Good 0 Bridge Age (Years) Figure 19. Deck Area by Age and Condition Group (NHS and On-System Bridges). Category 6 of the UTP has been TxDOT s primary tool for funding bridge replacement projects. With typical funding levels, Category 6 has been able to improve bridges at a rate of less than 5 million square feet per year. Recognizing the large volume of bridges that are approaching the end of their service life, TxDOT will be evaluating historic practices along with new strategies to ensure sustainable long-term performance of the network. As Texas bridge inventory continues to age, condition deterioration rates are expected to accelerate. Given the vast size of Texas bridge inventory and the reality that it will take time for changes in asset management strategies to be implemented and realized through better condition scores, TxDOT expects bridge conditions to closely follow these historic performance trends in the short term. 64
65 Chapter 5: Risk Management Overview Risk management is defined by FHWA as the processes and framework for managing potential risks, including identifying, analyzing, evaluating, and addressing the risks to assets and system performance. Risk management processes and considerations should be updated on a periodic basis. TxDOT uses risk management in the TAMP to identify risk items that could impact performance of pavement and bridges. A risk management system will provide better, more informed decisions to address existing or potential risks. The use of risk management also provides an improved understanding of likely outcomes and results of actions taken in response to the risks. TxDOT assumes and addresses risk with each transportation decision made at all levels within the agency. TxDOT, like many other transportation agencies, faces a range of general risks including the following categories: Public and agency safety. Human resources. Business systems performance. Legal and compliance. Fluctuations in funding. Project delivery. Emergency events. FHWA regulations (Error! Bookmark not defined.) require the development of a risk-based asset management plan. TxDOT adopted a risk analysis framework proposed by a number of industry experts (17, 18). The framework incorporates the processes of risk assessment and management that addresses the risks identified. 65
66 Risk Management Processes Identification Analysis Risk Assessment Evaluation Addressing Risk Figure 20. Risk Management Process. Three analyses were conducted as part of the development of the risk based TAMP effort. These analyses are identified below: Environmental Impacts to Assets. Risk Management Processes. Facilities Repeatedly Requiring Repair and Reconstruction as a result of Emergency Events (recurring events). The first two analyses are required by Part 515 of Federal Regulation 23 CFR (Error! Bookmark not defined.), and the third is a result of Part 667 (Error! Bookmark not defined.) of Federal Regulation 23 CFR. A discussion of the analyses conducted and the top risks identified through the risk management process follow. Environmental Impacts As a minimum, FHWA requires state DOTs to identify risks associated with NHS asset performance, including risks associated with current and future environmental conditions. 66
67 This section identifies frequently occurring environmental risks and how TxDOT addresses them. In the transportation context, and for the purposes of this TAMP, environmental stressors are natural events that impact highway assets. These are inclusive of climatological events and extreme weather, which are typically the most influential to the performance of Texas assets. In addition to a large number of rivers, streams, lakes, and reservoirs, Texas has approximately 367 miles of coastline exposure to the Gulf of Mexico (19). This exposure increases the vulnerability of transportation assets to tornado, hurricanes, and tropical storm winds as well as surging gulf waters pushed inland by hurricanes. Droughts also cause deterioration to highways because many Texas facilities are constructed on clay soils that change volume with changes in soil moisture content. Texas recognizes and proactively prepares for changes to the transportation environment. The environmental review process provides early programmatic guidance on environmental considerations; whereas, the planning process and design phases are project level evaluations to specifically account for the most typical environmental stressors. TxDOT engineers design facilities considering the effects of flood, precipitation, storm surge, and winds. Data defining potential impacts of these events are used to design durable and resilient roadways; appropriate materials are used to address the local environment influence; and construction techniques are modified to account for climatological data and short term fluctuations in weather. Except for extreme weather events, most climatological and environmental stressors are considered in advance of asset construction and the scheduling of asset reconstruction, rehabilitation, and maintenance operations. Environmental Stressors Like many other state agencies, TxDOT assets are impacted by a number of climate variables. Table 28 shows climate variables identified and discussed in a recent TxDOT study through the Environmental Affairs Division (20). Many of the commonly considered climate variables have little to no change associated with them; therefore, their influence, in the short term, is not anticipated to have an appreciable effect on the performance of Texas assets. 67
68 Table 28. Texas Climate Variables with Potential Asset Impacts. Climate Variable Temperature Drought Sea Level Rise Precipitation Environmental Events/Impacts Freeze Thaw Cycles Heat Waves Wildfire Decreased Precipitation Wildfire Increased Water Elevations (relative to land mass elevation) Drought Flooding Variable Changes 3.08 to 6.25 F increase of annual maximum temperature in 50 years 2 Increase of 1 to 7 days of consecutive dry days 1.9 to 6.6 mm/yr rise along the Texas coastline No appreciable change Historically, Texas has not been affected by large or frequent seismic activity. Recent increases in seismic activity appears to be associated with the large amounts of water disposal centered in areas of oil and gas drilling and production, and along natural fault lines. The United States Geological Survey predicts that most induced events are in lightly populated regions where they have only a 2 percent chance of damage in approximately a 50-year period (21). Although TxDOT develops engineering solutions in response to environmental stressors gradual climatological changes do not account for the occurrence of a single extreme weather event. Hurricane Harvey in 2017, for example, produced the largest historical rainfall from a single event in the state s history when no appreciable change in precipitation was anticipated. These extreme weather events pose the predominant threat to Texas infrastructure. Extreme Weather Impacts A quantification of assets within a given risk area is possible using geospatial analysis. These quantities are useful as a means of determining the locations, numbers and lengths of vulnerable pavement sections, and bridges that may be impacted by storms of various magnitudes. An asset located within risk prone areas may not experience physical damage. For example, the event may not occur at that location and the impacted structure may be hardened sufficiently to resist the event. 2 United States Geological Survey, National Climate Change Viewer. 68

69 More frequent and more severe weather events are anticipated (22), which makes vulnerability considerations a statewide concern. Hurricane Harvey is an example of an extreme event that had a tremendous impact on Texas. In November 2017, the National Oceanic and Atmospheric Administration (NOAA) released updated frequency estimates for Texas, which included data from Hurricane Harvey. Note that data presented in this TAMP do not include data from Hurricane Harvey. Pavements Extreme weather events such as major flooding and storm surges have historically impacted the state s transportation system. While it is difficult to predict the severity and frequency of future extreme weather events, historical information can assist in identifying areas of concern. Storm Surge NOAA provides storm surge data for many coastal regions. Figure 21 shows the progression of predicted storm surge due to increased hurricane severity. The depth of water over land is shown as blue for 1 ft and red where more than 9 ft of inundation may occur. The length of vulnerable roadway segments gets progressively longer as the severity of storm increases. The length of roadway impacted by a Category 5 hurricane is substantially more than a Category 1 hurricane. a. Category 1 Storm Impacts. 69


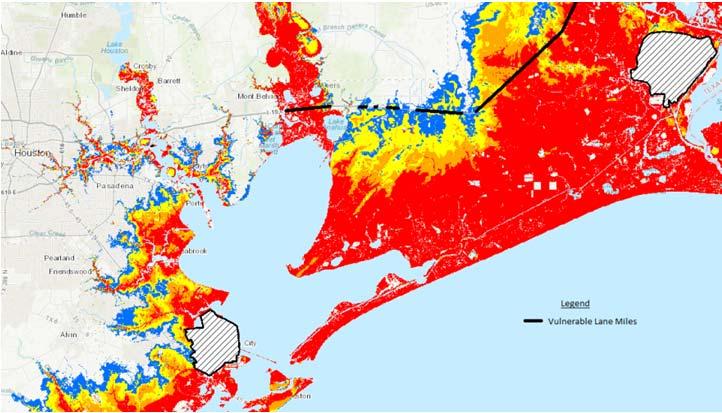
70 b. Category 2 Storm Impacts. c. Category 3 Storm Impacts. d. Category 4 Storm Impacts. 70

71 e. Category 5 Storm Impacts. Figure 21. Storm Surge Resulting from Different Category Hurricanes in the Houston Area. To determine statewide vulnerability to storm surge, the geospatial analysis is repeated for all areas in the state. Figure 22 shows the number of vulnerable NHS lane miles for each hurricane category. This mileage is determined by applying the storm surge data overlay on all regions of the state; therefore, the mileage is larger than what is likely to be affected by a single event. For example, a hurricane striking Port Arthur, Texas, may not cause any storm surge in Brownsville, Texas, but highway mileage is identified in both areas to document the potential for each to be impacted at some time # of Lane Miles 2109 Lane Miles Linear (# of Lane Miles) Category 1 Category 2 Category 3 Category 4 Category 5 Figure 22. Vulnerable Lane Miles due to Storm Surge by Hurricane Category. 71

72 Flooding Assets vulnerable to flooding were identified using Federal Emergency Management Agency (FEMA) flood plain data (Figure 23). Currently, statewide flooding data are not available that defines 100-year and 500-year flood plains. In many cases, there is not a 500-year flood plain corresponding to a 100-year flood plain. Where the data were absent, a 500-year flood plain was synthesized proportional to the areal increase calculated between the 100 and 500-year data where the two flood plain maps exist. Figure 23. Example FEMA Flood Plain Map. A geospatial analysis was performed using FEMA and synthesized flood plain data. Highway segment lengths were determined where they crossed or were contained in the 100-year flood plain. Similarly, the additional length of vulnerable roadway was determined for the 500-year flood plain. Figure 24 shows the number of NHS lane miles that are geographically located in the 100- year and 500-year flood plains. These roadway segments are said to be vulnerable to flooding events. Since these are total lengths, the 100-year mileage is a subset of the 500- year mileage. Like storm surge, an asset may not experience physical damage if it is within the vulnerable area; rather, the areal extent identifies assets to be assessed for the probability of damage. 72
73 Lane Miles Figure 24. Lane Miles Affected by Flood Severity. Bridges 4811 Based on available data, it is also possible to calculate via geospatial analysis the portion of Texas bridge inventory that lies within estimated flood plains for 100-year and 500-year events. While many bridges may fall within these flood plains, not all are necessarily at risk of flood damage. Actual susceptibility to erosion and hydraulic forces is determined through engineering analyses, taking into account site-specific variables (such as soil properties, channel geometry, and substructure geometry). TxDOT engineers perform scour evaluations for bridges that cross over water features. NBI Item 113, labeled Scour Critical Bridges is used to identify the current status of a bridge for its vulnerability to scour (23). Item 113 ratings are made by engineers with hydraulic, geotechnical, or structural expertise. Similar to primary component condition ratings, Item 113 values fall within a numeric scale between zero and nine (with nine being the least susceptible). Bridges with Item 113 values of four have foundations that are, by engineering assessment, stable for scour conditions; however, field review indicates action is required to prevent structural instability from developing. Bridges with Item 113 values lower than four are increasingly at risk of structural instability due to scour concerns. For TAMP analysis, only bridges meeting each of the following criteria are considered potentially vulnerable to flood damage: The bridge is located within the 100-year or 500-year event flood plains. The bridge crosses over one or more water features. The bridge has an Item 113 rating of four or less. Table 29 shows the quantity of Texas bridges vulnerable to flooding for 100 and 500-year storms. Although scour and flood damage are some of the more common threats to Texas Year 500 Year 73
74 bridges, less than 2 percent of the state s bridge inventory is susceptible to damage. Over the past several decades, TxDOT has dedicated significant resources toward enhancing scour repair and other mitigation practices to reduce damage due to flooding. Table 29. Bridge Assets Vulnerable to Flood Risk. NHS Total* Total TAMP Inventory** Vulnerable to 100- Year and 500-Year Flood Event Vulnerable to 500- Year Flood Event Only Number of Bridges Deck Area (million sq. ft.) Number of Bridges Deck Area (million sq. ft.) % % % % % % % % Not Vulnerable 17, % % 35, % % All Bridges 17, % % 36, % % *Includes both On-System and Off-System bridges carrying NHS roadways **Includes all vehicular bridges carrying or crossing roadways that are On-System and/or NHS In the 1990s, TxDOT formed a statewide working group to establish best practices for remediating scour at bridge piers. This work group established pier remediation strategies that minimize long-term scour repair costs. Further, TxDOT s geotechnical and hydraulic engineers have been involved in several recent scour research projects, seeking to extend the long-term performance of stream-crossing bridges. The following research reports have been influential in TxDOT s development of scour protection measures: National Cooperative Highway Research Program Report 516: Pier and Contraction Scour in Cohesive Soils (24). National Cooperative Highway Research Program Report 568: Riprap Design Criteria, Recommended Specifications, and Quality Control (25). TxDOT/TTI Federal Aid Project : Establish Guidance for Soils Properties Based Prediction of Meander Migration Rate (26). TxDOT/TTI Federal Aid Project : Simplified Method for Estimating Scour at Bridges (27). In spite of the severe flood events that have occurred over the past several years, conservative strengthening practices have ensured that very few bridges have been damaged. Recent scour remediation projects generally involved only embankment and riprap repairs. Structural repairs to bridge foundation elements have been relatively rare the last several years. Figure 25 and Figure 26 show typical scour remediation projects. By 74
. Figure 26.")


75 identifying and improving embankment stability issues early, the need for more costly structural repairs to substructure elements is usually avoided. Figure 25. Erosion Repair and Scour Protection (Gabion Mattresses). Figure 26. FM Guadalupe River in the San Antonio District Erosion Repairs and Installation of Embankment Protection Measures (Gabion Mattresses). Extreme Weather Summary Extreme weather events may alter the design of TxDOT projects especially in areas subjected to excess flooding or storm surge. For example, TxDOT has already made changes to reduce bridge scouring from flood-prone areas and bridge heights have been increased to address potentially higher coastal storm surges. Future extreme weather events may result in additional changes to TxDOT transportation planning, design, emergency response, maintenance, and asset management operations. Maintenance and pavement design considerations currently address severe weather issues (heat, drought, and flooding). Programmatically, resiliency efforts, especially for riverine and coastal areas, are included in the planning and programming process when assets are in need of repair, rehabilitation, or 75
76 reconstruction. The use of flood mapping, coastal surge data, and other relevant data will allow TxDOT to begin considering asset resiliency on a more strategic level. Consideration of resiliency projects may then be developed through the project programming process. Economic Risks due to Emergency Response Historical emergency expenditures provide insight into expected future costs and costvariability of similar work. TxDOT has consistently recorded and tracked emergency expenditures over several years. Summarized as an economic risk, emergency response costs detract from resources available for preservation activities. Emergency funds are typically identified only as contingency expenditures. Figure 27 shows annual emergency work expenditures for the fiscal years 2009 to Expenditures shown in Figure 27 do not consider funds expended for Hurricane Harvey. Funds for large repair, reconstruction, and replacement projects, if needed, are identified through the normal project funding mechanisms discussed in Chapter 6, Financial Plan. The effect of proceeding with these activities is to defer the letting of some projects to accommodate the funding required. This represents a risk to the timely delivery of relevant project to accomplish TxDOT objectives. Dotted lines indicate values corrected by Highway Cost Index. Figure 27. Emergency Expenditures over Time. NHS roadways in Texas require far less emergency maintenance and repair than other Texas roadways. Following severe weather events, emergency spending on the NHS does not spike as dramatically as for the rest of the system. About 31 percent of the lane mileage managed by TxDOT is on the NHS, which requires only 16 percent of emergency spending. 76
77 Emergency expenses have averaged about $41 million per year on the TxDOT system with a high degree of variability. From a budgetary perspective, it is prudent to identify funds that might be needed to address these events. Table 30 indicates the likelihood of emergency funds needed in any particular year based on historic expenditure levels. Table 30. Estimated Emergency Expenses in a Given Year. Likelihood Projected Expenditure 50% $41M 15% $66M 10% $72M 5% $81M Risk Management Process The TxDOT TAMP risk management processes were developed under the guidance of the TAMP Steering Committee and followed the framework shown in Figure 20. Final selection of the high priority risk items and their mitigation was also performed by the TAMP Steering Committee. Subject matter experts (SMEs) used workshops to identify risk items that might impact the performance of pavement and bridge assets. Risks deemed important to other state agencies were used in addition to risks identified by TxDOT. Risks identified through this process were used to construct a risk register for further analysis and evaluation. The TAMP risk register items were examined and were grouped into seven categories: System condition and performance. Health and safety. Environmental. Economic. Agency function. Legal and compliance. Stakeholder interest. SMEs generated several risk items for each risk category. SMEs identified the cause and potential impacts for each risk item. Approximately 120 risks were initially identified and placed in the categories identified above. A balloting and discussion process described below was used to reduce the 120 risks to about 40 risks of high importance. The 40 high priority risks were then considered by the TxDOT TAMP Steering Committee and a similar process was used to further reduce the leading risk items. 77

78 Risks were analyzed using a rating system that considered the likelihood of occurrence and the impact of the risk item to the system performance. Likelihood and impact of risks were qualitatively evaluated using a 1 to 5 scale as shown in Table 31. The product of the likelihood and impact ratings produced an overall rating. The overall rating of an individual risk was used to rank the risk items among others. A risk, qualitatively, may be identified as a low, medium, or high risk or mission critical. The average products of likelihood and impact, as balloted by Steering Committee member, were used to identify risk priority. A risk with a product falling within a range of values identifies the risk priority as follows: Low 1 6. Medium High Critical There is overlap in the ranges from low to medium where an Insignificant but Almost Certain risk and a Rare but Catastrophic risk are designated as Medium risks. An example risk rating determines a risk with a moderately impactful risk (rating of 3) that has a possibility of occurrence (rated as 3) as a Medium risk identified by the product of the impact and likelihood ratings equal to 9. Table 31. Risk Analysis Matrix. Steering committee members determined the leading risks during a meeting by using the risk analysis process discussed above together with open discussion. The discussions allowed the Steering Committee to propose preliminary mitigation strategies to address each risk. Table 32 shows the results of the risk management analysis and how each risk is addressed through this process. Future risk management workshops will be used to refine, reassess, and reprioritize risks and mitigation strategies that support TxDOT goals and objectives. Once risk assessment tasks are complete, the Steering Committee will discuss and identify the Owner or office 78
79 most appropriate to manage the risk identified. Through this process, the status and disposition of each risk may be determined to allow the Steering Committee to reevaluate the appropriateness of the Risk Register. Table 32. TAMP Risk Register. Risk Register Risk Description Mitigation Strategy Risk Rating Variability in revenue and funding priorities causes large variations in realized project delivery Decline in asset performance due to programming decisions 1. Develop funding scenarios accounting for possible funding variability. 2. Develop and maintain a list of prioritized projects that may be developed to accommodate funding scenarios and level letting volumes commensurate with funding. 3. Develop a contingency plan that identifies project priorities if the budget is cut or increased suddenly. 4. Establish robust targets for each key phase of project development authority to assure portfolio health and flexibility. 5. Provide accurate and timely feedback/testimony to legislators and policy-makers on decisions that affect funding for asset management. 1. Evaluate effectiveness of current asset management processes and systems. 2. Review programming processes to increase highway system performance. 3. Track status of asset (e.g., inspection schedule, condition of asset) to plan optimal time and type of repair or replacement. 4. Establish robust development of projects within all stages of the planning process. 5. Develop a contingency plan that High High 79
80 Risk Register Risk Description Mitigation Strategy Risk Rating identifies project priorities if the budget is cut or increased suddenly. Declining asset performance due to reduced emphasis on maintenance Accelerated asset (pavement and bridge) deterioration because of unexpected heavy truck traffic from the energy sector or freightintensive industry Occurrence of an unanticipated weather event or natural disaster such as a hurricane resulting in system damage 1. Emphasize importance of maintenance for assets through TAMP and performance impact modeling. 2. Enhance the asset preservation program by continuing Best Practices processes such as Peer Reviews and the 4 yr. Pavement Management plan reviews. 3. Refine the use of asset management systems to assist with project prioritization and selection. 1. Study the issue and look to other states for potential guidance. 2. Refine ability to predict performance with the presence of traffic increases. 3. Track and make adjustments to traffic prediction models so that management systems reflect impacts on infrastructure. 4. Develop a management strategy for prioritization of energy sector corridors. 1. Update hydraulic design criteria and guidance. 2. Continue ongoing resiliency efforts. 3. Develop contingency funding scenarios. High High High 80
81 Risk Register Risk Description Mitigation Strategy Risk Rating Ability to maintain or develop staff knowledge and use of technology for asset management 1. Develop contingency funding scenarios. 2. Develop plans for implementing replacement systems. High The risk management process will be revisited periodically. An evaluation of the risk management process is warranted to ensure TxDOT identifies the most appropriate risks for assets on the state highway system and on the NHS. Periodic evaluations of this process will allow identification of risks that reflect current Texas transportation policy, available funding, and other considerations. Recurring Events As part of a separate FHWA rule (23 CFR 667) (5.4), state DOTs must identify assets repeatedly damaged by emergency events. Specifically, states transportation agencies shall conduct statewide evaluations to determine if there are reasonable alternatives to roads, highways, and bridges that have required repair and reconstruction activities on two or more occasions due to emergency events. The process and criteria used to determine whether any such assets were identified is discussed below. Applying this process, TxDOT does not presently have an NHS asset considered to have been repaired more than once in the period reviewed. This evaluation does not consider assets that may have been damaged by Hurricane Harvey in TxDOT routinely considers recurring events in the planning, project development, and detailed design phases of their operations. These recurring events are reported for NHS highways and bridges in this TAMP. Criteria used to identify qualifying assets are shown below. Numerous data sources were used to determine whether a highway or bridge asset should be identified in the TAMP and for reporting in accordance with 23 CFR 667, or Part 667. The following evaluation criteria were used: Asset is part of the NHS. Asset damage resulted from a natural disaster or other emergency declared by the governor or U.S. president. Asset was damaged on two or more occasions. Repeated damage occurred at the same location. Mode of asset failure or cause of repeated damage was similar. 81
82 TxDOT s Maintenance Division submits damage reports and reimbursement requests for projects and other expenses to FHWA following a declared disaster. FHWA determines reimbursement eligibility and a project s disposition. For the analysis in this TAMP, a table of emergency repair projects spanning from 1997 to 2017 was used to determine if any met any, a portion, or all criteria discussed. The FHWA table contains where and when projects containing work addressing damaged assets pertaining to Part 667 and the amount reimbursed to the state. These projects were narrowed to instances where work performed on a NHS asset, and additional steps were taken to determine whether each pavement or bridge asset had been included in prior emergency repair projects. Further filtering of projects was performed to determine if projects addressing the same asset are in response to separate events and whether the mode of failure was similar. An asset exhibiting failure more than once would be a candidate for reporting in accordance with Part 667. Occasionally, more than one project is performed in response to the same event. For example, following the collision and damage to the Queen Isabella Causeway in 2001, primary bridge elements were replaced immediately. In 2003, a collision prevention system was installed. These are not considered recurrences because they were necessitated by the same event. The TxDOT Maintenance Division leads the efforts to identify assets addressed by Part 667. Other divisions are contacted when there are assets meeting the evaluation criteria. Maintenance Division staff will review emergency repair projects for NHS assets when data are available after the occurrence of a qualifying event. Data sources are the FHWA table of reimbursed projects and other TxDOT identified assets requiring emergency repair. As asset damage recurrences appear, Division and District personnel responsible for project programming and development will be notified so that the appropriate project level design criteria and resiliency actions may be considered. This will afford the District the opportunity to program and potentially construct feasible solutions to reduce the probability of future damage. 82
83 Chapter 6: Financial Plan Overview FHWA requires states to establish a process for the development of a financial plan that identifies annual costs over a minimum period of 10 years. To meet these requirements, the following information must be presented: The estimated cost of expected future work to implement investment strategies contained in the TAMP. Estimated funding levels expected to be reasonably available to accomplish future work. Identification of anticipated funding sources. An estimate of the value of the agency s NHS pavement and bridge assets and the needed investment to maintain the value of those assets. TxDOT identifies its revenue sources and expected revenue available for transportation projects annually through its UTP. The UTP is authorized annually by the State Transportation Commission covering a 10-year period. The purpose of the UTP is to guide the development of and authorize construction and transportation projects. The UTP contains information on revenue forecasts and investment strategies relevant to the funds available to maintain pavements and bridges in a SOGR. The available funding for the 10-year period of the UTP is known as the planning scenario. Because the UTP addresses statewide transportation projects of all types, (pavement, bridge, safety, mobility, connectivity, and congestion), funds available for pavement and bridge work have to be disaggregated from each category of funding. Each category contributes some amount to both pavement and bridge. To calculate how much, historical information on the percentage of each category is determined and amount of the annual UTP funding is identified proportional to the percentage of pavement or bridge represented. This disaggregation of funding is based on many assumptions, not the least of which is that the percentage representation remains the same from year to year. The planning scenario identifies projections of funding sources, which then allow the forecast of funds available to distribute through the processes documented in the UTP and described in this TAMP. The information relevant to the TAMP and funds projected to address pavement and bridge needs is further discussed in this chapter. Sources of Revenue Funding for transportation in Texas is generated from several federal, state, and other sources. Table 33 and Figure 28 list the revenue sources available for transportation related TxDOT expenses. Future revenues are projected based on financial analysis that includes 83


.")


84 historical trends, current statutes, the Comptroller s most current revenue estimates provided in the Biennial Revenue Estimate or Certification Revenue Estimate, current events, and other sources as appropriate (Error! Bookmark not defined.). Texas Mobility Fund Toll and Concession Funds Prop 1: Oil & Gas Severance Tax Bond Proceeds Prop 7: Sales & Use Tax SHF Motor Fuel Tax Vehicle Registration Fee FHWA Reimbursements Other Transportation Revenues Other Figure 28. Sources of Revenue: Total Transportation. 84
85 Table 33. Estimated Total Transportation Available Revenues (in Billions$). State Highway Fund (SHF) Bond Proceeds Texas Mobility Fund Toll & Concession Funds Prop 1: Oil & Gas Severance Tax Prop 7: Sales & Use Tax Other Total Funds FY18 $9.5 $1.2 $0.8 $0.2 $1.4 $0.0 $0.4 $13.5 FY19 $9.3 $0.1 $0.6 $0.2 $0.5 $1.8 ($0.2)* $12.3 FY20 $8.5 $0.0 $0.5 $0.1 $0.6 $2.0 $0.1 $11.7 FY21 $8.7 $0.0 $0.5 $0.1 $0.5 $2.5 $0.1 $12.4 FY22 $8.4 $0.0 $0.5 $0.1 $0.4 $2.8 $0.1 $12.2 FY23 $8.0 $0.0 $0.5 $0.0 $0.2 $3.0 $0.1 $11.8 FY24 $7.9 $0.0 $0.5 $0.0 $0.1 $3.1 $0.1 $11.7 FY25 $8.0 $0.0 $0.5 $0.0 $0.0 $3.2 $0.1 $11.8 FY26 $8.2 $0.0 $0.5 $0.0 $0.0 $3.3 $0.1 $12.1 FY27 $8.5 $0.0 $0.5 $0.0 $0.0 $3.4 $0.1 $12.4 Total $84.9 $1.3 $5.3 $0.9 $3.8 $25.1 $0.6 $121.9 *In 2019, a one-time payment to the General Revenue Fund is made for debt service on Proposition 12 GR Bonds. Figure 29 depicts the revenue sources for the total 10-year planning horizon. The SHF comprises 70 percent of the total revenues available for transportation. 85


86 State Highway Fund Toll & Concession Funds Proposition 1 Proposition 7 Bond Proceeds Texas Mobility Fund Other Source: Data from TxDOT Long-Range Revenue Forecast FY 2018 Figure 29. Total Transportation Revenues. State Highway Fund The SHF is the largest source of revenue for transportation in Texas. It consists of revenues from the gas and diesel fuel tax, vehicle registration fees, federal reimbursements, and a few other miscellaneous fees (Table 34). 86
87 Table 34. Estimated SHF Revenues (in Billions$). State Motor Fuel Tax Registration Fees FHWA Reimbursements Other Fed Reimbursements Other Total FY18 $2.7 $1.5 $4.2 $0.2 $0.6 $9.2 FY19 $2.7 $1.5 $4.5 $0.4 $0.6 $9.7 FY20 $2.8 $1.6 $4.2 $0.2 $0.5 $9.2 FY21 $2.8 $1.6 $4.2 $0.2 $0.3 $9.1 FY22 $2.9 $1.7 $3.8 $0.2 $0.3 $8.8 FY23 $2.9 $1.7 $3.2 $0.2 $0.3 $8.3 FY24 $2.9 $1.8 $3.0 $0.2 $0.3 $8.2 FY25 $3.0 $1.8 $3.0 $0.2 $0.3 $8.3 FY26 $3.0 $1.9 $3.0 $0.2 $0.3 $8.4 FY27 $3.1 $1.9 $3.1 $0.2 $0.3 $8.6 Total $28.7 $17.1 $36.3 $2.1 $3.7 $87.8 Note: Total varies from available revenue balance in Table 33 due to balance carry-over from year-to-year. The state motor fuel taxes consist of a 20 cents per gallon tax on both gasoline and diesel fuel. Vehicle registration fees vary based on the vehicle type, weight, and age. Passenger cars and light trucks up to 6,000 lb are assessed a $50.75 fee annually. Texas receives federal funds from the Highway Trust Fund to be used on eligible projects. FHWA Reimbursements Federal highway reimbursement projections take into account the current highway bill, continuing resolutions, rescissions on obligation authority and apportionment, and other requirements made by FHWA and the federal government for the use of those funds (Error! Bookmark not defined.). Other Federal Reimbursements Other federal funds are reimbursement programs for aviation, public transportation, and traffic safety. Because those funds are tied to specific existing program levels, which are expected to remain constant the next few years, there is no assumption of growth. Other federal funds also includes federal assistance in the form of loans through the 87
88 Transportation Infrastructure Finance and Innovation Act expected to be received FY 2017 FY 2019 (28). Other Revenues In addition to the SHF, the state of Texas authorized several bond issues beginning in The remainder of those issues contribute to the available funds in FY18 and FY19. Revenue from the Texas Mobility Fund (taxes and fees) is used to service the debt on Texas Mobility Fund Bonds. The taxes and fees consist of: Driver s license fees. Driver s record info fees. Vehicle inspection fees. Certificate of title. Other. Additional revenues are also generated from various toll and concession projects around the state. Proposition 1 Oil and Gas Severance Taxes Proposition 1 is an amendment to the State of Texas Constitution, approved by the public in November The amendment directs a portion of the oil and gas severance tax be diverted from the Economic Stabilization Fund to the SHF at the beginning of each fiscal year. For planning purposes, 80 percent of assumed transfers are made available, and while the transfers will end in 2025 without further legislative action, the planning scenario assumes they will continue through Proposition 7 Sales and Use Taxes Proposition 7 is another constitutional amendment passed by the Texas Legislature and approved by the public in November The Comptroller is directed to deposit $2.5 billion of the net revenue derived from the state sales and use tax in excess of $28 billion to the SHF each year. This provision is set to expire in FY Beginning in fiscal year 2020, the Comptroller is directed to deposit 35 percent of the revenues collected from the tax imposed on the sale, use, or rental of a motor vehicle that exceed $5 billion to the SHF each year. This provision is set to expire in FY 2029 (Error! Bookmark not defined.). Revenue for Planning Projects The UTP (Error! Bookmark not defined.) uses revenues from the SHF, Oil and Gas Severance Taxes, Sales and Use Taxes, available concession and toll revenues, and funds from local entities. These funds are reserved for planning future projects as described in the UTP 88


89 (Figure 30). While the UTP is an essential planning tool that guides long-term transportation project development, it is not a budget and does not guarantee that a project will be built. SHF Toll & Concession Funds Prop 7: Sales & Use Taxes Prop 1: Oil & Gas Severance Taxes UTP Planning Scenario Local Funds Figure 30. Sources of Funds for Planning Projects. Table 35 lists the annual estimated state and federal funds allocated for planning projects designated in the UTP. The UTP also includes additional local funds that local entities plan to contribute in addition to the state and federal funds. Table 35 does not include these additional local contributions. A total of $5.2 billion in local funds are estimated over the 10- year planning period. 89
90 Table 35. Estimated Revenues Available for Planning Projects (in Billions$). SHF Toll/ Concession Funds Prop 1: Oil & Gas Severance Tax Prop 7: Sales & Use Tax Total FY18 $3.0 $0.0 $0.3 $1.7 $5.1 FY19 $3.1 $0.0 $0.6 $2.0 $5.7 FY20 $3.4 $0.0 $0.7 $2.3 $6.4 FY21 $3.5 $0.0 $0.7 $2.4 $6.6 FY22 $3.4 $0.0 $0.7 $2.5 $6.6 FY23 $3.6 $0.0 $0.7 $2.5 $6.9 FY24 $3.7 $0.0 $0.7 $2.6 $7.0 FY25 $3.8 $0.0 $0.7 $2.7 $7.1 FY26 $3.8 $0.0 $0.7 $2.7 $7.3 FY27 $3.8 $0.0 $0.7 $2.8 $7.3 Total $35.2 $0.1 $6.5 $23.7 $66.0 Alongside these revenue forecasts, the UTP contains a discussion of each project and program TxDOT intends to pursue during the UTP period. Additionally for each project and program, the UTP identifies the applicable funding category or categories from which the project or program is funded. TxDOT is required to distribute funds into the 12 prescribed funding categories listed in Table 36. A project s funding may be assigned from multiple funding categories, based on the type of project and its characteristics (Error! Bookmark not defined.). Table 36 lists the total funding authorizations for the 2018 UTP plan by funding category over 10 years. 90
91 Table UTP Funding Authorizations (in Billions). Funding Category 2018 UTP 10- Year Funding Authorizations 1 - Preventive Maintenance and Rehabilitation $ Metro and Urban Area Corridor Projects $ Non-Traditionally Funded Transportation Projects $ Statewide Connectivity Corridor Projects $ Congestion Mitigation and Air Quality Improvement $ Structures Replacement and Rehabilitation $ Metropolitan Mobility and Rehabilitation $ Safety $ Transportation Alternatives Program $ Supplemental Transportation Projects* $ District Discretionary** $ Strategic Priority*** $10.1 Total UTP Funding: Categories 1 12 $71.2 Source: (Error! Bookmark not defined.) *Category 10 includes Federal Earmark Match **Category 11 includes $1.0 billion district discretionary and $2.1 billion of energy sector funding. ***Category 12 includes $5 billion congestion funding for HOU, FTW, DAL, AUS, and SAT The impact of UTP funding categories can be sorted into six areas: maintenance (includes pavement and bridges), bridge, mobility, connectivity, safety, and other. Most categories of the UTP affect multiple impact areas. Figure 31 illustrates the progression of funds through the UTP. 91

92 Revenues SHF Toll & Concession Funds Prop 1: Oil & Gas Severance Tax Prop 7: Sales & Use Tax Local Funds UTP Planning Scenario Funding Categories 1-12 Figure 31. Project Funding Process. Projects Maintenance Bridge Mobility Connectivity Safety Other Of the total funds available for use in the UTP, nearly half are allocated for pavements and bridges. The remaining funds are planned for mobility, connectivity, safety, and other projects (Figure 32). 92


93 10% 6% Mobility 14% 40% 31% 9% Connect Safety Other Maintenance 30% Bridge Figure 32. Estimated Percent of 10-Year Funding Allocation, by Impact Area. Table 37 details the total funds planned for pavement and bridges for the 10-year planning period. Pavement funds total $25.5 billion while bridge funds total $5.6 billion over the 10- year horizon. Table 37. Pavement and Bridge Funding (in Billions$). Pavement Total Bridge Total Pavement and Bridge Total FY18 $2.3 $0.5 $2.8 FY19 $2.5 $0.5 $3.1 FY20 $2.9 $0.7 $3.6 FY21 $2.9 $0.7 $3.6 FY22 $2.4 $0.6 $3.0 FY23 $2.5 $0.5 $3.0 FY24 $2.5 $0.5 $3.0 FY25 $2.5 $0.5 $3.0 FY26 $2.6 $0.6 $3.2 FY27 $2.4 $0.5 $2.9 Total $25.5 $5.6 $
94 Pavement Pavement projects are funded either through the revenues allocated for UTP planning or through the maintenance program. Table 38 illustrates the revenue allotted to pavement projects in the UTP and the revenue allotted to pavement projects and work performed through the maintenance program (referenced as Maintenance Operations [Maint Ops]). Table 38. Pavement Funds (in Billions$). UTP Maint Ops Total FY18 $1.7 $0.6 $2.3 FY19 $2.0 $0.6 $2.5 FY20 $2.3 $0.6 $2.9 FY21 $2.2 $0.6 $2.9 FY22 $1.7 $0.7 $2.4 FY23 $1.8 $0.7 $2.5 FY24 $1.8 $0.7 $2.5 FY25 $1.7 $0.8 $2.5 FY26 $1.9 $0.8 $2.6 FY27 $1.6 $0.8 $2.4 Total $18.7 $6.8 $25.5 Revenues allotted for pavement projects can be further disaggregated to denote revenues available for NHS and Non-NHS pavement projects, both on- and off-system. Table 39 and Figure 33 demonstrates these divisions of funds over a 10-year period. 94


 38% 62% 57% Non NHS On System Off System 5% Figure 33.")
95 Table 39. Pavement Funding FY 2018 to FY 2022 (in Millions$). NHS Non-NHS Pavement On-System Off-System Total On-System Off-System Total Total FY18 $871 $1 $872 $1,288 $116 $1,404 $2,276 FY19 $964 $1 $965 $1,427 $128 $1,555 $2,521 FY20 $1,100 $1 $1,101 $1,628 $146 $1,774 $2,876 FY21 $1,099 $1 $1,100 $1,626 $146 $1,772 $2,872 FY22 $916 $1 $917 $1,355 $122 $1,476 $2,393 FY23 $971 $1 $972 $1,437 $129 $1,566 $2,538 FY24 $958 $1 $959 $1,417 $127 $1,544 $2,503 FY25 $955 $1 $956 $1,413 $127 $1,540 $2,497 FY26 $1,007 $1 $1,008 $1,490 $134 $1,624 $2,632 FY27 $919 $1 $920 $1,359 $122 $1,481 $2,401 Total $9,760 $10 $9,770 $14,440 $1,297 $15,736 $25,509 NHS (On System) 38% 62% 57% Non NHS On System Off System 5% Figure 33. Pavement Funding: NHS and Non-NHS, On- and Off-System. 95
96 Bridge Bridge projects are funded through the revenues allocated for UTP planning or through the Maintenance Division s maintenance operations budget. Table 40 illustrates the revenue allotted to bridge projects in the UTP and the revenue allotted to bridge projects through the maintenance program. Bridge funding through the UTP is primarily from Category 6: Structures Replacement and Rehabilitation. Several other categories within the UTP are often used to wholly or partially fund bridge projects although their exact level of bridge funding and impact on network performance vary from year to year. Table 40. Bridge Funds (in Millions$). UTP Maint Ops Total FY18 $479 $32 $511 FY19 $502 $32 $534 FY20 $689 $32 $720 FY21 $660 $32 $692 FY22 $534 $32 $566 FY23 $480 $32 $512 FY24 $498 $32 $529 FY25 $490 $32 $522 FY26 $520 $32 $551 FY27 $425 $32 $457 Total $5,279 $315 $5,594 As with pavement projects, revenues allotted for bridge projects can also be disaggregated to specify revenues available for NHS and Non-NHS bridge projects, both on- and off-system. Table 41 and Figure 34 present these divisions of funds over a 10-year period. 96


97 Table 41. Bridge Funding FY 2018 to FY 2027 (in Millions$). On- System NHS Non- NHS Bridge Off- Total On- Off- Total Total System System System FY18 $334 $5 $340 $131 $40 $171 $511 FY19 $348 $5 $353 $139 $42 $181 $534 FY20 $440 $7 $446 $209 $65 $274 $720 FY21 $439 $6 $445 $184 $62 $247 $692 FY22 $318 $6 $324 $179 $63 $242 $566 FY23 $270 $6 $276 $172 $64 $236 $512 FY24 $285 $7 $292 $172 $65 $237 $529 FY25 $273 $7 $279 $176 $67 $243 $522 FY26 $267 $5 $272 $206 $73 $279 $551 FY27 $192 $4 $196 $189 $72 $261 $457 Total $3,166 $58 $3,223 $1,757 $613 $2,371 $5,594 66% 34% 26% NHS (98% On System) Non NHS On System Off System 8% Figure 34. Bridge Funding: NHS and Non-NHS, On- and Off-System. 97
98 Bridge work planned via the UTP is primarily funded through Category 6: Structures Replacement and Rehabilitation. Several other categories within the UTP are often used to wholly or partially fund bridge projects; although their exact level of bridge funding and impact on network performance vary from year to year. The following programs are those most relevant to bridge management and network performance. Bridge projects funded outside of these programs are typically intended to improve congestion, mobility, or safety; though they may incidentally improve conditions on a case-by-case basis. Highway Bridge Program Most bridge replacement projects are funded through the Highway Bridge Program (HBP) within TxDOT s UTP, under Category 6: Structures Replacement and Rehabilitation. The HBP is managed by TxDOT s Bridge Division (BRG) and was developed to comply with the nowretired federal HBP. Additional information on the HBP can be found in the TxDOT Bridge Project Development Manual, Section 2.3 (29). The HBP has an annual allocation of approximately $230 million. A list of projects eligible for the HBP is identified by the BRG Project Development group and then provided to each of TxDOT s Districts for review. Districts respond with their priority ranking of HBP-eligible projects. The districts develop cost estimates for each eligible project identified by the district. As described in the TxDOT Bridge Project Development Manual, projects qualify according to the following eligibility requirements: 1. Bridge must be considered either FO or SD; and 2. Bridge must have a sufficiency rating (SR) equal to or below 80: a. If SR 80, the bridge is eligible for rehabilitation. b. If SR < 50, the bridge is eligible for replacement. After developing cost estimates, BRG allocates funding for bridges from the list of districtprioritized projects. Projects are ultimately prioritized by deficiency category and sufficiency rating. Allocations are made to SD bridges first and then FO. The list of potential projects is ranked by the lowest SR being top priority and so on. This project selection process is in most cases emblematic of a worst-first approach to asset management. On-system projects and off-system projects are budgeted and selected separately within the HBP. Approximately 75 percent of HBP funds are dedicated toward on-system structures, with the remaining 25 percent going toward off-system. There is no preference assigned to NHS structures or interstate structures all are considered for HBP funding based on the sufficiency rating and whether the bridge is SD or FO. From an initial list of eligible projects, BRG and Districts work together to determine an optimal collection of projects to program, taking into account life-cycle costs on a project-by-project level. 98
99 Life-cycle planning is used within the HBP to determine the best alternative for a structure at the end of its service life. When bridge assets approach the end of their service life, a lifecycle cost analysis is performed to estimate the cost-benefit ratio of each project alternative. Typical alternatives include replacement, rehabilitation, or preservation. A large majority of structures are replaced, with economics being the driving factor. With low construction costs in Texas, the cost-benefit ratio of replacing a bridge is typically high compared to improving it once the bridge reaches this point. Bridge Maintenance and Improvement Program The primary source of funding for bridge maintenance and repair work is TxDOT s Bridge Maintenance and Improvement Program (BMIP). Similar to the HBP, this program is administered by TxDOT s Bridge Division and funded through Category 6 of the UTP. The BMIP is relatively new and has been developed with the intent of deviating from the typical worst-first asset management. The program addresses bridge condition needs through repair and preventive maintenance projects that reduce life-cycle costs. Additional information on BMIP can be found in the Bridge Project Development Manual, Section 2.4 (29). The BMIP has an annual allocation of approximately $45 million. To be eligible for the BMIP, a bridge project must address structural issues resulting in a condition rating of 5 or 6 for the deck, superstructure, substructure, culvert, or channel NBI components. Additionally, the bridge is not eligible for BMIP if it is eligible for HBP funding. Specific work categories are listed below as examples of projects included and excluded by the BMIP. Figure 35, Figure 36, and Figure 37 show typical projects executed through TxDOT BMIP. 99

. Figure 36.")
100 Figure 35. Application of Polymer Overlay Deck Surface Treatment Project (SH 31 WB over Trinity River in the Tyler District). Figure 36. Typical Concrete Substructure Repair Project to Remediate Severe Column Spalling. 100
, the Bridge during the Painting (Top Right), and the Bridge after Being Reopened (Bottom Right).")
101 This image cannot currently be displayed. Figure 37. Typical Steel Painting Project, Showing Localized Defects (Left), the Bridge during the Painting (Top Right), and the Bridge after Being Reopened (Bottom Right). BMIP-Eligible Project Types include: Re-decking. Bridge raisings if the bridge has damage due to over-height impacts. Relief joints in concrete pavement and/or approach slab (limit of 40 ft from end of bridge). Approach guard fence, safety end treatment, and transition (up to 100 ft per bridge corner). Steel protective coatings. Post-tension repairs. Retrofits of two-column bents with installation of vehicle deflection/crash walls. Rail improvements/upgrades. 101
102 BMIP-Excluded Project Types include: Widening projects that require installation of additional substructure elements (Though minor widening in conjunction with deck replacement that can be accommodated using the existing substructure are be eligible). Bridge replacement. Debris removal-only projects (Though debris removal when addressing other structural defects may be eligible). Projects to address critical findings (The BMIP Committee may make exceptions to this rule in limited circumstances). BMIP funding is allocated for on-system structures only. There is no explicit preference for NHS or interstate structures, although Districts may prioritize high-volume corridors, which tend to be interstate and NHS projects. Crash wall improvement projects are generally identified for bridges that cross interstates or other major highways. The Bridge Preventive Maintenance Program The Bridge Preventive Maintenance Program (BPM) is managed by the Maintenance Division. Additional details on BPM scope and eligibility can be found in the Maintenance Management Manual, Section 4.9 (29). The BPM has an annual allocation of approximately $15 million. The Bridge Division is typically asked to assist in reviewing BPM projects, allowing for coordination of funds between programs and ensuring the following: 1) that no projects are being double-programmed; and 2) that each project is using the most appropriate funding program(s). For some large maintenance projects identified as BPM-eligible, those projects may be recommended for funding through the BMIP. The following are examples of BPM-eligible projects: Joint cleaning and sealing. Joint repairs. Steel piling repairs. Bearing and/or bearing pad replacement. Bearing supplements for T-Girders. Cap repairs for spalling. Pan and T-Girder bridges deck repairs. Concrete repairs for corrosion damage. Concrete deterioration treatments for prestressed beams. Asphalt plug joint. Bridge rail retrofits and transitions. Adjustment of steel shoes. 102
103 Installation of channel protection. Bridge painting. BPM funding is allocated toward on-system bridge projects only. As with TxDOT s HBP and BMIP, there is no explicit preference for NHS or interstate structures. Asset Valuation FHWA requires an estimate of asset value for NHS and any other pavement and bridge assets included in the TAMP. This TAMP includes all NHS and all other non-nhs state highway system pavement and bridge assets. A replacement cost method is used to derive asset valuations. Valuations are based on the FY 2016 inventory, which was the last data available at the time of the calculation. Estimated replacement costs include only material in place and do not include right of way, non-bridge drainage structures, and other appurtenances. The estimated replacement value of NHS system pavement assets is $46.9 billion, and the estimated replacement value of NHS bridges is $43 billion. Table 42 also includes pavement and bridge non-nhs valuations. Table 42. Asset Valuation. System On the State Highway System Bridge ($B) Pavement ($B) IH $9.1 $16.7 Non-IH NHS $23.9 $26.4 Non-NHS $17.2 $40.6 Off the State Highway System Non-IH NHS $1.7 $4.0 Total IH $9.1 $16.7 Non-IH NHS $25.6 $30.2 Pavement Valuation Table 42 shows a distribution of pavement asset values within the scope of this TAMP. Replacement values were determined through a process incorporating FY 2017 material and construction pavement layer costs and the inventory information. Representative pavement structures were synthesized, corresponding to the amount of traffic the 103
104 pavements must bear. Accumulated costs for the lane-mileage of each pavement structure was calculated using average pavement layer costs recorded in TxDOT s bid cost database. The value of shoulders was similarly appraised. Total pavement asset valuation is the summation of roadway pavement replacement costs, and where present, shoulder replacement costs. It is difficult to accurately quantify the value of off-system pavement assets, due to the lack of available data. Although the inventory is populated with these roadways, the replacement costs for many of these pavements are unknown. Off-system NHS pavements are assumed to be of similar structure (and cost) TxDOT roadways. For the TAMP, off-system inventory valuations were calculated using TxDOT layer costs and synthesized structures similar to TxDOT roadways. Bridge Valuation Bridges, like all public goods, provide a tangible value to stakeholders. While there are a number of ways to estimate the value of a bridge, perhaps the most widely used is replacement cost the equivalent amount of money needed to construct a new bridge exactly like the one being considered. Although there are limitations to this methodology, replacement cost is straightforward to understand and it provides an account of the true value lost by TxDOT if preservation is neglected for too long, making reconstruction necessary. Table 42 shows the value of bridge assets in Texas based on non-depreciated replacement cost in current dollars. These estimates take into account the total deck area in each inventory class (NHS/non-NHS and On-System/Off- System) and superstructure class (culvert, weathering steel, conventional steel, reinforced concrete, pre-stressed concrete, timber, and other). Unique construction costs per square foot were used for each superstructure class and aggregated to obtain network-wide estimates. ASSET CATEGORIES IH Non-IH NHS On-system Non-IH NHS Off -system Non-NHS state highways Investment Strategies The UTP contains a catalog of projects that are planned to be constructed and/or developed within the next 10 years. This document is used to identify projects leading to the STIP. Preliminary engineering work, environmental analysis, right-of-way acquisition, and design work are all included as project development activities. While the UTP is an essential planning tool that guides long-term transportation project development, it is not a budget and does not guarantee that a project will be built (Error! Bookmark not defined.). The investment strategies identified in this section support all department objectives but in particular those to, Deliver the Right Projects, Optimize System Performance, and 104
105 Preserve Our Assets. FHWA requires states to discuss how the plan s investment strategies collectively would make or support progress toward: 1. Achieving and sustaining a desired SOGR over the life cycle of assets. 2. Improving or preserving the condition of the assets and the performance of the NHS assets. 3. Achieving the state DOT targets for asset condition and performance of the NHS. 4. Achieving the national goals identified in statute. The investment strategy approach TxDOT has taken is one of fiscal constraint. Based on the funding projected to be available for pavement and bridges, scenarios are modeled to determine the ones most feasible to maximize performance of the assets at a minimum practicable cost. This statement is important since, as has been discussed, there are numerous competing priorities such that asset performance is not always the highest priority. Because of this, other desirable projects may be funded prior to very high ranking bridge and pavement projects to accomplish a competing objective. Each annual UTP adoption uses updated revenue forecasts and investment strategies that are based on past system performance and system key performance objectives. These forecasts guide funding distribution, project selection, and formation of the new UTP. After the UTP is adopted, the performance of the state s system is monitored and evaluated to help adjust the next update. Each year, this continual improvement process is used to identify the 10-year list of projects. Figure 38 illustrates this process. As a result of TxDOT planning and programming processes instituted many years prior, TxDOT has identified its investment strategies in many documents including: TTP SLRTP UTP. STIP. Annual Letting Schedule. 105

106 Figure 38. TxDOT System Performance Management Process. Each of these documents contains products or explanations of the planning and programming processes that represent TxDOT investment strategies. Figure 39 illustrates the timing of investment strategy development and the products delivered. Figure 40 and Figure 41 further elaborate on the planning process and identify how MPOs and other roadway owners participate in this process. The unique document for Texas that defines many of the investment strategy considerations is the UTP. This document identifies information with which analyses will be made and decision makers will have available to 106


107 ensure the most effective projects are delivered to meet the many state and federal objectives, including provisions for maintaining NHS asset in a state of good repair. Figure 39. Planning and Programming Documents and Products. Figure 40. Planning, Development, and Construction Process. 107
108 The UTP is a standalone document created annually and requires the Transportation Commission approval. Texas Transportation Code provides that TxDOT shall develop the UTP covering a 10-year period to guide the development of and authorize construction and transportation projects. Figure 41. Transportation Planning and Programming Processes. Each annual UTP adoption uses updated revenue forecasts and investment strategies that are based on past system performance and system key performance objectives. These forecasts guide funding distribution, project selection, and formation of the new UTP (Error! Bookmark not defined.). After the UTP is adopted, the performance of the state s system is monitored and evaluated to help adjust the next update. Each year, this continual improvement process is used to identify the 10-year list of projects. As presented in the Financial Plan and Figure 31 and Figure 42, funding sources available for projects are distributed into 12 separate funding categories. From these 12 categories, funding, shown in Table 39 and Table 41, for constructing, maintaining, and preserving pavement and bridge assets is made available. 108

109 109 Figure 42. TxDOT Funding Sources and Categories.
110 Specific projects for pavement and bridge work are identified at the local TxDOT district level addressing district priorities including maintaining the condition of roadways and bridges. Districts may analyze the impact of project prioritization to determine the optimal mix of project cost and impact on their region s or statewide roadway system performance. The optimization routines available through TxDOT s pavement management system, identified in Chapter 4, Life Cycle Analysis, are used to determine these impacts. Prioritized projects are submitted for funding consideration though TxDOT s Transportation Planning and Programming Division. Once projects are accumulated from all districts, a scoring process is used to rank and identify projects proposed to be funded. Fund expenditures are optimized to make the most use of leveraged federal and local funds by identifying combinations of projects that satisfy multiple TxDOT objectives. Technologies that use an Analytical Hierarchical Process are being piloted to assist with the optimization of funds and system performance. The UTP is a collaborative process between TxDOT, MPOs, the public, and other local transportation partners (Error! Bookmark not defined.) that evaluates system performance and directs resources where they are needed most. There are two approaches to development: a top-down or a bottom-up approach. Historically, funding has been distributed through the 12 categories in a top-down process. To be a purely performancedriven program, the project selection process would work from the bottom up assessing a financially unconstrained list of projects and selecting projects with the highest performance scores and return on investment, without regard to project type or location. However, to be fair and equitable to the entire state and meet the funding category mandates, TxDOT uses a hybrid approach. An evaluation tool is used to implement an iterative top-down and bottom-up approach to select projects that provide the best value, both statewide and locally. Identifying project-specific data that align a project s performance benefits with the statewide objectives is critical to this process. Data-driven criteria are established for each system key performance objectives used to quantify each project s contributions to system performance. This process helps objectively evaluate projects to be included in the plan. As input into the evaluation tool, each project s performance data are estimated for the relevant criteria. The evaluation tool combines the performance metric data with input from stakeholders on the relative weights of the system key performance objectives, and a performance-metrics scoring matrix, to predict the overall performance of the system of projects (Error! Bookmark not defined.). The tool provides a performance score for each project. According to the UTP, this process allows a fair comparison of the relative importance of each project. Using this tool, a program of projects can be analyzed, sensitivity analyses can be run, and projects can be selected and prioritized based on their performance scores. 110
111 Investment Strategies Pavements For pavements, TxDOT implemented the requirement for a Four-Year Pavement Management Plan. Every district is required to develop a comprehensive pavement management plan for all pavement related activities that is fiscally constrained. The plan covers all the routine maintenance, PM, LR, MR, and HR work for all the pavements within the district. The plans are reviewed annually by a committee established by TxDOT administration to ensure that the maximum maintenance resources are directed toward pavement operations and roadway related work to provide the maximum benefit to the agency. The Four-year Plan allows the district to appropriately allocate resources through long-term planning to meet their management objectives. From the plan, a district may identify their highest priority projects and work. Investment Strategies Bridges TxDOT places bridge management responsibilities primarily in the hands of its 25 districts. Traditionally, this has enabled each district to balance their specific needs with available funding and serve their community in a more responsive manner compared to a highly centralized management structure. One shortfall of this strategy is a lack of centralized analysis necessary for data-driven asset management on a system-wide level. Because asset management strategies vary from district to district, significant time and resources are necessary to sufficiently catalog usual management strategies and improve them. Tangible bridge management strategies will be included in successive versions of the TAMP. Bridge Management and Planning In developing and implementing the TAMP, TxDOT s Bridge Division will continue to bolster its understanding of bridge network performance and develop comprehensive investment strategies for future years. Ultimately, this development process will be supported by the use of a bridge management system solution as a primary LCP and network management tool. With the assistance of the Texas A&M Transportation Institute, TxDOT will develop a supplementary LCP tool. The Life Cycle Planning section of this plan describe his tool and its methodology in more depth. Bridge Management through Construction Historically, TxDOT has invested significant resources toward bridge construction (new construction and replacement projects). As a result, TxDOT has developed and maintained a robust set of design manuals, policies, practices, and standards, which all contribute toward relatively low construction costs and lengthy asset service lives. These and other economic 111
112 factors have contributed toward TxDOT s conventional wisdom that it is more expensive to rehabilitate a bridge than replace it. As the economic landscape of the state changes and the inventory grows older, this strategy may not be the most cost-effective for the network as a whole. Bridge Management through Preservation and Rehabilitation Consistent with other states and national efforts, TxDOT will be investigating additional investment strategy alternatives aimed at improving bridge preservation policies and reducing network deterioration trends. More specifically, TxDOT s Bridge Division will be quantitatively investigating overall project costs and service life benefits of various preservation and rehabilitation activities identified in the Life Cycle Planning Section of this plan. These activities include: Partial and full-depth deck replacement. Protective deck overlays (concrete, latex-modified concrete, and multi-layer polymer types). Deck joint cleaning and sealing. Deck joint replacement. Drainage system cleaning. Steel coatings and protective systems. Concrete repairs to superstructure, substructure, and culverts. Cathodic protection. Bearing cleaning, resetting, and replacement. Approach slab replacement. Superstructure replacement. Railing upgrades. Alongside the initial analysis of these preservation alternatives, TxDOT will be exploring opportunities to incorporate findings into its decentralized asset management business structure. TxDOT will determine strategic funding levels to dedicate toward each of the above efforts in subsequent versions of the TAMP. 112
113 Chapter 7: Gap Analysis and Enhancements Overview FHWA requires that state DOTs establish a process for conducting performance gap analysis to identify deficiencies hindering progress toward improving or preserving the NHS and achieving and sustaining the desired state of good repair (Error! Bookmark not defined.). The states are asked to identify the gaps and develop strategies to close or address the gaps. This document will address two types of gaps: financial and technical. Financial gaps are those gaps that relate to the ability of TxDOT to meet its asset performance goals as impacted by available funding. If insufficient funding is available to maintain the assets in a SOGR as defined by state performance criteria or FHWA criteria, a gap exists between present funding levels and the funding levels necessary to maintain the assets at the desired performance level. Asset performance is not only impacted by available funds but also by the effectiveness of its internal operations including: allocation of funds to various operating units, project selection criteria, project level repair alternatives, repair operations, and the integration of technology into its operations among other factors. Financial gaps are summarized below. Technical gaps are those gaps that are related to operational date sets, performance measurement systems, performance prediction models, management systems, LCP, risk analysis, communications, and other technical activities that allow TxDOT information and processes to be used to satisfy the requirement of the TAMP as defined by FHWA in various regulations. The gap analysis was primarily performed at the TAMP Working Group and SME Working Group level of the organization structure used to develop the TAMP (Figure 43). TAMP Working Group meetings were held every two weeks and a part of their agenda was devoted to the identification of gaps in the various elements of the TAMP as they were discussed. A list of these gaps was maintained as part of the meeting notes (minutes). SME Working Groups were also used to identify gaps that were reported during the TAMP Working Group meetings. 113

114 TxDOT Administration TAMP Steering Committee TAMP Working Group Pavements Subject Matter Expert Working Group Bridges Subject Matter Expert Working Group Figure 43. Organizational Structure for TxDOT TAMP Preparation. Financial Gaps Pavements Contributing Subject Matter Expert Working Groups Chapter 4 on LCP used TxDOT s PA (30) to determine the estimate the future performance of pavements with different funding levels. Figure 44 shows the results of this analysis. Note that this is the same figure as Figure 18 but repeated in this chapter for ease of reference. PA used TxDOT methods for measuring pavement condition, performance models, and decision trees. 114