RE-EVALUATION OF THE RECOMMENDED PLAN: UMR-IWW SYSTEM NAVIGATION STUDY INTERIM REPORT
|
|
|
- Valerie Charles
- 5 years ago
- Views:
Transcription


1 FINAL RE-EVALUATION OF THE RECOMMENDED PLAN: UMR-IWW SYSTEM NAVIGATION STUDY INTERIM REPORT March 2008
2 Congestion and capacity issues have not really been resolved, we have just been given a breather. We still have infrastructure that needs immediate attention and long term solutions We have a resource, sinking in disrepair, that could become a vital link in adding capacity and taking pressure off other modes in a vital corridor in the center of the country: the inland waterway system. The inland waterway system has been underutilized for many years and that portion of the industry has not seen much growth. The nation s waterway system needs to be revitalized and used more heavily to further impact congestion problems. Water transportation could become a vital resource to meet the nation s freight demands. Although it is not very prevalent now, waterways could even handle containers. Careful planning should ensure that the waterways are poised to handle more freight and that the entire support infrastructure is present to make efficient use of waterways. We should earmark funding to enhance our inland waterway system, modernize, and plan and build facilities to expand the range of products carried to include containers. There is a growing inland waterway and Great Lakes crisis that does not receive much coverage. For too many years there has been a lack of resources aimed at maintaining and improving this segment of our transportation network. A single barge traveling the nation s waterways can move the same amount of cargo as 58 semi-trucks at one-tenth the cost, reducing highway congestion and saving money This is an excerpt from a presentation to the National Press Club, Washington, DC, June 6, 2007 on the The New Face of Logistics by Rosalyn Wilson. The presentation is based on the 18 th Annual State of Logistics Report prepared by Ms. Wilson for the Council of Supply Chain Management Professionals.
3 REEVALUATION OF THE RECOMMENDED PLAN UMR-IWW SYSTEM NAVIGATION STUDY INTERIM REPORT EXECUTIVE SUMMARY PURPOSE The purpose of the Interim Report is to present findings on a reevaluation of the Recommended Plan from the UMR-IWW System Navigation Feasibility Study. The Chief of Engineers had sent endorsement of the Recommended Plan to the Assistant Secretary of Army for Civil Works [ASA (CW)] in December 2004 for review and approval. In response, the ASA (CW) requested reevaluation of the navigation component of the Recommended Plan using updated forecasting and transportation models and data. This report is in response to the ASA (CW) request. It also serves as a vehicle for communication with partners, stakeholders, and public. RECOMMENDED PLAN The Recommended Plan is a framework plan calling for dual-purpose operation, investment in navigation efficiency improvements and investment in ecosystem restoration of the Upper Mississippi River System (UMRS) toward a vision of long-term sustainability of the economic uses and ecological integrity of the Upper Mississippi River System. Although the focus of the reevaluation is on the economic viability of the navigation component of the Recommended Plan, reevaluation was done with appreciation of the integrated duality of the plan. BACKGROUND Our Nation s wealth, security, and productive capacity are directly and intimately linked to our ability to efficiently, reliably, safely, and securely transport freight in an environmentally-acceptable manner. Population growth and globalization are expected to underpin continued growth in freight both domestically and internationally through the entire planning horizon, 2010 to The growth in freight, coupled with increasing urbanization and personal transit, are putting great pressure on the national transportation network. Congestion is materializing as one of the single largest threats to our economic prosperity and quality of life. The U.S. Department of Transportation for the first time has called for reducing congestion as one of the goals in its transportation strategic plan for 2006 to Meeting the Nation s transportation challenges is going to require a multimodal approach: preserving what has been built; improving performance; adding capacity; and increasing intermodality. Steppedup investment will be needed in ports, terminals, border crossings, and all modes, including highways, railways, airways, and waterways, in order to meet the challenge. Government policies and investments are needed that encourage intermodal linkages and better utilization of available capacity and provide leverage for private investment and innovation. ES Page 1 of 6
4 The Inland Waterway System is one of the Nation s critical transportation networks. When combined with the Intracoastal Waterways and the Great Lakes, a large geographic area and a vast majority of the population of the United States are served by commercial navigation. Commercial navigation has advantages over other modes for transporting bulk materials in a cost effective manner. It also has overlap with other modes that provides for competition, redundancy, and intermodal opportunities. Investment has not been sufficient to maintain, recapitalize, and increase efficiency and capacity of the system, resulting in a system that is less reliable and not being optimally used. The UMR-IWW navigation system runs for 1,200 miles or 10 percent of the Inland Waterway System, and serves a five-state region. St. Louis, Chicago, and Minneapolis-St. Paul are the major metropolitan areas served directly by the system. Many smaller communities dot the river courses. The UMR-IWW has traditionally served as the primary conduit for international trade of grains produced in the five-state region. Over 50 percent of tonnage moved on the system consists of nongrain products. Since completion of the 9-Foot Channel Navigation Project in the 1940s the UMR- IWW has generated benefits far in excess of costs. It generates in excess of $1 billion of transportation cost savings annually to the Nation. These benefits compare with the annual operation and maintenance costs of approximately $115 million. Although tonnage increased substantially on the UMR-IWW from the 1940s when the UMR-IWW 9- foot channel became operational into the 1980s, since then it has run fairly flat. The flattening of tonnage on the UMR-IWW has paralleled a number of other occurrences that may have had some influence congestion on the system increased with usage; railways became much more efficient following deregulation in 1980 and competed aggressively for freight; agricultural export decreased for some of the period; and high ocean shipping rates in recent years made shipping by rail to the West Coast competitive with river shipping to the Gulf. In addition, corn is being used for the production of ethanol, decreasing the amount available for export. There are indications that traffic on the UMR-IWW will resume upward growth in the future, provided investment in Inland Waterways makes it a desirable option. Increasing freight demand will impact all modes, including waterways. This will lead to additional delays on the UMR-IWW Navigation System over the 50-year planning horizon adversely impacting the national economy. Rails easy gains in productivity following deregulation have largely played out; West (and East Coast) ports and vicinities are growing more and more congested with the increase in population and international trade; and Panama is moving ahead with expansion of the Panama Canal, which may lead to more freight moving through Gulf ports and more direct transit to Asian markets from the Gulf. In addition, roadway congestion may lead to more high-valued freight moving to rail, which may have a secondary shift of lower valued freight to waterways. The new forecasting and transportation models used in the reevaluation do not allow for a multimodal analysis of these possibilities. FORECAST AND REEVALUATION The reevaluation is presented in the Interim Report through four accounts National Economic Development (NED), Regional Economic Development (RED), Environmental Quality (EQ), and Other Social Effects (OSE) across the full range of potential freight utilization (Figure 1). All accounts are important in reaching conclusions and recommendations, but NED received the most consideration during this reevaluation in an attempt to overcome concerns expressed regarding the economic evaluation conducted during the Feasibility Study. A two-phase economic analysis was used for reevaluation. ES Page 2 of 6
5 The Corps traditional NED analysis looked at a high traffic scenario (HTS) and a low traffic scenario (LTS) to bracket a reasonable range of freight traffic. It was not possible to define a most likely traffic forecast. The benefit/cost ratio ranged from 1.3 for HTS to.4 for LTS conditions. As described in the following paragraph the traffic forecasts may be greater and benefit computations may under estimate what is computed through traditional NED analysis. Traditional NED analysis is largely a single mode approach in that adequate capacity and constant cost rates are assumed for alternative modes over the planning horizon. Traditional NED analysis does not include benefits from the relative economic impacts between modes relating to such things as congestion, environmental emissions, accidents (injuries, deaths, and damage to property), noise, and wear and tear on alternative modes. Although not in traditional NED analysis, these in fact are positive NED benefits for commercial navigation on the UMR-IWW. It may also happen that traffic is underestimated for LTS and HTS conditions modeled, if multimodal relationships change and the assumptions of constant cost rates on alternative modes are not valid. The second phase of NED economic analysis addresses these multimodal considerations qualitatively through what is termed the multimodal transportation scenario (MTS). The MTS is a qualitative characterization of how traffic on waterways, and the UMR in particular, might be affected by happenings in domestic and global trade and other aspects of the transportation system that are not adequately addressed through current models. The MTS includes generally accepted projections of increasing freight demand and international trade; continuing rapid growth in intermodal traffic (containers); increasing congestion at East and West coast ports and land gateways with Mexico; growing congestion on highways; expanding rail capacity becoming more difficult and costly; and expanding capacity of the Panama Canal. Although not quantified, MTS would result in more traffic and higher benefits. There are other scenarios that would drive traffic on the UMR-IWW lower than the LTS forecast. Some of the events that would lower traffic and benefits are less agricultural export than predicted for LTS due to less land used for grain production and more land used to support domestic biofuels, locally consumed agricultural products, and urbanization; unsustainability of current farm practices leading to lower grain yields; lower forecasts for non-grain freight; and greater reliance on highway and railway traffic to move freight with the expectation that these are preferred modes. The reevaluation effort assumes that all of these scenarios are adequately covered by the MIN condition (Figure 1), which has a benefit-cost ratio of 0.2 for a flat traffic condition. The other three accounts (RED, EQ, and OSE) are overwhelmingly positive for the integrated, dualpurpose Recommended Plan. They do not have uncertainty that would put positive expectations at risk. The integrated, dual-purpose approach has NED benefits that are not covered by the traditional quantitative and non-traditional qualitative analysis in this reevaluation. RISKS Risk and uncertainty, which is inherent in trying to project freight traffic and transportation needs 50 years into the future, was explored from a number of perspectives: Does the Recommended Plan make sense as a waterways project? Are there reasonable expectations that NED will be positive? Are there other national and regional benefits? Are risks and consequences associated with implementing the Recommended Plan fewer than risks and consequences associated with not implementing it? ES Page 3 of 6
6 The locks being addressed in the Recommended Plan represent some of the most congested on the inland waterway system and lack the redundancy provided by two lock sites. The Recommended Plan meets planning and project objectives of efficiency, effectiveness, completeness, acceptability, sustainability, reliability, safety, and adaptability and is a priority project of the Inland Waterway Users Board, which recommends how funds in the Inland Waterway Trust Fund are invested. The range of NED benefits predicted through the Corps traditional analysis are inconclusive as to whether the future with project condition will result in positive economic benefits to the Nation. However, when consideration is given to nontraditional NED benefits and expectations for increasing traffic and congestion across the national transportation system, the need for continuing investment in waterway capacity and efficiency becomes more evident. There are reasonable expectations that NED will be positive. Formulation of the dual-purpose Recommended Plan to achieve long-term sustainability of the economic uses and ecological integrity of the UMRS has largely mitigated environmental and social risks. In fact, implementation of the Recommended Plan will result in a healthier ecosystem and improved quality of life for citizens. The only outstanding risk associated with implementing the Recommended Plan relates to the level of system utilization for freight transportation, but even that risk is limited by the cost of the first increment of the Recommended Plan. Under-investing in the national transportation system and investing in projects that have not been integrated with other aspects of the natural and human environments are likely to have serious economic, environmental, and social impacts. Under-investing in waterways will result in a lesser role for waterways in carrying freight in the future, which will put more pressure on alternative modes, modes that have more environmental and social impacts. CONCLUSIONS The feasibility study was restructured in 2001 from a single purpose navigation efficiency study to an integrated, dual-purpose navigation efficiency and ecosystem restoration study. The success of the restructuring is evident by continued strong support for the Recommended Plan from partners, stakeholders, and the public representing a broad spectrum of interest in the UMRS. The Recommended Plan aligns with the Congressional designation of the UMRS as a nationally significant ecosystem and a nationally significant commercial navigation system and with the publics expectations for sustainable balance between economic and social uses of the UMRS and healthy ecosystem. The Recommended Plan meets planning and project objectives and aligns with national transportation goals and objectives. The multimodal qualitative assessment done as part of the reevaluation effort reveals that investment in transportation efficiency and capacity will need to increase at a greater rate in the future in order to meet anticipated increases in freight demand and personal transit, stay internationally competitive, and sustain the quality of life Americans have come to enjoy. Although it is uncertain what the role of waterways, and the UMR-IWW in particular, will be in addressing the Nation s future transportation needs, there are future scenarios that are consistent with the broader trends in global trade and transportation and that would lead greater utilization of waterways and positive addition to substantial National Economic Development. From a risk perspective, the Recommended Plan is a resilient plan. Of the four evaluation accounts (NED, RED, EQ, and OSE) possibility of negative consequences exists only in NED. All other ES Page 4 of 6
7 accounts will, without question, produce net benefits. The greatest possible economic loss is limited by the cost of the first increment of navigation improvements. The reevaluation, although it did not reduce uncertainty in traffic forecasts over the planning horizon, did provide greater insight through improved models, additional data collection, and qualitative considerations. The results of the revaluation are consistent with results from the original feasibility study. RECOMMENDATIONS The Commanders of the St. Paul, Rock Island, and St. Louis USACE Districts agree with the process used to conduct the reevaluation and the content of this interim report. They reaffirm their recommendation for approval of the Recommended Plan as the appropriate plan for improving navigation efficiency of the UMR-IWW and ecosystem restoration of the UMRS, and immediate implementation of the first increment. The Commanders support continued adaptive implementation of the Recommended Plan and for Corps action in areas of collaboration and research. Reaffirm their recommendation for approval of the dual-purpose Recommended Plan, as presented in the Report of the Chief of Engineers, 15 December 2004, including immediate implementation of the first increment. Support USACE participation in interagency and public/private coordination, collaboration, and investigation to increase utilization and intermodal connectedness of the UMR-IWW Navigation System. Support within the context of the Corps of Engineers navigation program, investigations into improving navigation logistics, safety, security, and efficiency through advanced technologies and management practices. Support development of understanding and tools for the evaluation of navigation projects as part of the multimodal national transportation system through the Navigation Economics Technologies Program. ES Page 5 of 6
8 Range of Possible Traffic Forecasts Low High Change in Drivers Reasonable Range Traditional Increasing Constraints Policies to Increase Utilization Flat or Falling Traffic MIN (0.2 BC or less) LTS (0.4 BC) HTS (1.3 BC) MTS Optimum System Utilization MAX LTS Low Traffic Scenario HTS High Traffic Scenario MTS Multimodal Transportation Scenario ES Page 6 of 6
9 REEVALUATION OF THE RECOMMENDED PLAN UMR-IWW SYSTEM NAVIGATION STUDY INTERIM REPORT Table of Contents SECTION Number of Pages Introduction 10 Chapter 1 National Freight Transportation System 6 Chapter 2 The Inland Waterway System and the Upper Mississippi River System 13 Navigation Traffic Forecast and Evaluation 68 Chapter 4 Risks, Conclusions, and Recommendations 8 References 4 Table of Contents Page i
10 This page intentionally blank.
11 INTRODUCTION PURPOSE The purpose of this Interim Report is to present findings from a reevaluation of the Recommended Plan proposed in the Final Integrated Feasibility Report and Programmatic Environmental Impact Statement for the Upper Mississippi River Illinois Waterway (UMR-IWW) System Navigation Feasibility Study, 24 September 2004 (Feasibility Report), with emphasis on the economics of navigation efficiency improvements and export markets. Reevaluation is included as a provision of the Recommended Plan as a means to manage risk associated with an uncertain future. Project delivery for the first increment of improvements, including seven 1200-ft locks, is a lengthy process and allows for reevaluation as new data and tools come available. It was expected that reevaluation would be done 5 to 7 years after completion of the feasibility study, but instead is being done now at the request of the Assistant Secretary of Army for Civil Works [ASA (CW)]. The reevaluation uses updated data and newly developed economic forecasting models. This report is in response to the ASA (CW) request. It also serves as a vehicle for communication with partners, stakeholders, and public. The reevaluation was conducted under the authority of Section 216 of the Flood Control Act of 1970; the same authority under which the study leading to the Recommended Plan was completed. RECOMMENDED PLAN The Recommended Plan is a framework plan calling for dual-purpose operation, investment in navigation efficiency improvements and investment in ecosystem restoration of the Upper Mississippi River System (UMRS) toward a vision of long-term sustainability of the economic uses and ecological integrity of the Upper Mississippi River System. Although the focus of the reevaluation is on the economic viability of the navigation component of the Recommended Plan, reevaluation was done with appreciation of the integrated duality of the plan. A description of the Recommended Plan is included in Figure 2. Figure 3 presents an abbreviated assessment of the Recommended Plan against the project and planning objectives from the feasibility study. FEASIBILITY STUDY ( ) In the Water Resources Development Act (WRDA) of 1986 (Public Law ), Congress designated the UMRS a nationally significant ecosystem and a nationally significant commercial navigation system, the only river system in the nation given this distinction. Congress stated that the UMRS shall be administered and regulated in recognition of its several purposes. Although the river has long been used for multiple human purposes and long appreciated for its ecological significance, Congress, through its statements in the 1986 WRDA, recognized the need for improving integrated management in order to sustain the economic value and ecosystem health of the UMRS for generations to come. Introduction Page 1 of 10
12 The study area is the UMR-IWW Navigation System and the UMRS ecosystem. Navigation of the UMR-IWW has been a vital component of regional and national settlement and economic development. Navigation improvements date back as early as the 1820s beginning with removal of snags, shoals, and sand bars, and the confinement of flow to the main channel. The existing 9-foot Channel Navigation Project was largely constructed in the 1930 s and extends down the UMR from Minneapolis-St. Paul to its confluence with the Ohio River and up the Illinois Waterway from its confluence with the UMR to Thomas J. O Brien Lock in Chicago. It includes 37 Locks (29 on the UMR and 8 on the IWW) and approximately 1,200 miles of navigable waterway with portions of Illinois, Iowa, Minnesota, Missouri, and Wisconsin. The UMRS ecosystem includes the river reaches described above as well as the floodplain habitats that are critically important to large river floodplain ecosystems. The total acreage of the river-floodplain system exceeds 2.5 million acres of aquatic, wetland, forest, grassland, and agriculture habitats. The Mississippi Flyway is used by more than 40 percent of the migratory waterfowl traversing the United States. These Trust Species and the threatened and endangered species in the region are the focus of considerable Federal wildlife management activities. In the middle and southern portions of the basin, the habitat provided by the mainstem rivers represent the most important and abundant habitat in the region for many species. Use and performance of the 9-Foot Channel Navigation Project has been a phenomenally successful transportation investment, far exceeding original expectations. It generates in excess of $1 billion of transportation cost savings annually to the Nation. These benefits compare with the annual operation and maintenance costs of approximately $115 million. Increasing freight traffic and much larger tow configurations, which require double lockage through the original 600-foot lock chambers, has led to a number of initiatives to increase capacity and efficiency of the system, including completion of 1,200-foot locks at Lock 27 in 1953; Lock 19 in 1956; Lock 26 in 1990; and a 600-foot lock at Lock 26 in However, construction of the 9-Foot Channel Navigation Project and its success as a commercial transportation system, combined with the impacts from other human activities, has adversely affected the river and floodplain ecology. The UMRS will continue to degrade unless appropriately managed through a multi-agency approach. In 1993, a navigation study of the entire UMR-IWW system was initiated to investigate transportation capacity and efficiency issues as well as to better understand transportation and other human use impacts on the river and floodplain ecosystem. The study was restructured in 2001 as an integrated, dual-purpose study for navigation efficiency and ecosystem restoration. The principal navigation problem addressed by the study is the potential within the 50-year planning horizon for significant traffic delays on the UMR-IWW beyond the delays that currently exist. The principal environmental problems addressed by the study are the changes to ecosystem structure and function that have occurred over many years from many causes, but especially since initiation of the operation and maintenance of the existing Nine-Foot Channel Navigation Project. The future without-project condition defines what the likely and foreseeable conditions will be for the system in the absence of Federal action resulting from this study. It serves as a baseline against which alternative plans are evaluated. A scenario-based approach was used for traffic forecasting, which resulted in multiple representations of the without-project condition for navigation. It was assumed that some Federal and non-federal actions would take place independent of actions resulting from the study, including the continued maintenance and rehabilitation of the existing system. The ecosystem is expected to continue to deteriorate for the without-project condition. The level of authority and authorized appropriations in the Environmental Management Programs and other Federal and non-federal programs and limited environmental management activities available under a Introduction Page 2 of 10
13 single-purpose navigation project have been insufficient to meet environmental needs on the UMRS. Without Federal action, degradation will continue in the future. Formulation of navigation efficiency alternatives began by identifying measures that would contribute to a safe, reliable, efficient, and sustainable UMR-IWW Navigation System over the planning horizon of 2000 to Small-scale measures, new 1,200-foot locks, and 1,200-foot lock extensions were investigated. Longer locks, 1,200-foot versus current 600-foot, will allow the largest tow configurations to pass through a lock in a single lockage. The measures were used to form alternatives for evaluation and comparison. Formulation of ecosystem restoration alternatives began by identifying broad ecosystem restoration goals that meet the planning objective of addressing cumulative impacts including ongoing effects of the operation and maintenance of the UMR-IWW Navigation System and developing subordinate objectives. These objectives were used to identify suitable types and numbers of ecosystem management and restoration measures. The measures were used to form five alternatives for evaluation and comparison. The alternatives were evaluated using the system of five primary accounts established in the Economic and Environmental Principles and Guidelines for Water and Related Land Resources Implementation Studies (P&G): 1) National Economic Development (NED); 2) its environmental equivalent National Ecosystem Restoration (NER); 3), Regional Economic Development (RED); 4), Environmental Quality (EQ); 5), and Other Social Effects (OSE). The accounts relating to the navigation component are defined and updated in of this reevaluation report. The NED benefits for the navigation improvements were evaluated using a scenario-based analysis utilizing five traffic scenarios and economic model conditions. This combination of scenarios and models reflects the uncertainty associated with projecting traffic. More information is available in the Chief of Engineers Report to the Secretary of the Army, 15 December 2004, and the Final Integrated Feasibility Report and Programmatic Environmental Impact Statement for the UMR-IWW System Navigation Study, 24 September APPROACH The reevaluation of the Recommended Plan is presented in this Interim Report through four traditional evaluation accounts 1) National Economic Development (NED); 2) Regional Economic Development (RED); 3) Environmental Quality (EQ); and 4) Other Social Effects (OSE) across a range of possible futures, and in the context of the national freight transportation system. The national freight transportation system is highly complex and decentralized and shaped by a multitude of public and private decisions that are made independently over time. Decisions by one entity are influenced by government policies, decisions of others, and expectations for freight demand. Capital investments in transportation take a long time to implement. The full stream of benefits from implementation of the Recommended Plan will not begin until after Innovations and technological change continue to affect markets and freight movement. The reevaluation through a combination of quantitative and qualitative considerations attempts to bring understanding to potential benefits and risks of either implementing or not implementing the Recommended Plan. The Interim Report is presented in four chapters. Chapter 1 addresses the breadth and nature of the national freight transportation system, including importance, national freight transportation objectives, salient characteristics, current state of acceptability, and general projections of freight demand, drawing heavily on recent reports by the U.S. Department of Transportation (USDOT) and others. Introduction Page 3 of 10
14 The purpose of Chapter 1 is to provide understanding of the national freight transportation system and of trends in the global economy and context for considering merits of the Recommended Plan. Chapter 2 follows with a more detailed look at the Inland Waterway System and the UMR-IWW as a subset of it. The purpose of this chapter is to provide understanding of the role of waterways as a component of the national transportation system and to provide context for considering the merits of the Recommended Plan. updates forecasts and evaluations from the Feasibility Study, using updated economic data and models, revised scenarios, and other refinements. The reevaluation, which includes both quantitative and qualitative assessments, is presented through the four accounts: Analysis for National Economic Development (NED) includes two complementary and additive phases. The first updates the navigation traffic forecasts and evaluation accomplished as part of the Feasibility Study using updated data and forecasting tools. This first phase meets criteria established in Corps guidance for economic evaluation of proposed navigation projects. Analysis in this phase establishes a reasonable range of traffic outcomes, bracketed by a low traffic scenario (LTS) and a high traffic scenario (HTS). In this phase of analysis the potential impacts of increasing congestion in some aspects of the transportation system; impacts of noise, safety, infrastructure wear and tear, emissions and environmental impacts relative to other modes of transportation; and impacts of system reliability and other considerations on willingness to use or invest are not considered. The second phase of the economic analysis addresses some of these issues through development of the multimodal transportation scenario (MTS). Regional Economic Development (RED) consists of economic benefits that do not necessarily increase NED, but do provide economic benefits or costs to a particular region of the country. Regional impacts may have national significance by addressing social issues that are of particular concern to the Nation, and which are expected to affect the long-term welfare of the Nation. The reevaluation investigates some aspects of RED associated with implementing the Recommended Plan (such as impacts from investment in construction of the projects, from changes in transportation efficiency, and from changes in competition between modes), but not all (such as impacts from induced private and public investment in ancillary transportation infrastructure). Environmental Quality (EQ) of the navigation component of the Recommended Plan was investigated during the Feasibility Study for both site-specific and systemic impacts on the natural environment and historic properties. A plan to avoid, minimize, and mitigate negative impacts was developed as part of the Feasibility Study and included in the Recommended Plan. Although the reevaluation is focused on the navigation component of the Recommended Plan, the plan is in fact a dual-purpose integrated plan that supports both the economic uses and ecological integrity of the Upper Mississippi River System through a sustainable management approach. This approach will produce benefits that are not captured through investigation of the navigation efficiency component of the Recommended Plan alone. Dual-purpose operation positively impacts all four accounts NED, RED, OSE, and EQ. Other Social Effects (OSE) is looked at through three elements, all of which have both regional and national significance: international competitiveness, national security, and quality of life. International competitiveness addresses the need for efficient, reliable, and low cost transportation in order to compete on a global basis. National security addresses the role of waterways in making the national transportation network resilient and responsive in times of national emergency. Quality of life considers impacts on the human environment and sense of wellbeing. Areas investigated include emissions, accidents, noise, traveler delays, recreation, and aesthetics. Introduction Page 4 of 10
15 In each account, the consequences of implementing the Recommended Plan versus not implementing it are explored. At one extreme, consequences are limited by the cost of the project under a condition where freight is flat or declining (MIN). At the other extreme, consequences are limited by optimum utilization of freight capacity that would be added through implementation of the Recommended Plan (MAX). Three scenarios between the two extremes are explored. Two of the scenarios, the LTS and the HTS, bracket a reasonable range of outcomes under the assumption that constraints in the national freight transportation network are at equilibrium and will not change over time, i.e., alternative modes have unlimited capacity at current rate. A third scenario, the MTS, explores the potential for more freight moving to waterways due to growing constraints on roadways, railways, and East and West Coast ports. In addition, consideration is given to opportunities to facilitate greater utilization of waterways and more effective inter-modal connection with railways and roadways as recommended in the U.S. DOT s Framework for a National Freight Policy (April 2006 draft). A schematic of this risk-based approach is presented in Figure 1. The purpose of is to provide an orderly assessment from which conclusions can be drawn on how to proceed with the Recommended Plan and or reevaluation effort. Chapter 4 summarizes findings and results and brings the reevaluation to conclusion with an updated recommendation. As with the Feasibility Report, no attempt was made to reduce the economic forecast to a single benefit-cost comparison or to present forecasts probabilistically. Recommendations are presented in a risk-informed decision-making framework that contrasts a range of consequences possible from either implementing the Recommended Plan or not implementing the Recommended Plan. Conclusions and recommendations in this report are based on whether or not the Recommended Plan should be part of the multimodal mix of public and private transportation investments to be made over the next 10 to 15 years for the benefit of the next 50 years or more. TRAFFIC MANAGEMENT Although the reevaluation does not address non-structural measures beyond those called for in the Recommended Plan (moorings and switchboats), additional investigations into non-structural traffic management considerations have been accomplished since completion of the feasibility. There is considerable interest in government and business to improve traffic management for waterways. Investigations since completion of the feasibility study are consistent with results of that study. Although traffic management is not a substitute for the Recommended Plan, traffic management innovations do show promise for improving reliability, reducing transit time for select vessels (those that would have priority permits), and tracking shipments. These features would be of most value to the movement of higher valued and more time sensitive products. These measures will gain in importance as the Nation looks for ways to address the growing demand for freight transportation. An initial investigation into appointment scheduling has been completed under the Corps Navigation Economics Technologies (NETS) Program and augmented with some additional investigation during preconstruction engineering and design of the Recommended Plan. Results showed minor reduction in delays under some sequencing rules at forecast traffic levels, but would require imposing preferences of some vessels over others. The effort explored tow configurations and upbound/downbound sequencing, but did not consider cargo type or other attributes. Additional investigations, development, and testing are planned. To a large degree, lockmasters already utilize the concepts in mitigating congestion. Introduction Page 5 of 10
16 A tradeable permits concept has also been investigated under the NETS program. Under the concept, permits having different levels of locking priority would be issued. Holders of permits with different levels of priority would be free to trade with each other. The idea is to provide a mechanism for shipments that benefit from faster transit time and greater reliability to trade for higher priority. The concept warrants continued study, especially in anticipation of inland waterways being used in the future to transport higher valued, more time sensitive cargo and by specialized vessels for transporting container. There are many considerations that would have to be addressed in development of a tradeable permits concept. The Corps is committed to investigating, testing, and deploying lock guidance systems. The primary benefit of such systems is reduction in lockage risk by giving pilots visual aids and data during lock approaches, which should result in safer operation and fewer, less serious impacts with lock facilities. Other investigations through government and private industry are exploring systems for tracking vessels and cargo, which should improve inter-modality and supply chain management. LIMITATIONS The most significant limitation to reevaluation is the inherent uncertainty in forecasting 50 years into the future. Other limitations, some of which are listed here, make it difficult to explore this uncertainty. The models do not have full spatial-equilibrium capability. A spatial equilibrium methodology is used for grain movements, but not for non-grain commodities. The models are largely single mode. Models assume that intermodal relationships are in static equilibrium for the duration of the planning horizon. Multimodal considerations were accomplished through a general, qualitative approach. The Corps traditional NED analytical framework does not include all categories of benefits that are proposed as a standard for transportation projects across modes. Scenario development and sensitivity analysis was limited. The LTS and HTS scenarios are not well-developed presentations of potential future conditions and relationships. They are largely the creation of the developers of the grain model and non-grain forecasts based on past or near term trends and expectations. The study team modified some of the more dynamic parameters to arrive at a high and low traffic scenario for grain and created a highlow range around the non-grain forecast. Shipper surveys may not have captured a true understanding of shipper responses relative to different conditions. Furthermore, data gathered on time and reliability was not used in analysis. Data from these surveys were assumed to remain valid over the planning horizon. Aggregations and assumptions were made to simplify analysis. These limitations probably do not severely impact the quality of short-term (5 to 10 years) projections and analysis, but they limit the ability to explore a future as expansive as the 50-year planning horizon for this study where infrastructure construction is going to take 15 years to complete. The set of tools Introduction Page 6 of 10
17 available for this evaluation did not allow for quantitative assessment of changes that are likely to affect the current equilibrium. Changes could be significant. The qualitative multimodal analysis provides context for understanding the traditional economic analysis and provides a means for better understanding the impacts of changes occurring in markets and the transportation network. In all, the reevaluation increased understanding of the potential and resiliency of the Recommended Plan and the consequences of potential outcomes. INDEPENDENT REVIEW Re-evaluation products and initial draft report were subject to external peer review (EPR) by experts external to the Corps as well as an independent technical review (ITR) by Corps experts who were not involved in the planning or design of the project. Partners and stakeholders were provided an opportunity to comment on the re-evaluation products and initial and final drafts of the report. Opportunities were provided the EPR Panel, ITR Team, and partners and stakeholders to participate in three special workshops-meetings to hear about and question different aspects of the re-evaluation from those who developed the tools and who used them in analysis. Management of these reviews was through the Corps Planning Center of Expertise for Inland Navigation (PCXIN). The purpose of the External Peer Review (EPR) Panel was to provide external technical expertise in the review and evaluation of the forecasting models, inputs, results, and documentation used in the reevaluation of the Recommended Plan. The EPR Panel was a five-person interdisciplinary panel with broad capabilities in economic analysis; agricultural trade and markets; waterway, rail, and truck transportation; and environmental impacts. The panel did not review engineering or design-related issues pertaining to navigational or river improvements. Although the EPR process was not structured to produce consensus, consensus viewpoints emerged in some areas, but there were also divergent views. The panel expressed both consensus and divergent views in a summary report, which it completed after review of the initial draft report. All comments received on the various panels were answered by the Re-Evaluation Team. Adjustments to the report were made between the initial and final drafts and between the final draft and final report. The EPR Panel acknowledged that the Corps has made significant progress in developing forecasting and economic tools: the Interim Report shows major accomplishments and progress in the models used for NED benefit computations - especially with respect to grain traffic forecasting and shipper demand analysis - as compared to the former TCM approach. The EPR Panel identified the inability to explicitly model the multimodal transportation system and the reactions of other modes to changes in the waterway system as the greatest limitation of the reevaluation study. Although the Panel acknowledged qualitative considerations of the multimodal environment was a step in the right direction, the Panel also recognized that there is no mechanism in the Corps' approach to adjust the forecasts for multimodal considerations. The External Peer Review Summary Report and Corps' Response are posted on the internet at under Reports. Introduction Page 7 of 10
18 Range of Possible Traffic Forecasts Low High Change in Drivers Reasonable Range Traditional Increasing Constraints Policies to Increase Utilization Flat or Falling Traffic MIN (0.2 BC or less) LTS (0.4 BC) HTS (1.3 BC) MTS Optimum System Utilization MAX LTS Low Traffic Scenario HTS High Traffic Scenario MTS Multimodal Transportation Scenario Figure 1. Schematic of Risk-Informed Decision-Making Framework for Reevaluation Introduction Page 8 of 10
19 THE RECOMMENDED PLAN The Recommended Plan is a 50-year framework for modification and operational changes to the Upper Mississippi River and Illinois Waterway System to provide for navigation efficiency and environmental sustainability, and to add ecosystem restoration as an authorized project purpose. The integrated, dual-purpose plan will provide flexibility in managing operation and maintenance of the system for both navigation and the environment. The integrated, dual-purpose plan will be implemented through an adaptive approach that will include an incremental implementation strategy paired with periodic checkpoints requiring future reporting to the Administration and Congress. The Corps of Engineers will administer the plan in full collaboration with the other Federal and State agencies involved in management of the UMRS. The recommended navigation improvement framework includes small-scale structural and non-structural measures, new 1200-foot locks and lock extensions, and appropriate measures to avoid, minimize, and compensate for environmental impacts at a first cost of $2.59 billion at October 2004 price levels plus annual switch boat operation costs of $19.4 million. The first increment proposed for immediate implementation at a first cost of $2.03 billion includes: Small-scale measures ($218 million, including site specific mitigation) Mooring Facilities at 7 lock and dam sites ($11 million) Switchboats at Locks & Dams 20 through 25 in phased approach ($207 million for first increment) 7 new 1200-foot locks at Locks & Dams 20, 21, 22, 24, 25 on the UMR and LaGrange and Peoria on the IWW ($1.66 billion, including $200 million for site-specific and system mitigation) with decision points for adaptive implementation. In accordance with Section 102 of the Water Resources Development Act of 1986, one-half of the cost of navigation improvement construction shall be paid from the amounts appropriated from the general fund of the U.S. Treasury and one-half from amounts appropriated from the Inland Waterway Trust Fund. Other features of the Recommended Plan (extensions of Locks 14, 15, 16, 17, and 18 and switch boats at locks 11, 12, and 13), will be revisited through an update of the feasibility study, which will be done a few years prior to completing the first increment. The recommended ecosystem restoration framework consists of an estimated 1009 individual projects with a combined first cost of about $5.72 billion at October 2004 price levels. The first increment proposed for immediate authorization includes: An estimated 225 projects with a combined first cost of $1.58 billion. The cost of projects proposed for implementation at full Federal expense is estimated at about $1.28 billion. The first cost of the cost shared floodplain restoration projects is estimated at about $299 million with a Federal cost of about $194 million and a non-federal cost of about $ 105 million. Total operation, maintenance, replacement, repair, and rehabilitation (OMRR&R) costs for these projects, over a 50-year project life are estimated at $82 million. OMRR&R costs will be the responsibility of the agency with management responsibility for the land on which the project is located or with operation and maintenance responsibility for the existing structure being modified. Ecosystem restoration will be accomplished through an adaptive management process. Figure 2. Description of the Recommended Plan Introduction Page 9 of 10
20 PROJECT & PLANNING OBJECTIVES FOR THE RECOMMENDED PLAN (NAVIGATION) Efficiency and Effectiveness: Implementation of the Recommended Plan will result in a marked improvement in system operational efficiency by reducing bottlenecks, adding system capacity, making lockage more efficient, and by eliminating functional obsolescence at specific project sites through addition of locks that accommodate 15-barge tows. Project design is matched with anticipated growth in demand and takes advantage of existing infrastructure to the maximum extent. Level of performance (e.g. filling and emptying times), potential demand, and project costs were integrated to arrive at an optimum balance. Efficiency and effectiveness will be magnified to the extent that the Recommended Plan encourages greater utilization of UMR-IWW and other segments of the inland waterway system, which increases Return on Investment for the entire inland waterway system, reduces the amount that will need to be invested in alternative modes, and reduces environmental and social impacts that other modes have on society to a greater extent than water. Completeness, Acceptability, and Sustainability: Five aspects assure the Recommended Plan is a complete, acceptable, sustainable project: formulation at a system level; extensive investigation of environmental impacts; consideration of regional and social impacts; formulation as a dual-purpose, integrated plan; and collaboration with stakeholders and partners. Sustainability is viewed as the balance of economic, ecological, and social conditions so as to meet the current, projected, and future needs of the UMRS without compromising the ability of future generations to meet their needs. An assessment of cumulative effects was conducted using an interdisciplinary team of experts and archival information concerning changes in the system since construction of the 9-Foot Channel Navigation Project. The cumulative effects assessment provided the context against which to consider both the extent and significance of any direct or secondary effects that may result from the alternatives. This effort also contributed important information on the likely future (without project) condition of the UMRS ecosystem. This objective guided the development of alternatives for ecosystem restoration including modifications to the operation and maintenance of the navigation project for environmental considerations. Reliability: Reliability is the ability to provide consistent lockage service throughout the navigation season or construction period for new improvements with minimal disruption to river traffic. The Recommended Plan will greatly improve reliability of 12 specific lock sites, and the UMR-IWW system as a whole, by upgrading or adding locks and replacing operating systems. At the seven most-heavily used sites, existing locks will be kept operational for additional capacity, flexibility, safety, and redundancy. Navigation Safety: Improvements in approaches and operating systems, elimination of double lockage, and increased reliability will result in safer conditions for tow boat crews and lock personnel. Adaptability: The Recommended Plan is a framework plan for navigation efficiency improvements, ecosystem restoration, and dual-purpose operation. Adaptive management within a collaborative environment will be an integral part of implementation. There are three increments proposed with separate authorization required for each increment. For navigation: 1. 7 new locks and small scale improvements for the first increment; 2. 5 lock extensions and small scale improvements for the second increment; and 3. additional small scale improvements for the third increment. On the ecosystem side implementation of the first increment establishes an ecosystem level of investment that would be continued through the subsequent two increments. An efficient and reliable inland waterway with sufficient capacity supports the need of shippers and carriers to adapt to changing market conditions and provides opportunities for competition and innovation. Figure 3. Description of Planning & Project Objectives Introduction Page 10 of 10
21 CHAPTER 1 NATIONAL FREIGHT TRANSPORTATION SYSTEM OVERVIEW...1 ECONOMIC GROWTH AND INTERNATIONAL COMPETITIVENESS...2 NATIONAL FREIGHT TRANSPORTATION CHARACTERISTICS, CAPACITIES, AND DEMAND...3 Roadways...3 Railways...4 International Gateways (Seaports and Land Crossings)...5 Transportation Logistics...5 NATIONAL FREIGHT TRANSPORTATION POLICY...5 CONCLUSIONS...6 TABLE Table 1.1 Rank of Nation s Gross Domestic Product in Inflation-Adjusted Dollars...2 Chapter 1 Page i
22 This page intentionally blank.
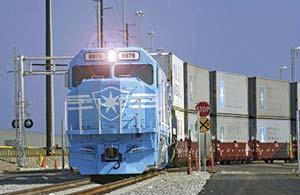
23 CHAPTER 1 NATIONAL FREIGHT TRANSPORTATION SYSTEM OVERVIEW The United States has a world-class national freight transportation system, which has provided the Nation with the means for reliable, efficient, and low cost delivery of freight. The country s extensive network of roads, railways, waterways, pipelines, airlines, ports and terminals comprise one of the most extensive and elaborate national freight transportation systems in the world. Advanced transportation logistics systems allow shippers and carriers to traverse the intermodal pathways for fast, reliable, and low cost delivery of freight from point to point. This multimodal freight transportation system includes 4 million miles of roads, 145,000 miles of rail, and 12,000 miles of inland navigation channels. A staggering 16 billion tons of goods worth over $9 trillion (U.S. DOT FHWA 2002) move on this system annually. That translates into roughly 310 pounds of freight moved daily for each U.S. resident. The importance of a properly constituted and optimally utilized national freight transportation system to national wealth and prosperity cannot be over stated. Reliable, efficient, and low cost freight transportation increases the value of goods by moving them to locations where they are worth more; and encourages competition and production by extending the spatial boundaries of commodity and labor markets (USDOT FHWA 2002b). Freight transportation also stimulates demand for goods and services and employs more than 10 million U.S. citizens. The United States national freight transportation system is planned, constructed, and operated through a complex network of actions by governments at all levels and private enterprise. The approach allows for competition and private entrepreneurship to drive investment and innovation; states and local governments to act in the best interest of their communities and regions; and the Federal government to guide transportation investment and utilization in the best interest of the Nation through direct investment, grants, and policy. Complicating this already complex decision-making network, are the nature of transportation investments, which take many years to plan and complete; the nature of policy decisions, which require extensive deliberation to sort out potential consequences and require compromise to reach a point of acceptability; and the complexity and unpredictability of the global economy. Transportation investments and policy actions require tradeoffs and integration with other economic, social, and environmental factors. While still a mighty system, the nation s transportation system is coming under increasing pressure due to aging infrastructure and increasing demand for travel and freight movement. This is despite substantial ongoing investment of several hundred billion dollars per year. At the domestic level, failure to correct deficiencies and expand capacities will result in lower national economic potential and less satisfying living conditions for citizens. As identified in the National Strategy to Reduce Congestion on America s Transportation Network (DOT, May 2006) congestion drains the economy, hurts families, and threatens businesses. Any lessening in economic potential will also have international implications by reducing the economic influence of the U.S. in world economy and profoundly affects national security. Chapter 1 Page 1 of 6
24 ECONOMIC GROWTH AND INTERNATIONAL COMPETITIVENESS The U.S. continues to hold claim to the distinction of being the world s largest and most successful economy. However, over the next 30 years China and India will move from their current 7th and 9th positions, respectively, to second and third behind the U.S. (Table 1.1) (AASHTO, May 2007). China with a population of 1.3 billion is projected to overtake the U.S. as the largest national economy around As part of its drive to increase economic output and productivity China is making large investments in transportation infrastructure, including port modernization and a 53,000-mile national expressway system. India with a population of 1 billion is building a 10,000-mile national expressway system. Europe with 450 million people is also investing heavily in transportation modernization and expansion of its highways, bridges, tunnels, ports, waterways, and rail lines. Transportation systems and governmental policies directly influence the movement of trade within and among countries, as well as their economic prosperity. The U.S. level of investment is lagging behind and as a result its competitive advantage in transportation is eroding. Table 1.1. Rank of Nation s Gross Domestic Product in Inflation-Adjusted Dollars US US US US US China 2 Japan Japan China China China US 3 Germany Germany Japan Japan India India 4 U.K. U.K. Germany India Japan Japan 5 France China U.K. Russia Russia Brazil 6 Italy France India U.K. Brazil Russia 7 China Italy France Germany U.K. U.K. 8 Brazil India Russia France Germany Germany 9 India Russia Italy Brazil France France 10 Russia Brazil Brazil Italy Italy Italy The U.S. transportation infrastructure constructed largely from 1930 through 1960 was clearly not designed for the current levels of human and freight movement. Sophisticated supply chain logistics are threatened by potential reductions in reliability, increased delivery time, and higher transportation costs that will result from higher levels of congestion. Loss of reliability and an increasing level of delay also affect worker productivity and quality of life of citizens. The U.S. population is expected to grow by 140 million between 2005 and 2055, which is roughly the same as the population growth during the preceding 50 years. Our dependency on international trade is expected to grow to 60 percent of the Gross Domestic Product by 2030 (AASHTO, May 07). By 2035, the tonnage of U.S. freight moving on our transportation system is expected to more than double from the present 16 billion tons in response to both domestic and foreign demands. The nature of freight is also changing. Although all types of freight are expected to increase, the growth in container freight is expected to grow especially fast from 8 million units in 1980 to 42 million units in 2005 to 110 million units by Improvements and policy changes on all transportation modes will need to intensify if the U.S. is to meet the future demands for freight transportation and to maintain our world economic standing. Chapter 1 Page 2 of 6
25 NATIONAL FREIGHT TRANSPORTATION CHARACTERISTICS, CAPACITIES, AND DEMAND The following sections present transportation characteristics, capacities, and demand forecasts for components of the national freight transportation network that have the most integration and interdependence with waterways. Waterways are addressed in Chapter 2. Roadways. Over the past century, the combined efforts of Federal, state and local governments have constructed a highway system of nearly 4 million miles the largest and best system in the world. The 162,000-mile National Highway System is comprised of a 47,000-mile Interstate System and associated 115,000 miles of additional arterials. Another 810,000 of 813,000 miles of arterials and roadways are eligible for Federal aid. Nineteen percent of U.S. highways are owned by states, 45 percent by counties, 33 percent by cities and townships and 3 percent by the Federal government. Highways are the keystone of the U.S. freight transportation system, carrying nearly 80 percent of domestic tonnage and 94 percent of domestic value. Trucks provide direct service for both longdistance and local shipments, and provide the pickup and delivery for long-distance shipments made by rail, barges or overnight airfreight. The current U.S. Interstate Highway System was designed in the pre-world War II period from the experience of a very different era. As interstate transportation began in the late 1950s there were 65 million vehicles creating 600 billion vehicle miles of travel. In 2006, there were over 240 million vehicles creating 3 trillion vehicle miles of travel on a highway system that had grown only 15 percent over the same time period. Forecasts show that the interstate highway travel demand measured through vehicle miles traveled (VMT) will increase from 690 billion in 2002 to 1.3 trillion by Truck-borne freight is expected to double by By 2035 the Interstate System will carry an average of 22,700 trucks per day per mile; currently, it carries less than half that. Today only 30 miles of the Interstate carry more than 50,000 trucks per day per mile; by 2035, that number may reach 2500 miles. Whatever extra capacity was created when the interstate transportation system was put in place is being used up quickly. It is estimated that by 2020, 90 percent of urban interstates will be at or exceeding capacity. This includes the major metropolitan areas of Chicago-Milwaukee, St. Louis, and Minneapolis-St. Paul, which are the anchor cities of the UMR-IWW Navigation System. Peak-hour congestion in urban areas is expected to increase from 29 percent in 2000 to 46 percent in Rural areas will also experience greater congestion. The value of freight shipments is expected to increase at a faster pace than tonnage in the future. According to USDOT, the value of freight is expected to increase by $20.6 billion from 1998 to 2020, which represents a compound annual growth rate of 5.5 percent. More than 90 percent of this projected increase is attributable to growth in the value of highway freight (77 percent). These trends suggest that the economic consequences of highway congestion will be much greater in the future. The growing value of highway shipments underscores the importance of keeping bulk commodities on railways and waterways to reduce highway congestion that impacts high-value goods. Highway travel is projected to increase by around 2 percent per year through If this rate persists over the 50 year planning horizon, highway vehicle miles will increase from 3 trillion vehicle miles to 7 trillion vehicle miles. The American Association of State Highway and Transportation Officials (AASHTO) recently estimated an annual investment of $155.5 billion would be required through 2030 to bring about a national highway system that produces positive net benefits in terms of condition and performance. Actual highway spending in 2005 was approximately $75 billion. The Federal assistance for highway Chapter 1 Page 3 of 6
26 improvements is set at 45 percent, or $33 billion for the 2005 investment. Additional investment is needed to rebuild or replace 55,000 bridges, 15,000 interchanges, and 210,000 lane miles of pavement foundations and to expand the system by adding 10,000 miles of new routes, 20,000 miles of upgraded National Highway System routes to Interstate standards, and 20,000 new lane-miles on existing interstate routes. Some of the new lanes will be dedicated to trucks and value-priced lanes. Greater use of mass transit and alternative modes for freight will be needed to augment increased investment in roadways. Railways. United States freight railroads are the worlds busiest and longest. In fact, U.S. railroads move more than four times as much freight as do all of Western Europe s freight railroads combined. Railroad operations for freight in the U.S. cover some 145,000 miles. America s freight rail system carries 14 percent of the Nation s freight by tonnage, 29 percent of the ton-miles, and 5 percent of the value. Over the past two decades following Federal deregulation (Staggers Act) railroads have increased their productivity by merging and acquiring, cutting track mileage by more 50 percent, reducing personnel by 50 percent, installing more computer guided automation, and upgrading track and fleet. The railroad network that accommodated freight traffic in 2005 is very different than the rail network in place a generation ago where over-regulation resulted in a system out of sync with shippers needs. Since deregulation in 1980, railroads have divested obsolete and over-used capacity and invested billions of dollars to increase capacity and productivity aligned with markets. However, according to a report by the Congressional Budget Office (CBO), Freight Railway Transportation: Long-Term Issues (January 2006), the pendulum has begun to swing toward tighter capacity and there is concern that railroads are not investing enough to meet demand for their services. The CBO report cited work by the Transportation Research Board (TRB) the American Association of state Highway and Transportation Officials (AASHTO), and the Hudson Institute that warned of significant strains on the capacity of the national freight railway system. The TRB in 2003 reported that Rail capacity constraints and recent problems are discouraging to the hopes of state and Federal officials, environmentalists, and motorists that rail can relieve highways of part of the burden of truck traffic growth. Railroads have increased investments in recent years, although it is unclear whether the railroad industry will invest quickly enough to avoid a curtailment of service. One interesting note is that although the number of trains per mile of track has increased steadily since deregulation, the average speed has declined and is now at speeds of the early 1980s. Railroads are increasingly encountering situations where they could have sold more services had they had more capacity. By most accounts (STB and GAO) rail rates have fallen steadily since the 1980s due to competition and productivity improvements. However, this is not expected to continue in the face of limited capacity to accommodate growing demand, and the higher cost of adding capacity and improving efficiency in comparison to the earlier years after deregulation. According to AASHTO s 2003 Freight Rail Bottom Line Report the rail industry is stable, productive and competitive; it is earning enough money to be profitable, but not enough to replenish infrastructure and modernize at a quick enough pace. Rail freight demand currently exceeds carrying capacity with rail intermodal freight experiencing the greatest strain. Although major freight railroads invested $8.3 billion in 2006, which nearly double the amount of 10 years earlier, it was still not enough to finance sufficient expansion. Railroads are enhancing profitability by turning aside lower-profit carload and short-haul freight in favor of longer distance intermodal and bulk traffic. The Federal Railroad Administration expects rail ton-miles to increase from an estimated 1.46 trillion in 2000 to 2.40 trillion in 2025 and the rail freight industry to grow an average of 2 percent per year between now and This growth reflects the adoption of technological advances in Chapter 1 Page 4 of 6
27 communications, command, and control; more fuel-efficient locomotives; high-capacity, lightweight freight cars; and moderate traffic growth, led by intermodal traffic. Public funding may be needed to augment private rail investment to avoid transferring 450 million tons of freight from rail to truck, avoid 15 billion in additional truck VMT and save $162 billion in shippers costs and $ 20 billion in highway costs over a 20-year period. International Gateways (Seaports and Land Crossings). Growth in international trade is placing more demand on seaports and land gateways. Tonnage at U.S. ports increased 13.8% between 1990 and 2000 while port capacity has increased very little. In addition to portside capacity constraints, constraints in landside access also cause bottlenecks to input and output through international ports. Urban congestion at many ports makes expansion difficult and costly. Efforts are being made to increase capacity and improve productivity at the nation s ports, such as moving some freight to inland ports for sorting and distribution of freight. The highly successful Alameda Corridor, which is a 20-mile long rail line that transfers freight from the crowded Los Angeles and Long Beach harbors to an inland port for sorting and distribution, is one example. Virginia Inland Port takes freight from ports of Hampton Roads. Other inland ports have been developed at San Antonio and Kansas City as part of the NAFTA railway system serving Mexican Ports. Although these types of investments are impressive additions to the transportation system, much more is going to be required in order to meet the demand, which is primarily being driven by the rapid growth in multimodal container trade with Asia. Seaports are points of vulnerability to the entire national transportation system, because of the small number of major ports and the high volume they carry. For example, it took 23-days to eliminate backlog and get back to normal flows after a 10-day lockout of dockworkers at the Los Angeles and Long Beach ports in The great majority of NAFTA trade crosses into and out of the U.S. in trucks. Periods of heavy traffic, limited infrastructure, and custom procedures often result in long, costly border delays. Transportation Logistics. Technological innovations have enabled drastic changes in supplychain management that have resulted in decreases in costs as shippers were able to consolidate distribution centers and substitute more transportation for costly inventory. Innovations continue to advance; however, these ultra- sophisticated tools require a high degree of reliability across the transportation system, which can be weakened by congestion and delay on our freight system. The result of such an occurrence is lower productivity and higher supply chain costs. NATIONAL FREIGHT TRANSPORTATION POLICY The U.S. DOT in its strategic plan for 2006 to 2011 has established goals in five strategic areas: safety, reduced congestion, global connectivity, environmental stewardship, and security preparedness and response. This is the first strategic plan by the U.S. DOT that recognizes reduced congestion as an area of strategic importance. The Congressionally created National Surface Transportation Policy and Revenue Study Commission in its first completed report in a series of six planned reports prepared by AASHTO, Transportation: Invest In Our Future, Future Needs of the U.S. Surface Transportation System (February 2007) identified six recommendations for the future preserve the current system, enhance system performance, expand capacity to meet future needs, and reduce growth in highway demand by expanding the capacity of transit and rail. These recommendations are directed at the National Chapter 1 Page 5 of 6
28 Highway System, but provide for broader implications and insight. Much of the factual information in this chapter came from this report. Concern about future congestion in the national transportation system and its impact on the nation s ability to move freight efficiently and effectively, and consequently on the economy, led the U.S. DOT to establish the Framework for a National Freight Policy (draft - April 10, 2006). The Framework recognizes the need for a more unified and comprehensive approach in addressing national freight transportation needs as opposed to a single mode, project-by-project approach. The Framework identifies congestion as a challenge requiring collaborative action by public and private stakeholders. It lays out a vision and objectives with strategies and tactics necessary to achieve them. CONCLUSIONS Our look into the future of the national freight transportation revealed overwhelming need for investment and transformation around the vision of a freight transportation system that will ensure efficient, reliable, safe, and secure movement of goods and support of the Nation s economic growth while improving environmental quality. Over the next four decades, the projected increases in freight shipments and personal travel will overwhelm our aging and under-invested infrastructure unless action is taken now to encourage innovation and investment. The Framework for a National Freight Policy provides focus for coordination and collaboration. A significant response is needed in all aspects of the national freight transportation system and logistics. Under-investment in the national transportation system and investing in projects that have not been integrated with other aspects of the natural and human environments are likely to have serious economic, environmental, and social impacts. One recommendation from the National Surface Policy and Revenue Study Committee and others is for better utilization of waterways as one way of addressing landside congestion. The National Surface Policy and Review Study Committee recommends that the Federal government support state initiatives to integrate planning and investment for water transportation with surface transportation, to address landside demands generated by ports, and to utilize the unused potential on the Inland Waterway System to relieve highway congestion (ASCE, January 2007). Chapter 1 Page 6 of 6
29 CHAPTER 2 THE INLAND WATERWAY SYSTEM AND THE UPPER MISSISSIPPI RIVER SYSTEM THE INLAND WATERWAY SYSTEM... 1 Aging Infrastructure... 1 Advantages of Inland Barge Transportation... 1 UPPER MISSISSIPPI RIVER SYSTEM (UMRS)... 6 Upper Mississippi River System... 6 Upper Mississippi River Illinois Waterway Navigation System... 6 Navigation Infrastructure... 6 Importance of the UMR-IWW to the Region... 8 UMR-IWW System Importance to Agriculture AMERICA S MARINE HIGHWAYS CONCLUSIONS TABLES 2.1 Cargo Capacities Average Cumulative Lock Delays, 1990 to FIGURES 2.1 Commerce on Selected Waterways Inland Waterway Commodities Commercially-Important Inland Waterways Upper Mississippi River Lock Unavailability Time Commercial Tonnages on UMR-IWW ( ) U.S. Grain Primary Export Routes... 9 Chapter 2 Page i
30 This page intentionally blank.
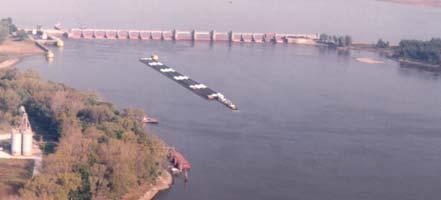
31 CHAPTER 2 THE INLAND WATERWAY SYSTEM AND THE UPPER MISSISSIPPI RIVER SYSTEM THE INLAND WATERWAY SYSTEM The Inland Waterway System is a subsystem of the National Waterway System, which also includes the Intracoastal Waterway System, and the St. Lawrence Seaway and the Great Lakes System. Navigable waterways serve much of the geographic area of the United States and the majority of the population. Navigation through waterways is largely out of sight and out of mind to a significant proportion of the US population. Through an integrated management approach navigation on waterways can coexist with other river purposes and a healthy ecosystem. The Inland Waterway System is comprised of rivers, waterways, canals, and the locks and dams that provide some 12,000 miles of commercially-navigable waters, including the Intracoastal Waterway. The Inland Waterway System moves approximately 15 percent of the nation s cargo at a significantly lower transportation cost/ton than rail or truck. In 2005, this system carried 624 million tons of cargo principally raw materials and liquid and bulk primary products, like coal, petroleum, chemicals, grain, processed metals, cement, sand and gravel. Figures 2.1 and 2.2 illustrates the trend in total tonnage and commodities hauled on the primary U.S. inland waterways over the past few decades. The U.S. Army Corps of Engineers (USACE) is responsible for all 12,000 miles of these waterways, of which roughly 11,000 miles (figure 2.3) are part of a fuel-tax program. The tax rate on commercial users is $.20/gal, and revenues collected are deposited in the Inland Waterways Trust Fund (IWWTF). New construction and major rehabilitation of the inland waterways infrastructure is paid half from the Federal general fund and half from the IWWTF. The Secretary of the Army under Congress manages the trust. An eleven-member Inland Waterways Users Board was established under Section 302 of Public Law [(1986 Water Resources Development Act (WRDA)] to advise the Secretary of the Army and Congress on fund management and prioritization for inland navigation projects. Aging System. Over 50 percent of the locks and dams operated by the Corps on the Inland Waterway System are over 50 years old. Many of the 600-foot locks on the system, including those on the Ohio, Upper Mississippi, Illinois, and Tennessee Rivers, were built in the 1930 s. Many of today s tows consist of 12 or more barges, which require the tow to be split and passed through the lock in two operations. Aging of inland waterways infrastructure is not necessarily a concern as long as timely investments are made in maintenance and major rehabilitations, with some capacity and modernization improvements where needed. However, in constant dollar terms, operations and maintenance funding for the Corps civil works infrastructure has been largely flat or declining for decades, while the needs for maintaining the aging infrastructure have increased. This is adversely affecting reliability of the system. Long-established programs for preventative maintenance of principal lock components have essentially given way to a fix-as-fail policy, and even then the fix may take weeks or months to complete. Depending on the nature of the lock malfunction, protracted repair time can have major consequences for barge traffic that depends on the facility, and for shippers and manufacturers Chapter 2 Page 1 of 13
32 depending on timely delivery of their cargo. Unscheduled outages are more costly than outages planned well in advance. Advantages of Inland Barge Transportation. Inland barges carry approximately 15 percent of the Nation s freight at the lowest unit cost. Barge transportation offers an environmentally sound alternative to truck and rail transportation. If cargo transported on inland waterways each year were to be moved by another mode, it would take an additional 6.3 million rail cars or 25.2 million trucks to carry the load. Barge transportation is the most fuel efficient method of moving raw materials needed by the nation. Supporting this conclusion are the statistical data reflecting the relative distance each mode of transportation can carry one ton of cargo for every gallon of fuel burned. Truck 70 miles Train 420 miles Barge 530miles These figures show that shallow draft water transportation is approximately seven and one half times more economical, thus more efficient, than trucks and one and one quarter times more efficient than rail. Key to this efficiency is the ability of barges to carry large loads of bulk materials up to five times their own weight. The cargo capacity of a barge is approximately 15 times that of one rail car and 60 times greater than one semi-trailer (Table 2.1). Table 2.1. Cargo Capacities Barge Railcar Semi-trailer Tons 1, Bushels 53,500 3, Gallons 453,600 33,566 7,560 To move the same amount of cargo transported by a standard tow (15 barges) would require a freight train 2.75 miles long or a line of 870 semi-trailers stretching almost 35 miles. On the lower Mississippi, one 10,000 horsepower towboat can push 40 barges, the equivalent of 600 railcars or more than 2,200 semi-trailers. If the cargo moved on the inland waterways systems each year had to be moved by rail it would take 6.3 million rail cars, or on the road, 25.2 million semi-trailers. Inland waterways allow tremendous savings in fuel consumption, reduced greenhouse gas emissions and air pollution, reduced traffic congestion, fewer accidents on railways and highways, and less noise and disruption in cities and towns. Chapter 2 Page 2 of 13
33 Millions of Short Tons TOTAL Mississippi Ohio Tennessee Illinois GIWW Year Figure 2.1. Commerce on Selected Waterways Millions of Short Tons Coal Petroleum Chemicals Crude Materials Manf. Goods Food and Farm Manf. Equip. Other Year Figure 2.2. Inland Waterway Commodities Chapter 2 Page 3 of 13

34 Figure 2.3. Commercially-Important Inland Waterways Chapter 2 Page 4 of 13

35 Chapter 2 Page 5 of 13
36 THE UPPER MISSISSIPPI RIVER SYSTEM (UMRS) Upper Mississippi River System (UMRS). The UMRS is a multi-purpose river system that provides economic and environmental benefits to the Nation. In addition to the navigation system, the Mississippi River basin s abundant and diverse resources have attracted and sustained human populations for thousands of years. There are 78 counties bordering the Upper Mississippi River and Illinois Waterway. Together, these counties contain nearly 5 percent of the Nation s population, with total estimated 2006 population of nearly 13.7 million. The estimated 2006 population for the UMR counties is 6,070,610, and 7,589,288 for the IWW counties. Fifty-four percent of the study-area counties have over half of their population living in rural areas. Little fluctuation in the population of the study-area communities is indicated, with only a 7.8 percent increase from Upper Mississippi River Illinois Waterway Navigation System. The commerciallynavigable portions of the UMR extend from the confluence with the Ohio River, River Mile (RM) 0.0, to Upper St. Anthony Falls Lock in Minneapolis-St. Paul, Minnesota, RM The IWW extends from its confluence with the Mississippi River at Grafton, Illinois, RM 0.0 to T. J. O Brien Lock in Chicago, Illinois, RM The UMR-IWW Navigation System contains 1,200 miles of 9-foot deep channels, 38 lock and dam sites, and thousands of channel training structures. Navigation Infrastructure. There are 38 active navigation lock and dam sites on the UMRS operated and maintained by USACE (see map). There are 29 active projects on the UMR; 6 of these projects feature two lock chambers. The southernmost projects, Locks and Dam 27 and Melvin Price Locks and Dam, have 110 x 1200 main chambers and 110 x 600 auxiliary chambers. Locks and Dam 15 has a 110 x 600 main chamber and a 110 x 360 auxiliary chamber. Locks and Dam 14 has a 110 x 600 main chamber and an 80 x 320 auxiliary that is over 80 years old and is used almost exclusively for locking recreational craft on a seasonal basis. The other dual-chamber project is Locks and Dam 1, which has two 56 x 400 chambers. Lock and Dam 2 has a 110 x 500 chamber. Lock and Dam 19 has a single 110 x 1200 chamber, and the remaining Mississippi River locks have single 110 x 600 lock chambers. The IWW system has eight single-chamber lock and dam projects. The seven projects on the main part of the waterway have single 110 x 600 lock chambers and are over 60 years old. There is one lock on the Kaskaskia River, located just less than a mile from the junction with the UMR and has one 84 x 600 chamber. T. J. O Brien Lock and Dam on the Calumet River have a 110 x 1000 chamber. Most barges moving to and from Lake Michigan use the O Brien Lock. Most of the locks and dams within the UMR-IWW navigation system were built by the Corps in the 1930s, with an initial projected life span of about 50 years, and most were originally designed to accommodate 600-foot-long barge tows. Standard tows since then have grown from 600 feet to over 1,100 feet, nearly the length of four football fields. Twenty-three of the UMR s 29 lock locations have chambers that are 600 ft in length. The upper and lower St. Anthony Falls locks and Lock 1 are 400 ft. in length. Three locks Lock 19, Lock 26 (renamed the Melvin Price Lock and Dam), and Lock 27 are 1,200 ft. in length. With a 1,200 ft. lock chamber, a 1,100-ft. barge tow can pass through in 45 minutes. In contrast, it generally takes between 90 and 120 minutes for a 1,100-ft. barge tow to pass through a 600-ft. lock due to the need to double-lock the barge tow. Double-locking is a procedure whereby a barge tow is broken into two sections. Each is passed through the lock chamber separately and the two sections are rejoined before continuing. Commercial users argue that not only do barge tow backups tend to occur at the 600-ft. locks where extensive double-locking causes delays, but double- Chapter 2 Page 6 of 13

37 locking increases the potential for work-related hazards associated with manipulating the binding and guide ropes, etc., while in the narrow lock chamber. This additional time can produce queuing delays for other barges. Since the 1980s, the UMR-IWW has experienced increasing traffic congestion and delays related to its aging infrastructure and limited lock capacity. Unplanned closures due to aging infrastructure have increased, thus reducing the number of days annually that locks are open to traffic (Figure 2.4). Figure 2.4. Upper Mississippi River Lock Unavailability Time Due to Scheduled or Unscheduled Maintenance or Hardware Malfunction The Corps of Engineers reports that the UMR-IWW system has over half (19 of 36) of the most delayed lock sites in the country s system of inland waterways. Existing delays vary based on location in the system, but are generally greatest furthest downstream (Table 2.2). Table 2.2. Average Cumulative Lock Delays, 1990 to 2001 Lock Upper Mississippi River Locks 1-7 Locks 8-13 Locks Locks 19 Locks Locks 26 and 27 Cumulative Total Illinois Waterway Peoria Lock La Grange Lock Other 6 Locks Cumulative Total Average Hours Per Tow Chapter 2 Page 7 of 13