Outlook for European Ports. ESPO Annual Conference Athens 2015
|
|
|
- Georgiana Thomas
- 5 years ago
- Views:
Transcription

1 Outlook for European Ports ESPO Annual Conference Athens 2015


2 An global organisation focused upon helping developing countries integrate into world trade Consensus building UNCTAD Technical assistance and capacity building Research & analysis
3 Contents 1 - Global shipping market overview A) Demand B) Supply C) Freight costs 2 - Implications for ports 3 - Challenges facing Ports
4 1 - Global shipping market Overview A) Demand B) Supply C) Freight costs

5 GDP Growth Source: UNDESA, WESP January 2015
 a Partly estimated; b")

6 GDP forecast (Mid-year Update) a Partly estimated; b Forecast, based in part on Project LINK; Source: UNDESA, WESP 2015


7 Industry Output F - Forecast Source: RS Platou Monthly, April 2015

8 F - Forecast Source: RS Platou Monthly, April 2015
 54 857 +4.3% Oil +3.0% TEU +6.9% Minor +4.")

9 World seaborne trade in cargo ton-miles by cargo type, (Billion of ton-miles) % Oil +3.0% TEU +6.9% Minor +4.3% Major +3.7% 2015 Source: UNCTAD secretariat, based on data from Clarkson Research Services. Shipping Review and Outlook, Spring 2014/5.

10 Global containerized trade, (Million TEUs and percentage annual change) +6.7% 182.4m Source: Based on Drewry Shipping Consultants, Container Market Review and Forecast 2008/2009, and Clarkson Research Services, Container Intelligence Monthly, various issues. 2015
11 1 - Global shipping market Overview A) Demand B) Supply C) Freight costs
12 Top 20 ship owning nations, beneficial ownership (1,000 dwt, by country of ownership, 1 January 2014) Source: Note: UNCTAD secretariat, based on data provided by Clarkson Research Services. Propelled sea-going merchant vessels of 1,000 GT and above.

13 Annual growth of the world fleet, (Per cent of dwt) Source: UNCTAD Review of Maritime Transport, various issues. Clarkson Research Services, Shipping Review & Outlook, Spring 2015 RS Platou Monthly, April 2015 F - Forecast

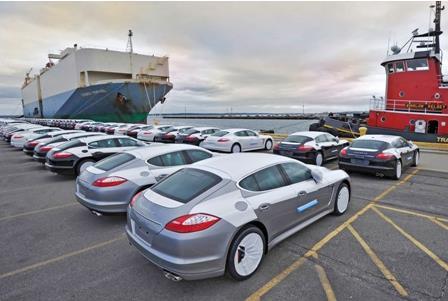
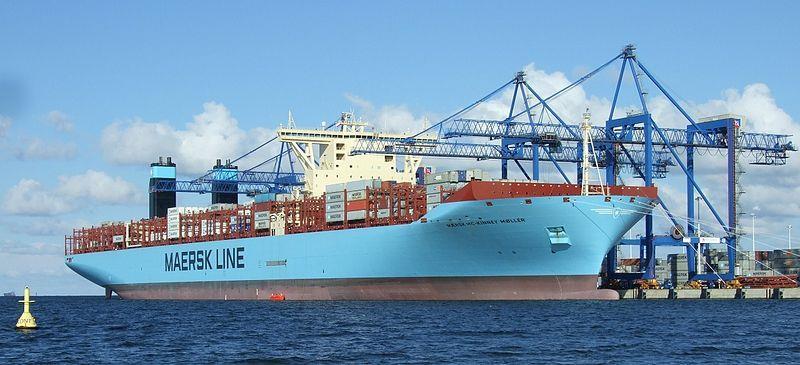
14 World fleet by principal vessel types, a (Beginning-of-year figures, percentage share of dwt) Source: Compiled by the UNCTAD secretariat, on the basis of data supplied by Clarkson Research Services and previous issues of the Review of Maritime Transport. a All propelled sea-going merchant vessels of 100 GT and above, excluding Inland Waterway Vessels, Fishing Vessels, Military Vessels, Yachts, and Offshore Fixed and Mobile Platforms and Barges (with the exception of FPSOs and Drillships)

15 World tonnage on order, a (Thousands of dwt) +3.1% +1.5% +5.6% -1.2% 2015 Source: a Compiled by the UNCTAD secretariat, on the basis of data supplied by Clarkson Research Services. Propelled sea-going merchant vessels of 100 GT and above. Beginning of year figures. Clarkson Research Services, Shipping Review & Outlook, Spring 2015

 Source: http://www.alphaliner.")
16 The 10 leading liner companies, May 2015 (Number of ships and total shipboard capacity deployed, in TEUs, ranked by TEU) Source:
17 1 - Global shipping market Overview A) Demand B) Supply C) Freight
18 Container Daily Charter rates ( ) x 2 Source: the Hamburg Shipbrokers Association. See

19 Daily earnings of bulk carrier vessels, (Dollars per day) Source: UNCTAD, based on data from Clarkson Shipping Intelligence Network, figures published by the London Baltic Exchange. Note: Supramax average of the six time charter routes; Handysize average of the six time charter routes; Panamax average of the four time charter routes; Capesize average of the four time charter routes. RS Platou Monthly, April 2015
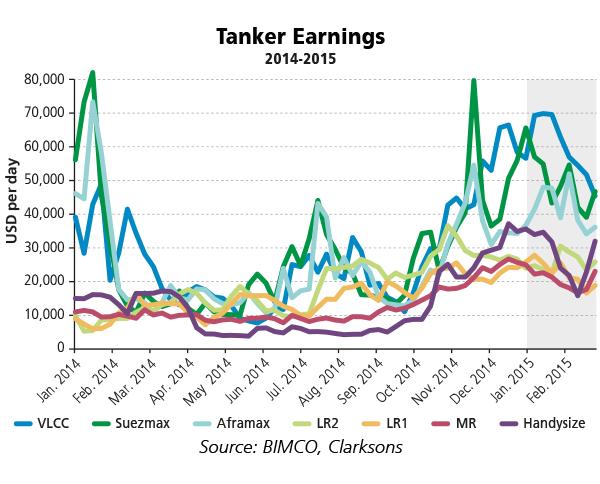
20 Tanker Market Source:
21 Contents 1 - Global shipping market overview A) Demand B) Supply C) Freight costs 2 - Implications for ports 3 - Challenges facing Ports


22 Every port is different
23 Container sector While global growth is positive the dynamics of the industry are changing larger vessels Greater intra-asian trade A slow down in manufacturing in China Increased terminnal capacity in North West Europe These will put pressure on European ports to compete for busineess
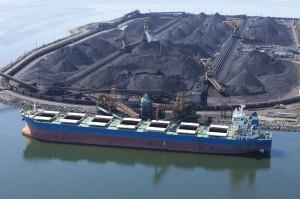
 in the demand for bulk cargo to be transported.")
24 Bulk sector While the oversupply of bulk vessels is pushing down freight rates, for ports this isn't necessarily a problem as there is a reasonable growth (around 4%) in the demand for bulk cargo to be transported. Source: Clarkson Research Services, Shipping Review & Outlook, Spring 2015 and RS Platou Monthly, April 2015
25 Source: RS Platou Monthly, April 2015
 Source:")
26 Price indices of selected groups of commodities, January February 2015 (Index: January 2012=100) Source: UNCTADStat

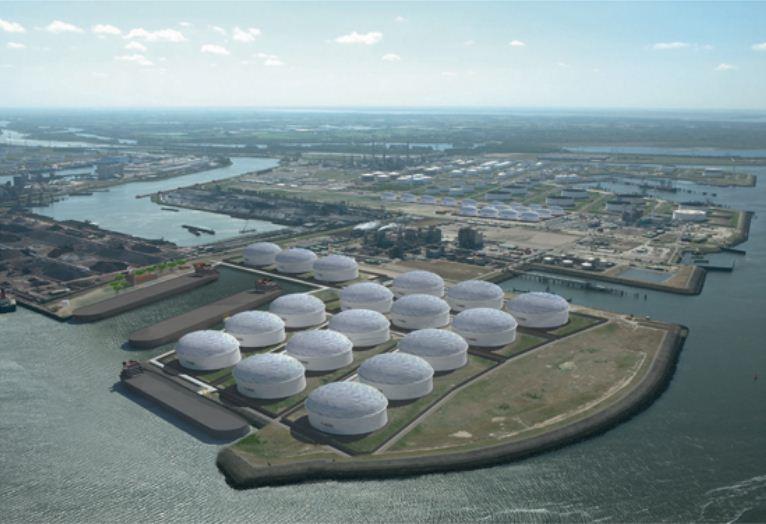
27 Tanker sector The demand for crude oil is still strong and a continuation in suppy by the leading producers is helping to keep prices low. The geography of trade may affect how future supplies meet demand as some facilities are taken off-line.
28 Contents 1 - Global shipping market overview A) Demand B) Supply C) Freight costs 2 - Implications for port 3 - Challenges facing Ports
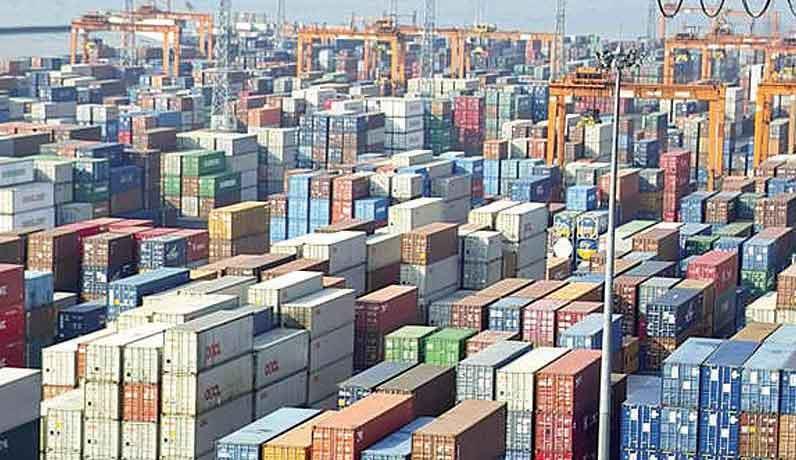
29 A). Increasing volumes
30 Top 20 container terminals and their throughput for (Twenty-foot equivalent units and percentage change) Percentage change Percentage change Port Name Shanghai 32,529,000 36,617,000 35,290, Singapore 31,649,400 32,600,000 33,869, Shenzhen 22,940,130 23,279,000 24,040, Hong Kong 23,117,000 22,352,000 22,200, Ningbo 15,670,000 17,351,000 19,450, Busan 17,046,177 17,686,000 18,678, Guangzhou 14,743,600 15,309,000 16,610, Qingdao 14,503,000 15,520,000 16,580, Dubai 13,270,000 13,641,000 15,200, Tianjin 12,300,000 13,000,000 14,060, Rotterdam 11,865,916 11,621,000 12,298, Port Klang 10,001,495 10,350,000 10,946, Kaohsiung 9,781,221 9,938,000 10,593, Dalian 8,064,000 10,015,000 10,130, Hamburg 8,863,896 9,258,000 9,729, Antwerp 8,635,169 8,578,000 8,978, Xiamen 7,201,700 8,008,000 8,572, Tanjung Pelepas 7,700,000 7,628,000 8,500, Los Angeles 8,077,714 7,869,000 8,340, Jakarta 6,100,000 6,171,000 6,053, Total top Source: UNCTAD secretariat and May 2015 Note: In this list Singapore does not include the port of Jurong.
 Lack of financial resources to invest (deeper approach channels/berths, wider")
.")
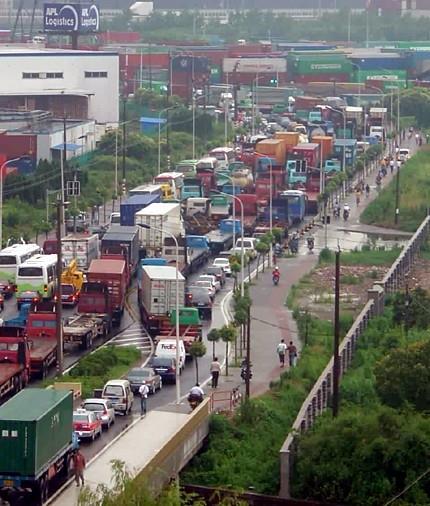
31 Volume Challenges Seaside More vessels Bigger vessels Less time (pressure to reduce ship turnaround times) Lack of financial resources to invest (deeper approach channels/berths, wider turning basins). Land side More cargo High frequency. Less time (pressure to improve cargo handling time). Lack of financial resources to invest in more cargo handling equipment, bigger storage facilities).
32 B). Assessment
33 World s leading ports by productivity (2014) Port Name Country Berth Productivity 1 Jebel Ali United Arab Emirates Tianjin China Qingdao China Nansha China Yantian China Khor al Fakkan United Arab Emirates Ningbo China Yokohama Japan Busan Republic of Korea Shanghai China Salalah Oman Balboa Panama Bremerhaven Germany Xiamen China Taipei Taiwan, Province of China Rotterdam Netherlands Mawan China Gwangyang Republic of Korea Chiwan China Colombo Sri Lanka Jeddah Saudi Arabia Nhava Sheva (Jarwaharlal Nehru) India Kaohsiung Taiwan, Province of China Dalian China Los Angeles United States of America 80 Source: Journal of Commerce Port Productivity Database (data H1 2014) May 2015
34 World s leading ports by productivity (Container moves per ship, per hour on all vessel sizes and percentage increase) Port Country 2012 Berth 2013 Berth Productivity Productivity 2014 Berth Productivity Percentage increase 2013/2012 Percentage increase 2014/2013 Jebel Ali United Arab Emirates % 16% Tianjin China % -4% Qingdao China % -1% Nansha China % 14% Yantian China % 10% Khor al Fakkan United Arab Emirates % -9% Ningbo China % -11% Yokohama Japan % -3% Busan South Korea % -3% Xiamen China % -15% Source: UNCTAD Secretariat and the Journal of Commerce Port Productivity Database May 2015

35 Shippers are benchmarking carriers Carriers are benchmarking ports Who are ports benchmarking?
 Increased awareness reflected in more regulations/policy E.")
36 C). Enviromental Challenges Various operational emissions: E.g. from cars, trucks, trains, ships, cranes, offices etc. In the form of SOx, NOx, CO2, Particle matter, noise, dust, light etc. Plus accidents E.g. spills (oil, cargo sewage, ballast, wash off) Increased awareness reflected in more regulations/policy E.g. Reg Annex VI - MARPOL SDG
37 Sustainable Development Goals (SDG) In September 2015, the United Nations is expected to build upon the MDG and finalize SDG for adoption at its General Assembly in New York. The new goals will build upon the Rio+20 outcome document The Future we want by addressing a multitude of issues on sustainable development, not least, how to achieve development with the least impact upon the environment.
38 SDG 1. End poverty in all its forms everywhere 2. End hunger, achieve food security and improved nutrition, and promote sustainable agriculture 3. Ensure healthy lives and promote well-being for all at all ages 4. Ensure inclusive and equitable quality education and promote life-long learning opportunities for all 5. Achieve gender equality and empower all women and girls 6. Ensure availability and sustainable management of water and sanitation for all 7. Ensure access to affordable, reliable, sustainable, and modern energy for all 8. Promote sustained, inclusive and sustainable economic growth, full and productive employment and decent work for all 9. Build resilient infrastructure, promote inclusive and sustainable industrialization and foster innovation 10. Reduce inequality within and among countries 11. Make cities and human settlements inclusive, safe, resilient and sustainable 12. Ensure sustainable consumption and production patterns 13. Take urgent action to combat climate change and its impacts* 14. Conserve and sustainably use the oceans, seas and marine resources for sustainable development 15. Protect, restore and promote sustainable use of terrestrial ecosystems, sustainably manage forests, combat desertification, and halt and reverse land degradation and halt biodiversity loss 16. Promote peaceful and inclusive societies for sustainable development, provide access to justice for all and build effective, accountable and inclusive institutions at all levels 17. Strengthen the means of implementation and revitalize the global partnership for sustainable development
39 Goal develop quality, reliable, sustainable and resilient infrastructure, including regional and trans-border infrastructure, to support economic development and human well-being, with a focus on afford 9.4 by 2030 upgrade infrastructure and retrofit industries to make them sustainable, with increased resource use efficiency and greater adoption of clean and environmentally sound technologies and industrial processes, all countries taking action in accordance with their respective capabilities able and equitable access for all
40 Goal by 2030, provide access to safe, affordable, accessible and sustainable transport systems for all, improving road safety, notably by expanding public transport, with special attention to the needs of those in vulnerable situations, women, children, persons with disabilities and older persons 11.6 by 2030, reduce the adverse per capita environmental impact of cities, including by paying special attention to air quality, municipal and other waste management 11.a support positive economic, social and environmental links between urban, peri-urban and rural areas by strengthening national and regional development planning


41 THANK YOU REVIEW OF MARITIME TRANSPORT - Dr. Vincent F. VALENTINE Division on Technology and Logistics UNCTAD Palais des Nations 1211 Geneva, Switzerland Tel Fax vincent.valentine@unctad.org