Investing in New York
|
|
|
- Rodney Osborne
- 5 years ago
- Views:
Transcription
 (781) 250 8150 Page 1 This report has been prepared by Boston Strategies International at the request of CLIENT for the purpose of")


1 Boston Strategies International, Inc. January 2008 Global Infrastructure Series Investing in New York b (1) (781) Page 1 This report has been prepared by Boston Strategies International at the request of CLIENT for the purpose of establishing its operating strategies. It may not be appropriate for other purposes or audiences. This report contains forward-looking statements and projections with respect to anticipated future performance of CLIENT, suppliers, customers, and/or general or specific economic conditions and factors that are based on Boston Strategies International s analysis of market trends and external data. Forward-looking statements and projections are not guarantees of future performance and involve significant business, economic and competitive risks, contingencies and uncertainties, which are difficult to predict. Accordingly, these projections and forward-looking statements may not be realized and actual results may vary up or down. This report may not be reproduced or distributed without express written approval from Boston Strategies International.


2 Global Supply Chain Economists Industry Cost and Pricing Strategy Research Analysis Consulting Page 2
3 New York in Perspective A key gateway for consumer airfreight imports An East Coast distribution hub Third largest US port (by TEU throughput) Competing with mini-landbridge i id for imports Summary Slower growth than West Coast ports A new wave of Suez traffic will boost growth As mega-ships become more economical Terminals, Services, and Connections A blend of European and Asian services View of key cargo terminals Container operators and services Port Elizabeth terminal Port Newark terminal NYCT and Red Hook terminals Rail access in Northern Jersey Daily intermodal connections to all gateways Road access to Mid-Atlantic, West, & Canada Congestion and Capacity Issues Highway delays are bad, but not the worst Congestion in airfreight Congestion the solutions $2b investment plan Other projects underway Portfield distribution center project Long-term Page 3
4 New York in Perspective Page 4
5 A key gateway for consumer airfreight imports IMPORTS EXPORTS US Port Rankings, 2006 AIR WATER Imports via Air Imports via Water Ship. Weight* Ship. Weight* 10 New York City, NY Houston Galveston, TX 61,528 Imports 52 Miami, FL New Orleans, LA 55, Chicago, IL Los Angeles, CA 29, Houston Galveston, TX 27 Los Angeles, CA Philadelphia, PA 25,255 (61,527) 31 Anchorage, AK New York City, NY 24, Savannah, GA Port Arthur, TX 19, New Orleans, LA (55,672) 28 San Fransisco, CA Mobile, AL 14, New Orleans, LA Tampa, GA 10, Los Angeles, CA (29,828) 55 Dallas Fort Worth, TX San Fransisco, CA 9, Cleveland, OH 44 4Boston, MA 7,640 Exports via Air Exports via Water Ship. Weight* Ship. Weight* 10 New York City, NY New Orleans, LA 30, Chicago, IL Houston Galveston, TX 18,136 Exports 27 Los Angeles, CA Los Angeles, CA 10, Miami, FL Columbia Snake, OR 8, Cleveland, OH Seattle, WA 7, Savannah, GA Norfolk, VA 6, San Fransisco, CA Mobile, AL 4, New Orleans, LA New York City, NY 4, Houston Galveston, TX Detroit, MI 4, Anchorage, AK Savannah, GA 4,014 Air: Water: 1. New York City, NY (430) 2. Chicago, IL (319) 3. Los Angeles (275) Source: Boston Logistics analysis of BTS Data 1. New Orleans (86,040) 2. Houston Galveston, TX (79,663) 3. Los, Angeles, CA (39,918) *Shippingweight (Millions of kg) 1. New Orleans, LA (30,463) 2. Houston Galveston, TX (18,164) 3. Los Angeles, CA (10,365) Page 5
6 An East Coast distribution hub Source: PANYNJ Page 6
7 Third largest US port (by TEU throughput) World s Largest Ports, by Container Volume Top US Ports, by Container Volume Row Labels Sum of TEUs % of World TEUs United States 31, % Los Angeles 7, % Long Beach 6, % New York/New Jersey 4, % Oakland 2, % Seattle 2, % Tacoma 2, % Charleston 1, % Hampton Roads 1, % Savannah 1, % Source: Various Singapore Hong Kong Shanghai Shenzhen Busan Kaohsiung Rotterdam Hamburg Dubai Los Angeles Long Beach Antwerp Qingdao Port Klang Ningbo Tianjin New York/New Jersey Guangzhou Tanjung Pelepas Laem Chabang Page 7 0 5,000 10,000 15,000 20,000 25,000 Source: Various
8 Competing with mini-landbridge for imports 200 US Trade Balance by Trade Partner Over Time Billions of fus$ Japan Canada Mexico China Source: Boston Logistics analysis of Economist Intelligence Unit data Page 8
9 Slower growth than West Coast ports US Maritime Containerized Export and Imports by Coast NY/NJ Container Throughput TEUS (millions) TEUs (millions) West Coast East Coast Gulf Coast Sources: Boston Logistics, BTS, PANYNJ Page 9
10 A new wave of Suez traffic will boost growth Eastern and Western Approaches to NYNJ Source: PANYNJ Page 10
11 As mega-ships become more economical Distribution of Suez Canal Transits by Size of Vessel, 2006 Ships > 5,200 TEU will increase over 30% by 2009 (1) 000 TEUs Source: Boston Logistics analysis of Suez Canal Authority statistics (1) Household Goods Forwarders Association of America 0 < >10 Vessel Size, 000 TEU Page 11
12 Terminals, Services, and Connections Page 12
13 A blend of European and Asian services Largest Carriers Serving NYNJ Thousands of TEUs, 2007 Largest Foreign Ports Served Thousands of TEUs, 2007 Maersk 502 Shanghai, 273 Other, 893 MSC, 440 Other, 745 Hong Kong, 263 Yang Ming, 147 H-L, 310 Bremerhave n, 262 NYK, 156 China Shipping, 167 Hanjin, 170 Cosco, 171 Zim, 182 APL, 195 CMA 210 Singapore, 104 Kaohsiung, 127 Antwerp, 145 Busan, 149 Rotterdam, 194 Yantian, 230 Source: Boston Logistics analysis of PANYNJ data Note: Carrier data represents the top 90% of the market, and port data represents 68% of the market Page 13
14 Overview of PANYNJ Facilities Source: PANYNJ website Page 14


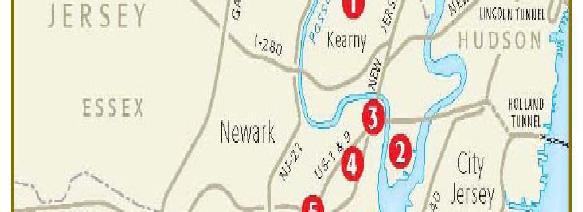
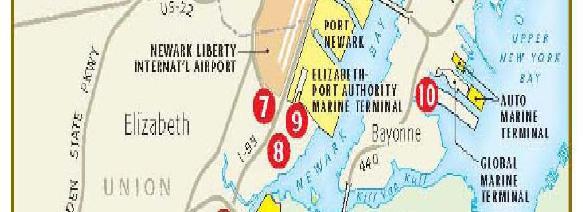
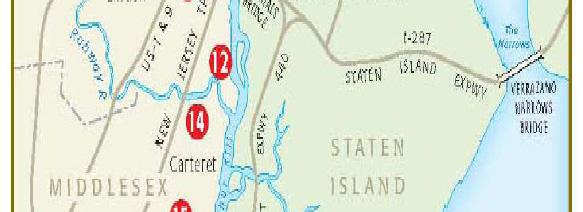
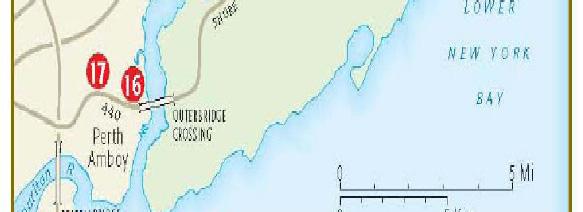
15 View of key cargo terminals Source: PANYNJ Page 15


16 Container operators and services PANYNJ Container Terminals, Terminal Operators, and Container Lines Source: PANYNJ Note: Carriers are subject to change Page 16


 >1m ft 2")

17 Port Elizabeth terminal Maher and APM Terminals ExpressRail (ondock-rail facility) >1m ft 2 warehouse space 7 DCs Auto preparation center 266 acres 350 Source: PANYNJ Page 17


18 Port Newark terminal Operated by Ports America (AIG sub) Tank, box car service Rail terminal Refrig. storage space 2 food-grade liquid bulk facilities Copper rod plant 2 OJ blending facilities 2 auto prep centers Wallboard plant Page 18


19 NYCT and Red Hook terminals Red Hook The only terminal on the East/Brooklyn side 600+ Teamster jobs Lease extended NYCT Transfer of Orient Overseas lease to a teachers pension fund Red Hook NYCT Page 19
20 Rail access in Northern Jersey Source: Colliers Source: PANYNJ Page 20
21 Daily intermodal connections to all gateways Source: PANYNJ Page 21

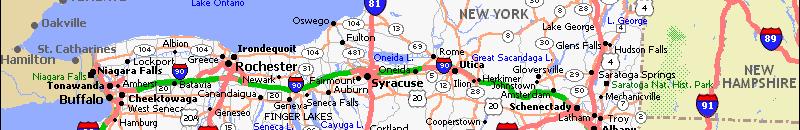
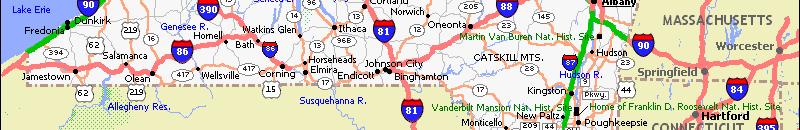
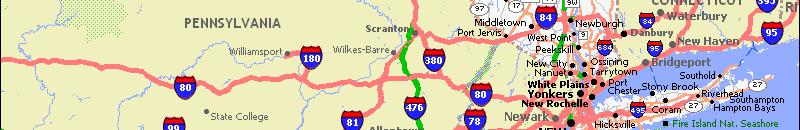
22 Road access to Mid-Atlantic, West, & Canada New York Road Network Page 22
23 Congestion and Capacity Issues Page 23
24 Highway delays are bad, but not the worst Estimated Annual Delay Hours at Major Highway Bottlenecks for Trucks Annual Delay (hrs) Source: FBL Report Intersection City I 405 at I 605 Los Angeles SR 60 at I 605 Los Angeles I 75 at I 285 Atlanta I 55 at Pulaski Chicago I 80 at I 580/I 880 Oakland I 285 at I 85 Atlanta I 90/94 at I 290 Chicago I 80 at I 94 split Chicago I 15 at I 10 Los Angeles I 880 at SR 238 Oakland I 90 at I 290 Buffalo I 93 at I 95 Boston I 77 at I 277 Charlotte I 90 at I 94 split Chicago I 17 at I 10 Phoenix I 710 at I 105 Los Angeles SR 315 at I 70 Columbus I 75 at I 74 Cincinnati I 20 at I 285 Atlanta I 75 at I 85 Atlanta SR 134 at SR 2 Los Angeles I 290 at I 355 Chicago I 93 at I 90 Boston Page 24
25 Congestion in airfreight Delays up by 30% in 2007 Only 59% of flights were on time in July 2007 Weather accounted for 62% of the delay minutes in the NY metro area; the other 38% can be attributed to congestion. Causes Increases in traffic Increase in mix of business jet slots Deferred capital expansion programs JFK Airport Page 25
26 Congestion the solutions Adding capacity Accelerating the NY/NJ Airspace redesign Project Leveraging technology to increase throughput Utilizing available technology to reduce spacing on final approach Expanding the use of Area Navigation (RNAV) procedures Installing Omnidirectional Airport Lighting g to aid arrival in hazy conditions Improving operating practices Utilizing multiple runways at EWR and JFK Improving traffic flows between runways and gates Realigning/relocating arrival, departure and overflight routes to further facilitate deconfliction Creating new routes where practical Adjusting regulatory frameworks Eliminating miles-in-trail departure restrictions to airports >500 miles away Utilizing "capping" and "tunneling" techniques to expedite departures Congestion pricing Source: Delta testimony to Committee on Senate Commerce, Science and Transportation Subcommittee on Aviation Operations, Safety and Security, September 2007 Page 26
27 Recently completed NYCT berth expansion Port Jersey Howland Hook rail connections Ongoing $530m on-dock rail $36m reconstruction of Port Newark Berths 8 &10 $1.9b of investment over next 10 years $2b investment plan PANYNJ Capital Program Program $ Millions Dredging 679 Marine Terminal Development and Redevelopment 299 Rail Cargo Infrastructure 237 Port Roadway Capacity and Safety 227 State of Good Repair 223 Off site and Inland daccess 190 Security 73 TOTAL 1,928 Page 27 Source: PANYNJ
28 Other projects underway Dredging (50 overall) Kill van Kull Port Jersey Port Newark and Port Elizabeth expansion North Avenue Connector ExpressRail double sidings Rail link capacity expansions Bayline Yard expansion Port Newark interlocking Chemical Coast Line Lehigh Line P&H Branch Page 28

29 Portfield distribution center project Source: PANYNJ Page 29
30 Raising the Bayonne Bridge Rebuild roadway Jack up the arch Build a new bridge $1b years Cross-harbor rail tunnel Jersey City-Brooklyn $3-5b Environmental issues Environmental study underway Long-term Page 30


31 Global Supply Chain Economists Boston Strategies International helps supply chain executives make critical supply chain decisions that involve investment and risk by forecasting the evolution of supply markets and technologies. Our mission is to help our clients develop globally competitive supply networks that maximize Supply Chain Value. Our products and services include: Industry Research that helps investors and policy makers identify emerging issues that affect their supply chains, and quantify the impact that they will have Cost and Pricing Analysis that helps financial and operational managers plan and budget by providing benchmark, best practice, and forecast data tailored to their companies' supply chains Strategy Consulting that helps supply chain leaders make high-stakes decisions related to mergers & acquisitions, market entry, capital investments, outsourcing, off-shoring, and make-or-buy Boston, MA, USA 445 Washington St Wellesley, MA USA Dubai, UAE Executive Suite P.O. Box Sharjah, United Arab Emirates (U.A.E.) Shanghai, China 31F Jin Mao Tower 88 Shi Ji Avenue Shanghai , China David Jacoby: Page 31