Market Monitor Report
|
|
|
- Lily Gloria Fields
- 5 years ago
- Views:
Transcription

1 Market Monitor Report MC Webinar February 19, 2019 Joe Bowring

2 PJM Load
3 180, ,000 RT Monthly Average Hourly Load , , ,000 Demand (MWh) 130, , , ,000 90,000 80,000 70,000 60,000 Jan Feb Mar Apr May Jun Jul Aug Sep Oct Nov Dec
 MET ED 7,011 PSEG 3,318 APS (2,863) DOM (4,610) OVEC 1,079 RECO (1,484) AT SI (27,308) DPL (12,440) PECO 26,325 BGE (10,474) DLCO 2,030 PENELEC 25,581 COMED 35,585 EKPC")
4 RT Generation Less RT Load Zone Net Gen Minus Load (GWh) Zone Net Gen Minus Load (GWh) Zone Net Gen Minus Load (GWh) Zone Net Gen Minus Load (GWh) AECO (4,581) DAY (13,047) JCPL (8,051) PPL 16,317 AEP 31,999 DEOK (8,005) MET ED 7,011 PSEG 3,318 APS (2,863) DOM (4,610) OVEC 1,079 RECO (1,484) AT SI (27,308) DPL (12,440) PECO 26,325 BGE (10,474) DLCO 2,030 PENELEC 25,581 COMED 35,585 EKPC (4,138) PEPCO (17,828)
5 RT, Load-Weighted, Average LMP Real-Time, Load-Weighted, Average LMP Year-to-Year Change Average Median Standard Deviation Average Median Standard Deviation 1998 $24.16 $17.60 $39.29 NA NA NA 1999 $34.07 $19.02 $ % 8.1% 132.9% 2000 $30.72 $20.51 $28.38 (9.8%) 7.8% (69.0%) 2001 $36.65 $25.08 $ % 22.3% 101.8% 2002 $31.60 $23.40 $26.75 (13.8%) (6.7%) (53.3%) 2003 $41.23 $34.96 $ % 49.4% (5.0%) 2004 $44.34 $40.16 $ % 14.9% (16.3%) 2005 $63.46 $52.93 $ % 31.8% 79.3% 2006 $53.35 $44.40 $37.81 (15.9%) (16.1%) (0.8%) 2007 $61.66 $54.66 $ % 23.1% (2.3%) 2008 $71.13 $59.54 $ % 8.9% 10.9% 2009 $39.05 $34.23 $18.21 (45.1%) (42.5%) (55.6%) 2010 $48.35 $39.13 $ % 14.3% 58.7% 2011 $45.94 $36.54 $33.47 (5.0%) (6.6%) 15.8% 2012 $35.23 $30.43 $23.66 (23.3%) (16.7%) (29.3%) 2013 $38.66 $33.25 $ % 9.3% 0.5% 2014 $53.14 $36.20 $ % 8.9% 220.4% 2015 $36.16 $27.66 $31.06 (32.0%) (23.6%) (59.2%) 2016 $29.23 $25.01 $16.12 (19.2%) (9.6%) (48.1%) 2017 $30.99 $26.35 $ % 5.4% 19.9% 2018 $38.24 $29.55 $ % 12.1% 70.2%

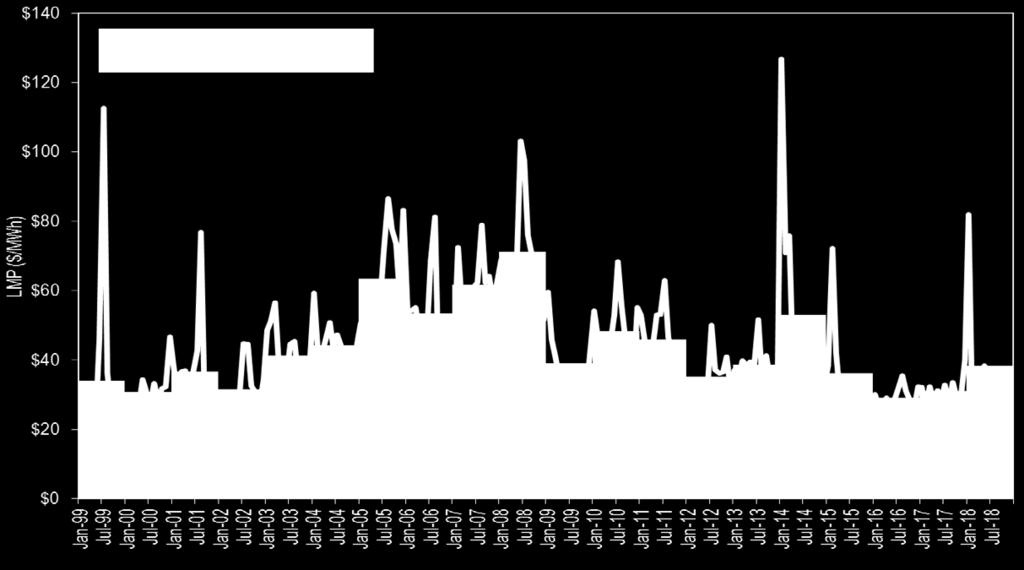
6 RT, Load-Weighted, Average LMP

7 RT, Load-Weighted, Average LMP
8 Total Energy Uplift Charges Total Energy Uplift Charges (Millions) Change (Millions) Energy Uplift as a Percent of Total PJM Billing Percent Change 2001 $284.0 $ % 8.5% 2002 $273.7 ($10.3) (3.6%) 5.8% 2003 $376.5 $ % 5.4% 2004 $537.6 $ % 6.1% 2005 $712.6 $ % 3.1% 2006 $365.6 ($347.0) (48.7%) 1.7% 2007 $503.3 $ % 1.6% 2008 $474.3 ($29.0) (5.8%) 1.4% 2009 $322.7 ($151.6) (32.0%) 1.2% 2010 $623.2 $ % 1.8% 2011 $603.4 ($19.8) (3.2%) 1.7% 2012 $649.8 $ % 2.2% 2013 $843.0 $ % 2.5% 2014 $961.2 $ % 1.9% 2015 $312.0 ($649.2) (67.5%) 0.7% 2016 $136.7 ($175.3) (56.2%) 0.4% 2017 $127.3 ($9.4) (6.9%) 0.3% 2018 $199.3 $ % 0.4%
9 UTC Uplift Allocation-Rates East West 2018 Rates for a 1 MW Transaction ($/MWh) Average Rates with Proposed UTC Uplift Allocation (100% UTC Volume) Average Rates with Proposed UTC Uplift Allocation (50% UTC Volume) Current Average Transaction Rates INC DEC DA Load RT Load Deviation INC DEC DA Load RT Load Deviation
10 UTC Uplift Allocation-Charges to UTCs Uplift Charges Allocation to UTCs Type 2018 Total Uplift Charges 100% UTC Volume 50% UTC Volume Day Ahead $34.0 $5.1 $2.8 Balancing Deviation $106.2 $69.4 $
11 Economic DR Payments When Injecting Power DR reduces load and cannot inject power into the grid, per the PJM OATT. Without a stakeholder process or FERC approval, PJM decided to allow some Economic DR payments when DR injecting power into the grid. PJM defines a test that compares the cost of DR related generation to revenues from injection into the grid and implied retail rate savings. PJM s test includes retail rates when calculating eligibility of Economic DR payments
12 Problems With Including Retail Rate The change is not documented in the manuals or OATT Economic DR offers respond to wholesale LMP Retail rates are outside of PJM s jurisdiction and irrelevant when responding to wholesale price PJM changes first discussed at 1/30/19 DRS Only documentation in PJM DR operations slides. Implications for other parts of PJM markets
13 PJM Language Eligible for Economic DR payments when Required gen revenue (Total Gen output * marginal cost) Gen Export Revenue (Gen Export output * LMP) implied retail savings (Gen load reduction MWs * retail rate) < $0 Retail rate includes all avoided retail cost generation, transmission, distribution o Structured as energy and/or demand charges PJM will also consider use of retail price (instead of wholesale price), for Cogen used as DR
14 Fuel Cost Policies A Fuel Cost Policy is the document that describes the method used to price fuel for calculation of the Market Seller s cost-based offers for a generation resource. Fuel Cost Policy details are not flexible or subject to change after the fact. Fuel Cost Policy compliance is not subject to the discretion of the participant or of PJM. Market Sellers must adhere to the methods in their Fuel Cost Policies or be subject to defined penalties per Schedule 2 of the OA
15 MIRA Upgrade The Member Information Reporting Application (MIRA) is the application used by Monitoring Analytics, the Independent Market Monitor (IMM) for PJM to securely collect data from Market Participants. MIRA is the tool used to collect Fuel Cost Policies. The IMM upgraded the Fuel Cost Policy module in February
16 The upgrades allow: MIRA Upgrade PJM to access fuel cost policies in real time. PJM to provide PJM s fuel cost policy determination in real time. Market Participants to submit fuel cost policies per year. Market Participants to extend approved Fuel Cost Policies for the next year. The details for the new functionalities are described in the MIRA User Guide: For any questions, please Monitoring Analytics: mira@monitoringanalytics.com
17 Monitoring Analytics, LLC 2621 Van Buren Avenue Suite 160 Eagleville, PA (610)