Mathematical Modeling Approach for the FAB Design Process in Semiconductor Manufacturing
|
|
|
- Darren Hunt
- 5 years ago
- Views:
Transcription
1 Mathematical Modeling Approach for the FAB Design Process in Semiconductor Manufacturing Gwangjae Yu Junghoon Kim Young Jae Jang Dept. of Industrial and Systems Eng. KAIST 1
2 1. Research Motivation Two current practice - Trial & error by human experience Optimality not guaranteed - Decision by the consensus of the different field-experts Significant time & effort needed 2. Tool allocation Layout designer Simulation expert Trial & error Many Iterations Each Trial & Error requires consensus Very difficult to reach on consensus 1. Bay layout design 3. Simulation Test Trial & error Product engineer Facility manager Trial & error Over 3 months! 4. Final layout design 2

3 1. Research Motivation Two current practice - Trial & error by human experience Optimality not guaranteed - Decision by the consensus of the different field-experts Significant time & effort needed New practice - Analytical method by optimization theory Optimality or sub-optimality guaranteed - Decision by the math and computer technology Significant time & effort saved + Over 3 months! Total less than a few hours! 3

 <STEP 1>")
4 2. Research Introducing the 2 STEP fab layout design procedure STEP 1 : Designing the optimal bay layout (process level design) STEP 2 : Allocating the tools (tool level design) <STEP 1> <STEP 2> 4
5 3. Research Objective How to find a better layout design? - in terms of certain decision criteria What does it mean by better? - Several criteria considering the material handling (distance, time, cost, congestion, etc.) Our objective - Find a layout design with the minimum material flow distance 5
6 4. Research Idea Semiconductor manufacturing process - Repetitive process, thus re-enters the same bays and tools many times Major issue in the bay layout design process - Wrong bay layout can cause an inefficient material handling (in terms of time, distance, cost, etc.) EX) Process flow: PHO IMP <Bad> <Good> PHO 2 AMHS cycles 1 AMHS cycle IMP IMP PHO Ex) Comparison of the material handling efficiency of the 2 different bay design of 2X2 layout 6
7 4. Research Idea Semiconductor manufacturing process - Repetitive process, thus re-enters the same bays and tools many times Major issue in the tool allocation process - Wrong tool allocation can cause an inefficient material handling (in terms of time, distance, cost, etc.) EX) Material flow: T001 T002 T003 T004 T005 <Bad> <Good> T001 T002 T001 T002 T AMHS cycles 0.75 AMHS cycles T005 T003 T004 PHO T005 T004 PHO Assuming that the bay layout design is in optimal Ex) Comparison of the material handling efficiency by the 2 different tool allocation scenario 7
 <Weekly production plan data (Time 1)> <Basic layout format> Product-ID Plan (wfr/wk) Prod A 1,000 Mathematical Modeling 1 4 5 8 9 12 13")
8 Case Study <Settings> 4 product types 18 bay locations (in rectangular space) One directional loop with shortcuts 212 tool choices (8 types : PVD, CVD, PHO,, DIF,, CMP, IMP) Around 300 steps per each product type Production plan (40,000 wfr/month 10,000 wfr/wk) <Weekly production plan data (Time 1)> <Basic layout format> Product-ID Plan (wfr/wk) Prod A 1,000 Mathematical Modeling Prod B 4,500 AMHS Prod C 1,000 Prod D 3,500 1) Bay layout 2) Tool allocation Total 10,000 8
9 STEP 1 Optimal Bay Layout Design 9
10 STEP 1: Optimal Bay Layout Design Using the Flow Matrix Flow matrix (From-To chart) is a step to step process transition matrix that demonstrates the manufacturing steps. <Monthly From-To frequency among the process types (40,000 wafers/month)> 10
11 STEP 1: Optimal Bay Layout Design Using the Flow Matrix Objective - minimize the total travel distance of the wafer flow Constraints 1. all the tools must be allocated based on the space capacity of each bay 2. Conservation of the material flow 3. bays of the same process types are located next to each other Model 1: Bay layout design model (MIP) 11
12 STEP 1: Optimal Bay Layout Design Using the Flow Matrix Constraints 1. All the tools must be allocated based on the space capacity of each bay 2. Conservation of the material flow 3. Bays of the same process types are located next to each other Tool : Tool : 7 Tools to be allocated 4, 2, 1 DIF (1 unit space each) Tool DIF : DIF To 3 bays of 4 unit spaces each Bay 1 Bay 2 Bay 3 IN & OUT 4 unit (by 4 tools) Material flow occurs NO IN & OUT 0 unit AMHS (by 0 tools) Material flow occurs 12 IN & OUT 3 unit (by 3 tools) Material flow occurs

13 STEP 1: Optimal Bay Layout Design Using the Flow Matrix Constraints 1. All the tools must be allocated based on the space capacity of each bay 2. Conservation of the material flow 3. Bays of the same process types are located next to each other Bay 1 Bay 2 Bay = 100 AMHS Bay 4 Bay 5 Bay 6 OUT If IN IN flow = OUT =
14 STEP 1: Optimal Bay Layout Design Using the Flow Matrix Constraints 1. All the tools must be allocated by the space capacity of the bay 2. Conservation of the material flow 3. Bays of the same process types are located next to each other *If 3, 3, and 2 DIF bays are required, DIF AMHS Bypass bridge DIF... 14
15 Result: Bay Layout Design Bay 1 Bay 4 Bay 5 Bay 8 Bay 9 Bay 12 Bay 13 Bay 16 Bay 17 IMP IMP DIF CMP CVD CVD CVD AMHS: IMHS (Inter-bay Material Handling System) PHO PHO IMP DIF DIF CMP PVD CVD CVD Bay 2 Bay 3 Bay 6 Bay 7 Bay 10 Bay 11 Bay 14 Bay 15 Bay 18 : Stocker : Intra-bay Material Handling System <18-bay layout design, specifying the process types for each bay> 15
16 STEP 2 Optimal Tool Allocation 16
17 STEP 2: Optimal Tool Allocation Using the Mfg. Step Sequence Manufacturing step sequence is a very specific process flow information that demonstrates the manufacturing system in the tool level. (recipe sequence) <Actual mfg. step sequences> Total around 300 steps!! <Recipe sequence data sample of product type A> 17
18 STEP 2: Optimal Tool Allocation Using the Mfg. Step Sequence Model 2: Tool allocation model (MIP) Objective - Minimize the travel distance of the wafer flows Constraints 1. Conservation of step to step material flow 2. Tool capacity of one bay flow in that bay 3. Tools are assigned by the bay space capacity 18

19 STEP 2: Optimal Tool Allocation Using the Mfg. Step Sequence EX) If 4 step process of hourly production rate 100, STEP1 STEP3 STEP AMHS Constraints 1. Conservation of step to step material flow 2. Tool capacity of one bay flow in that bay 3. Tools are assigned based on the bay space capacity STEP2 STEP4 STEP4 flow step1 = flow step2 = flow step3 = = flow step n 19
20 STEP 2: Optimal Tool Allocation Using the Mfg. Step Sequence <Pre-determined tool plan> CVD 1 : : Each capa 15 for step 1 CVD 2 : 2 2 : Each capa 20 for step 1 CVD 3 : 3 : Each capa 50 for step 1 Bay 1 (CVD) Bay 2,3,4, Constraints 1. Conservation of step to step material flow 2. Tool capacity of one bay flow in that bay 3. Tools are assigned based on the bay space capacity STEP1: * = Total tool capacity req. production (step 1) 20
21 STEP 2: Optimal Tool Allocation Using the Mfg. Step Sequence <Pre-determined tool plan with 2 bays with 4 slots each> CVD 1 : CVD 2 : 2 2 CVD 3 : 3 Bay 1 (CVD) Bay 2 (CVD) Constraints 1. Step to step material flow is conserved 2. Tool capacity of one bay flow in that bay 3. Tools are assigned based on the bay space capacity 21
22 Result: Optimal Tool Allocation <Tool allocation result for 18-bay layout (sample data)> 22
23 Analysis of the layout design Simulation 23

 Simulation of")


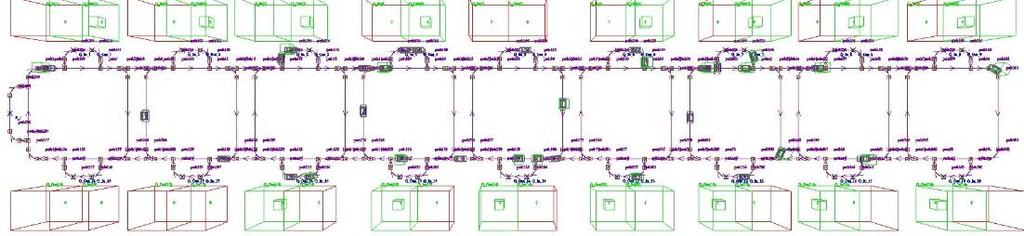
24 The number of moves Cumulative (%) Simulation of the FAB Layout <FAB layout> < From/To matrix > Delivery time (sec.) < Determination of number of OHTs in AMHS> < Simulation > 24
25 Simulation Model 25
26 Comparison of the resultant layout design performance Returning to our original purpose of study, Q. Would the analytical approach result a better performance over current practice of trial & error approach? We compared 3 different layout designs 1) Layout design from the analytical model 2) Layout design by trial & error method referring a technical report, SEMATECH 300mm Factory Layout and Material Handling Modeling: Phase II Report 3) Layout design by trial & error method referring a journal paper, Chen, J. C., Dai, R. D., & Chen, C. W. (2008). A practical fab design procedure for wafer fabrication plants. International Journal of Production Research, 46(10), Performance measure - Transport time - Waiting time - Average OHT-util. - Average WIP in the STKs 26
27 Analysis Result About 14~15% decrease in transportation time, 7~9 % decrease in waiting time, 5~6% decrease in avg. OHT utilization, 1~5% decrease in avg. WIP. Performance Criteria Layout Designs Optimal by our method Reference 1 (SEMATECH) Reference 2 (Journal Paper) Transport time Waiting time Average OHT-util. Average WIP in the STKs sec sec % 4.35 lots sec sec % 4.57 lots sec sec % 4.40 lots <Comparison Result of the simulation test for 3 different layout designs> 27
28 Conclusion Analytical approach with mathematical modeling can be an effective way in layout design process of a semiconductor FAB. The resultant layout can be used as an initial layout of a good quality to start minor changes using trial & error method by the experience of the experts. Finally, it can reduce a significant amount of time that more time can be spent on testing different designs and decision making process for final decision. 28