Chesapeake Megaregion Freight Analysis
|
|
|
- Nicholas Collins
- 5 years ago
- Views:
Transcription


1 Chesapeake Megaregion Freight Analysis Supin Yoder FHWA Office of Planning System Planning & Analysis Team Fred Ducca University of Maryland National Center for Smart Growth
2 Megaregion FHWA Strategic Plan New planning geography results from Expanding metropolitan areas Boundaries between areas blurring Interlocking economic systems Shared natural resources and ecosystems Common transportation systems FHWA Strategic Plan: The nation s megaregion will be the operative regions when competing in the future global economy. 2


3 Emerging U.S. Megaregions Richard Florida, University of Toronto, 2007 America 2050, Regional Plan Association, 2009 Dr. Catherine Ross, Georgia Tech, 2009 Richard Florida America 2050 Catherine Ross 3

4 Megaregion Analysis Framework Performance Measures 4
5 Freight Analysis Chesapeake Megaregion Characteristics Population & employment distribution Goods production/consumption by mode share Industry profile & commodity mix Ports traffic & access mode Intra-megaregion linkage Freight flow Supply chain analysis Economic impact analysis 5

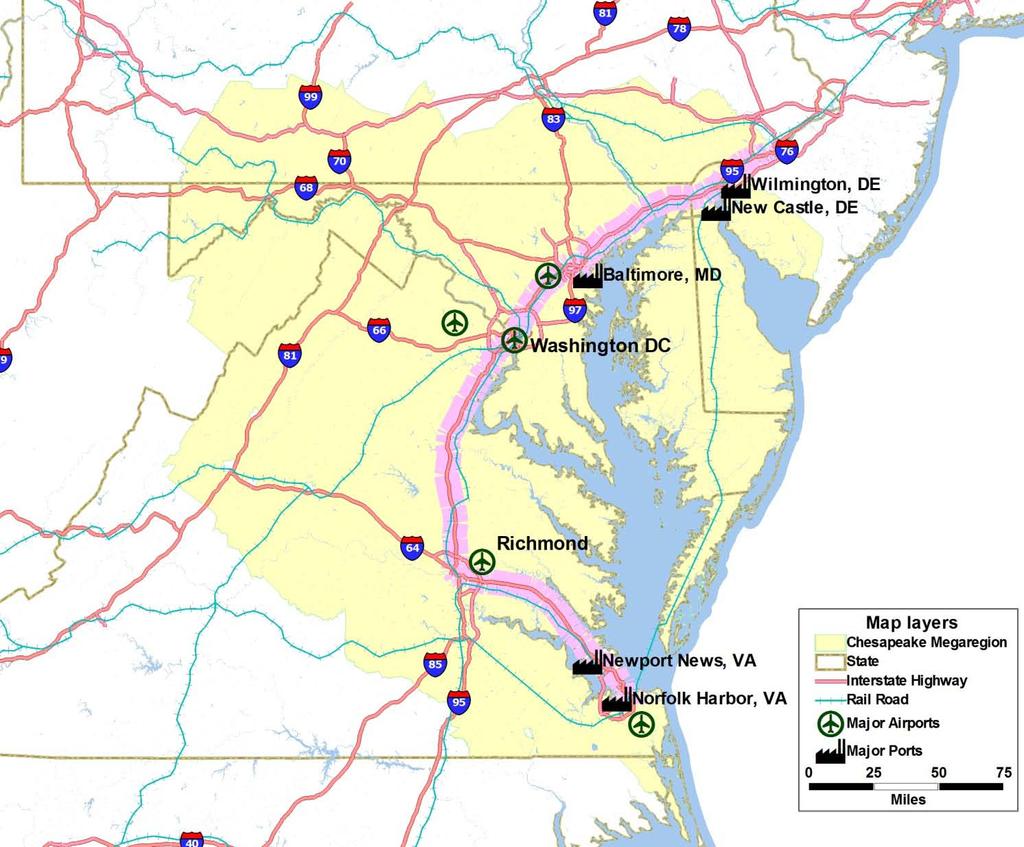
6 Chesapeake Megaregion Study Area 6


7 Analysis of Unit & Data Sources Analysis Unit Megaregion Subregion FAF zone County Data Sources Freight Analysis Framework 3 American Community Survey IMPLAN Megaregion model input & output 7
8 Infrastructure 8
9 The Chesapeake Megaregion in Numbers 2010 Population 15 million 2010 Employment 9 million 2010 GDP $880 billion, 6% of U.S. GDP Major Airports (Top 100 national ranking per 2013 passenger volume) Major Ports (Top 100 national ranking per 2013 cargo volume) 1. Baltimore Intl (20 th ) 2. Ronald Reagan Washington National (25 th ) 3. Washington Dulles Intl (28 th ) 4. Norfolk Intl (68 th ) 5. Richmond Intl (71 st ) 1. Norfolk Harbor, VA (15 th 47 millions) 2. Baltimore, MD (16 th 45 millions) 3. Newport News, VA (28 th 25 millions) 4. Wilmington, DE (71 st 6 millions) 5. New Castle, DE (74 th 5 millions) Source: Population: Census 2010; Employment: County Business Pattern 2010; GDP: BEA 2010; Airport: National Transportation Atlas Databases 2013; Port: National Transportation Atlas Databases
10 Access Modes to/from Ports Norfolk Harbor & Newport News, VA 0% 1% 7% 1% 4% 0% Baltimore, MD 2% 0% 0% 11% 32% 18% 49% Wilmington & New Castle, DE 75% Note: FAF3 Data includes shipments from a private sector establishment to military, but excludes military-to-military shipments 0% 24% 4% 1% 43% 27% 1% Legend Truck Rail Water Multiple Modes and Mail Pipeline Other and Unknown Crude petroleum to an on-site refinery 10 10

11 Household & Employment Distribution by Subregion Household by Income Group Employment by Industry Group Source: Chesapeake Megaregion Model: 2007 Base year 11

12 Economic Dependence Data Source: Department of Agriculture, Economic Service 12

13 Origin of Goods Consumed in Chesapeake Megaregion by FAF3 Zone Source: FAF

14 Freight Mode Share in Tons by FAF3 Zone Production Consumption Source: FAF

15 Highway Freight Flows in Tons Source: 2009 IMPLAN data, EcoNorthwest Haul-Choice Model of truck-dependent industries 15
16 2009 Freight Flows by Truck in Tons From the City of Baltimore To the City of Baltimore Source: 2009 IMPLAN data 16

17 2009 Freight Flows by Truck in Tons From Washington DC To Washington DC Source: 2009 IMPLAN data 17
18 2009 Freight Flows by Truck in Tons From Richmond City To Richmond City Source: 2009 IMPLAN data 18


19 Supply Chain Analysis Highway Shipments into Richmond (Show Top 7 Counties) Richmond to Baltimore Baltimore to other Counties Source: 2009 IMPLAN data 19


20 Supply Chain Analysis Highway Shipments into Baltimore (Show Top 7 Counties) Baltimore to Richmond Richmond to other Counties Source: 2009 IMPLAN data 20
 21 Source: 2009 IMPLAN")
21 Impact of 1% Change in Richmond Production on Selected Counties Magnitude (in dollars) 21 Source: 2009 IMPLAN data
22 Impact of 1% Change in Richmond Production on Selected Counties Industry Share (in $) 22 Source: 2009 IMPLAN data

23 Conclusions The Chesapeake Megaregion is tightly linked by freight Flows The MPO planning areas are unable to capture complex supply chain relationships & economic dependence Future travel congestion can threaten not only local economies but the economy of the entire megaregion 23

24 Conclusions There is a need for an analytic framework at megaregion level Travel model can be constructed with available data FHWA Project Reports: 1. A Framework for Megaregion Analysis: Development and Proof of Concept 2. The Chesapeake megaregion Market Analysis Performance Measures 24