Vidya Mysore FHWA ARC Model Users Group June 02, 2017
|
|
|
- Cory Flowers
- 5 years ago
- Views:
Transcription


1 SHRP2 C20: Freight Demand Modeling and Data Improvement Strategic Plan Vidya Mysore FHWA ARC Model Users Group June 02, 2017
2 Freight Modeling Tools and its necessity Decision-makers recognize that transportation investments are being informed by an understanding of the implications, benefits, and trade-offs relative to freight. Vision for tomorrow Freight transportation drives the ECONOMY 2
3 Longer-Term Vision By 2020, a vision for improved freight modeling and data will be characterized as follows: Robust freight forecasting tools have been developed and are the standard for public sector freight transportation planning. These tools and data are dynamic in terms of linking with other key variables such as development and land use, and are dynamic in terms of application to local scale, corridors, or regions. The knowledge and skills of DOT and MPO staff have been methodically enhanced to complement the development of better tools and data. 3
4 Total and Auto Volumes Total and Auto Volumes Traffic Count - Vehicular Classification 6,000 5,000 4,000 3,000 2,000 Total Vehicles Autos Service Trucks Freight Trucks Week day Traffic, October 2010 SR9/I-95 South of I-295 (Urban) Service and 1, ,000 5,000 4,000 3,000 2,000 Total Vehicles Autos Service Trucks Freight Trucks Week day Traffic, October 2010 I-75- South of Florida's Turnpike (Rural) Service and Freight 1,000 0 Page Time 12 of 13 Day

5 Logistics and Freight Models Freight transport demand is a derived demand Good representation of logistics in freight demand models allows better prediction of future flows More representative freight flows Better cost estimates Source: L. A. Tavasszy, K. Ruijgrok & I. Davydenko (2012): Incorporating Logistics in Freight Transport Demand Models: State-of-the-Art and Research Opportunities, Transport Reviews
 -")
6 C20: Implementation Assistance Program (IAP) - Projects 6
7 Innovations in Behavior-based Freight Modeling: MAG, Phoenix, AZ 7

8 Model Structure and Data
9 Model Structure and Data Figure 1.4 Individual Components of the Proposed Behavior-Based Freight Model INPUTS MODELS OUTPUTS GEOGRAPHY MODEL CALIBRATION DATA MAG / PAG / AZDOT TAZ Shapefiles (MAG 3009 TAZs, 231 RAZs, 45 MPAs) Study Area/GIS Tasks Macro Outside AZ State Level Meso Inside AZ RAZ or MPA Level Macro shape file Meso shape file TAZ shape file 2012 NETS database as a seed table CBP for external firms Correspondence (lookup) NAICS6 SCTG (Industry to Commodity lookup table) BEA s Input-Output Make and Use Tables (Make what commodity is produced by an industry?) (Use who uses certain commodities?) Firm Synthesis Model Computes number of firms by NAICS6, SCTG, Size Disaggregates firms from County to Meso Zones using Employer Determines Supplier (Shipper) Firms Determines Buyer (Consumer) Firms List of Supplier (Make) Firms List of Buyer (Use) Firms Meso Zone Meso Zone MPO/State SED data (TAZ level data, InfoUSA, etc.) BEA s Input-Output Make and Use Tables (Make-Use Table percent of commodity used by industry) ORNL Networks for Distance Skims Supplier Selection Model Links Buyers with Suppliers Uses Size of Firm, Distance, Industry-Commodity Lookups Supplier (Shipper) Meso Zone Linked with Buyer (Receiver/Buyer) Reasonableness checks FAF 4.1 (Annual Tons by Commodity at BEA Level) BEA s Input-Output Make and Use Tables (Make-Use Table percent of commodity used by industry) Apportionment of Commodity Flows Disaggregates Commodity Flows among Supplier-Buyer Pairs Based on Buyer Firm Size and Tons of Goods Consumed Annual Tons Traded between Supplier and Buyer Meso Zone TRANSEARCH Data Existing Truck Model Highway and Rail Networks Distance and Time Skims Location of IMX Facilities (in AZ and outside AZ) Shipping Cost Data Transport and Logistics Path Choice Model Generates Skims for Highway, Rail, Water, and Air Ben-Akiva/De Jong s Transport and Path Choice Model Generates Most Optimal Path (given costs, times, distances, location of IMXs, supplier-buyer combinations) Selected Path and Shipment Size for Each Supplier-Buyer Combination Meso Zone FAF3 (or FAF4) paths TRANSEARCH Data Rail Pipeline Air 9 Trucks
10 Model Structure and Data (cont d) Figure 1.4 Individual Components of the Proposed Behavior-Based Freight Model (continued) INPUTS MODELS OUTPUTS GEOGRAPHY MODEL CALIBRATION DATA Trucks Commercial Vehicle Establishment Surveys SED Data Location of IMX Facilities (in AZ and outside AZ) Truck Type of Vehicle Choice Model Two types of Trucks Medium and Heavy will be estimated Binary Logit Choice Model Key Variables Commodity, Origin Industry, Destination Industry, Employment, FTL/LTL, Direct versus IMX Number of Medium and Heavy Trucks Meso Zone DMV Data VIUS Data Existing Truck Model Expanded Truck GPS Data Medium Trucks Heavy Trucks Truck GPS Data Other (e.g., Trimble) GPS Data for Medium Trucks SED Data Model Skims Times, Distances Tour-Based Truck Model Estimates Number of Stops, Tour Completes, Stop Purpose, Location, and TOD Choice Series of MNL Models (very similar to MAG s Existing Truck Tour Model for Heavy Trucks) Medium and Heavy Truck Tours, Truck Trips, and TOD Distributions MAG TAZ DMV Data VIUS Data Existing Truck Model Expanded Truck GPS Data Stop Generation Tour Completion Stop Purpose Stop Location Stop TOD Choice 10 1 stop 2 stops stops Yes return to home base No does not return One of 10 stop types Retail Construction Farming Residential Government Warehouses Transportation Office Industrial Service One of 3,000 TAZs 1 st Stop TOD (24 1-hour periods) Next Stop TOD (24 1-hour periods) Source: Cambridge Systematics, Inc.
11 Innovative data and large data collections and purchases Firm Synthesizer NETS data as seed table CBP data for external firms Supply Chain Model FAF4.1 TRANSEARCH BEA Make and Use Tables Economic Census Data 2007 (CFS 2007) Economic Census Data 2012 (CFS 2012 microdata for AZ) Sun Corridor IMPLAN data Mode and Path Choice Model Economic Census Data 2012 (CFS 2012 microdata for AZ) Tour-based Model ATRI (Heavy trucks) StreetLight (Medium and Light trucks) Utilization of the 2016 MAG Commercial Vehicles Survey 11

12 Freight Model Visualization 12
 Light truck data collections and corresponding updates to the model Full integration of the freight model with the")
13 From pilot study and freight model to fully integrated mega-regional transportation forecasting system Advancement of stop identification algorithms in truck GPS data by incorporating land use and other criteria Diversification of tour and trip by metropolitan area (MAG, PAG) Light truck data collections and corresponding updates to the model Full integration of the freight model with the regional transportation forecasting models, including the activity-based model and the four-step model Possible future integration with regional economic models 13
14 Innovations in Behavior-based Freight Modeling: Metro Portland, OR 14

15 SHRP 2 C20 Portland IAP Model Design and Development National Supply Chain Model Freight Truck Touring Model Service Vehicle Touring Model Model development Transfer of basic structures, starting specs from Baltimore Re-estimation/calibration of modules using local data 15
 Donated GPS data: Beverage distributor, Public gas & electric utility provider Project Progress Data collection complete Model setup and transfer complete Model")
16 SHRP 2 C20 Portland IAP Multiple Sources of Behavioral Data Establishment survey, multiday driver diaries using mobile phone app GPS data from anonymized commercial sources: INRIX EROAD (vehicle monitoring system) Donated GPS data: Beverage distributor, Public gas & electric utility provider Project Progress Data collection complete Model setup and transfer complete Model estimation/calibration in progress 16

17 SHRP 2 C20 Portland IAP Highlights Supply chain model include augmented national, state and regional networks and zones systems ORNL, Oregon Statewide, Metro regional Disaggregation of Canadian FAF zone into 3 parts No single source of local behavioral data was sufficient to cover all market segments for the truck touring models Mobile app driver survey worked great, but recruitment was challenging GPS vehicle monitoring data was surprisingly available Estimation fuses data sources to make sure light, medium and heavy vehicle types are covered and both goods and services 17
18 SHRP 2 C20 Portland IAP Planned Applications Primary modeling tool for analyzing regional freight bottlenecks, and evaluating and prioritizing projects Benefit-cost considerations to include: Duration and severity of recurring truck delays Type, quantity, and value of goods affected by bottleneck Time-critical deliveries and services affected; e.g., air freight and other intermodal connections, construction materials, food deliveries, etc. Industries and employment affected Requires advanced modeling capabilities, including supply chain and truck tour simulations Considering multi-class assignments to differentiate certain commodity groups 18

19 Behavioral Data Collection
20 What behavioral data are needed? Tour-related decisions Clustering and routing scheduled stops Anchors at distribution centers, intermodal terminals Constrained by time of day, stop durations, distances, vehicle capacity Inserting unscheduled stops (account for total VMT) Driver breaks, vehicle refueling/maintenance, etc. Variation across market segments Stop purposes: goods handling, service provision Light, medium and heavy vehicle types Industry/nature of business Commodity types and weights
 Focused on metropolitan travel, particularly for shortdistance goods movements and service provision Targeted commercial vehicle operators 6 industry groups:")

21 Primary Data: Establishment Survey Coverage: 4-county Portland Metro modeling area (Multnomah, Washington, and Clackamas Counties in Oregon, and Clark County in Washington) Focused on metropolitan travel, particularly for shortdistance goods movements and service provision Targeted commercial vehicle operators 6 industry groups: industrial, wholesale, retail, gov t/public utilities, general services, and transportation handling Smartphone app as the primary survey instrument Collected a 7-day travel diary sample from each driver Optional online 1-day travel diary survey offered as backup Offered $20 gift cards as incentive Focus groups pre-survey, recruitment and piloting

22 Establishment Survey Website
23 Data items collected from each establishment Name and address Industry classification (NAICS 2-digit) Type of goods shipped (43 SCTG) Types of services provided (16 categories) Number of employees Number of employees who drive Types of vehicles owned Types of vehicles used Types of shipping services used

24 Truck/commercial vehicle driver diary survey using a smartphone app, rmove Downloaded from Google Play or Apple store The survey app collected route and timing information on every trip made during the course of the day Trips are summarized, and the user was prompted to answer questions about each trip, at a time convenient to the respondent

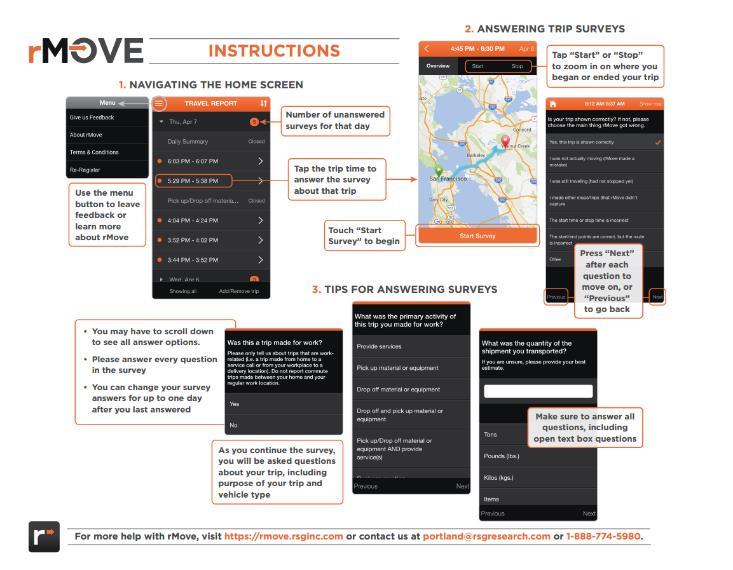
25 Instructions for rmove Participants
26 Benefits to mobile app approach to collecting travel diaries from commercial vehicle drivers Captures accurate routing by time of day Captures all trips, reducing under-reporting Fewer incomplete surveys and item nonresponse (compared to paper) Mobile app can reduce respondent burden, making multi-day samples feasible and cost effective - More observations per respondent - Potential insights into daily variability in operating patterns, reliability, etc.

27 Outcomes of Establishment Survey with Driver Diaries The mobile app worked beautifully! Benefits delivered as advertised Generally positive feedback from respondents Recruitment and participant follow-through proved to be a major obstacle Fell well-short of sampling plan targets
28 Alternative Sources EROAD GPS data Firm provides electronic log books to help trucking companies track weight/mileage for tax compliance Automated reporting, uses GPS Donated a sample of more than 58k trip records Anonymized users All are heavy-duty vehicles (limited market segment) vehicle_id declared_weights_lb start_timestamp start_latitude start_longitude stop_timestamp stop_latitude stop_longitude industry_category 00e95332-f b04e-0526c5117aa /10/2016 2: /10/2016 3: Transport Equipment 00e95332-f b04e-0526c5117aa e95332-f b04e-0526c5117aa /10/2016 8: /10/ : Transport Equipment 00e95332-f b04e-0526c5117aa /11/2016 3: /11/2016 3: Transport Equipment 00e95332-f b04e-0526c5117aa /11/2016 5: /11/2016 8: Transport Equipment
 vehicle_id declared_weights_lb start_timestamp start_latitude start_longitude stop_timestamp stop_latitude")
29 Alternative Sources EROAD GPS data Firm provides electronic log books to help trucking companies track weight/mileage for tax compliance Automated reporting, uses GPS Donated a sample of more than 58k trip records Anonymized users All are heavy-duty vehicles (limited market segment) vehicle_id declared_weights_lb start_timestamp start_latitude start_longitude stop_timestamp stop_latitude stop_longitude industry_category 00e95332-f b04e-0526c5117aa /10/2016 2: /10/2016 3: Transport Equipment 00e95332-f b04e-0526c5117aa e95332-f b04e-0526c5117aa /10/2016 8: /10/ : Transport Equipment 00e95332-f b04e-0526c5117aa /11/2016 3: /11/2016 3: Transport Equipment 00e95332-f b04e-0526c5117aa /11/2016 5: /11/2016 8: Transport Equipment
30 Alternative Sources INRIX GPS data Well-known provider of mobility analytics services and smartphone navigation apps Purchased more than 3.5 million trip records Includes light, medium and heavy vehicles observed over 3 weeks (heavy) to 3 months (light/medium) Anonymized users, identified as for-hire trucking or fleet/local delivery, with vehicle weight profiles Provider Driving Profile DeviceId StartDate EndDate StartLocLat StartLocLon EndLocLat EndLocLon IsStartHome IsEndHome Geospatial Type Provider Type T12:57:42.000Z T13:39:10.000Z TRUE FALSE II T00:00:27.000Z T01:18:46.000Z FALSE FALSE EI T15:33:41.000Z T16:09:38.000Z FALSE FALSE II T10:51:30.000Z T11:30:45.000Z FALSE FALSE II T19:15:08.000Z T19:52:38.000Z FALSE FALSE II T15:24:00.000Z T15:30:38.000Z FALSE FALSE II Vehicle Weight Class
 to 3 months (light/medium) Anonymized users, identified as for-hire trucking or fleet/local delivery,")

31 Alternative Sources INRIX GPS data Well-known provider of mobility analytics services and smartphone navigation apps Purchased more than 3.5 million trip records Includes light, medium and heavy vehicles observed over 3 weeks (heavy) to 3 months (light/medium) Anonymized users, identified as for-hire trucking or fleet/local delivery, with vehicle weight profiles Provider Driving Profile DeviceId StartDate EndDate StartLocLat StartLocLon EndLocLat EndLocLon IsStartHome IsEndHome Geospatial Type Provider Type T12:57:42.000Z T13:39:10.000Z TRUE FALSE II T00:00:27.000Z T01:18:46.000Z FALSE FALSE EI T15:33:41.000Z T16:09:38.000Z FALSE FALSE II T10:51:30.000Z T11:30:45.000Z FALSE FALSE II T19:15:08.000Z T19:52:38.000Z FALSE FALSE II T15:24:00.000Z T15:30:38.000Z FALSE FALSE II Vehicle Weight Class

32 Alternative Sources Coho Distributing Some establishments we contacted offered to give us truck logger data (in lieu of the driver survey) Truck_NO Date Start Moving_Time Driver Miles Stop Stopped_Time Location City St Zip Idle_Time Sensor_Time Max_MPH Mon, Aug 08, :28:47 AM 0:00: :29:17 AM 2:11:41 Mount Trailer Portland OR :07:08 0:07: Mon, Aug 08, :40:58 AM 0:00:18-0 8:41:16 AM 1:38:49 Mount Trailer Portland OR :00:07 0:00: Mon, Aug 08, :20:05 AM 0:00: :20:41 AM 4:17:20 Mount Trailer Portland OR :00:11 0:00: Mon, Aug 08, :38:01 PM 0:06: :44:24 PM 0:02: Ne Buffalo St Portland OR :00:04 0:06: Mon, Aug 08, :46:38 PM 0:01: :48:03 PM 0:00: Ne 42nd Ave Portland OR :00:00 0:01:25 6

33 Alternative Sources Pacific Gas & Electric POINT_X POINT_Y Driver Date Depart_time Arrive_time Transit_time Onsite_time Total_trip_time Miles_driven HQ ADDRESS CITY STATE ZIP Dump Trk Aug-16 7:26 AM 7:28 AM 0:02 0:05 0:07 0 x 1702 NE Burnside Rd Gresham Oregon Dump Trk Aug-16 7:34 AM 7:38 AM 0:04 0:09 0: x 1702 NE Burnside Rd Gresham Oregon Dump Trk Aug-16 7:47 AM 7:49 AM 0:02 0:08 0:10 0 x 1702 NE Burnside Rd Gresham Oregon Dump Trk Aug-16 7:58 AM 7:58 AM 0:00 0:07 0:08 0 x 1702 NE Burnside Rd Gresham Oregon Dump Trk Aug-16 8:06 AM 8:17 AM 0:10 0:10 0: x 1702 NE Burnside Rd Gresham Oregon Dump Trk Aug-16 8:28 AM 9:04 AM 0:36 0:27 1: Nf Brightwood Oregon Dump Trk Aug-16 9:31 AM 9:41 AM 0:09 0:01 0:10 1 Nf Brightwood Oregon Dump Trk Aug-16 9:42 AM 10:30 AM 0:48 0:00 0: Highway 35 Mt. Hood Oregon Dump Trk Aug-16 10:31 AM 10:32 AM 0:01 0:09 0: Highway 35 Mt. Hood Oregon Dump Trk Aug-16 10:41 AM 10:41 AM 0:00 2:06 2: Highway 35 Mt. Hood Oregon Dump Trk Aug-16 12:47 PM 12:48 PM 0:00 1:36 1: Highway 35 Mt. Hood Oregon Dump Trk Aug-16 2:24 PM 3:29 PM 1:05 0:00 1: x 1702 NE Burnside Rd Gresham Oregon 97030
34 Lessons Learned Mobile App Use of a mobile phone app to collect driver diary data can deliver the type and quality of data we need Multiple days, data on activities, commodities, weights and establishment attributes Precise GPS routing and time of day Minor technical challenges: On vs. off the work clock interpretation App downloading process, when to start survey
35 Implementation Roadmap Outreach Materials IAP Projects and Case Studies Document Transferable Approaches Expert Task Group Regional Workshops Address Gaps Promote and Advance Research activities Organize and Facilitate Peer Exchanges Identify Champions & Engage Agencies Update National Policies & Resources 35 Mainstreaming Data and Modeling

36 Thank you Vidya Mysore FHWA Resource Center Office of Technical Services On the web at: Freight_Demand_Modeling_and_Data_Improvement 36

37 37 Questions?