Transportation Asset Management Plan. Fiscal Years
|
|
|
- Gavin Wilkins
- 5 years ago
- Views:
Transcription


1 Transportation Asset Management Plan Fiscal Years April 2018
2 (Page left blank intentionally) 2 P a g e
3 Letter from the Commissioner GDOT has recognized the advantages of strategic investment in its existing infrastructure by deploying asset management and risk principles for many years. MAP-21 and FAST Act requires states to develop a Transportation Asset Management Plan (TAMP) and provide performance reporting for bridge and pavement performance measures (PM 2) as well as the system performance measures (PM3). This TAMP outlines and is an update to the processes by which the National Highway System (NHS, that is on the State Route system and off-state Route (SR) system) is managed to achieve system performance effectiveness at the State and national levels. This update will bring GDOT s TAMP into compliance with the federal requirements. Effective transportation asset management requires a thorough knowledge of the inventory and condition of assets, risks, life-cycle costs, strategic goals and objectives as well as data on how assets are performing in response to stakeholders demands. Most importantly, transportation funds need to be utilized and allocated with responsible stewardship, maximum efficiency and effectiveness. The Department s updated TAMP focuses on pavements and bridges, which represent the largest share of Georgia s transportation assets. Key drivers of an effective TAMP include: Clear links between policy, goals/objectives and decisions at all levels within the Department An understanding of the connection between proposed investments and expected results A long-term view of asset performance Feedback loops linking observed performance to planning and programming decisions Integration of data to support and drive data-driven decisions Georgia DOT leadership s commitment The Georgia Department of Transportation s Executive Leadership is committed to implementing Asset and Performance-Based Management initiatives and to apply the principles and practices contained in this TAMP for the benefit of Georgia s transportation system and its citizens. Georgia Department of Transportation Commissioner: Russell McMurry, P.E. Commissioner 3 P a g e
4 (Page left blank intentionally) 4 P a g e
5 Table of Contents Letter from the Commissioner... 3 Executive Summary Introduction Asset Management Program Federal Requirements TAMP Requirements TAMP Oversight and Management Scope of the TAMP Asset Management Road Map Goals and Objectives Asset Management Committee Structure TAMP Relationship to Other Business Plans Self-Assessment Asset Inventory and Evaluations Pavements Evaluation Bridge Evaluation Performance Targets and Conditions Performance Targets Pavement Condition Summary Bridge Condition Summary Life-cycle Planning Management Pavement Management Bridge Management Risk Management Analysis Risk Identification and Assessment Risk Mitigation Plan The Risk Register Financial Plan and Gap Analysis P a g e
6 7.1 Anticipated Funding Revenues Projected Funding Levels Estimated Funding Needs Pavement Funding Gap Analysis Bridge Funding Gap Analysis Investment Strategies Overall Strategy Development Process Pavement Specific Strategies Bridge Specific Strategies Appendices Appendix A- TAM Self-Assessment List of Figures and Tables Figure 1 Georgia National Highway System... 7 Figure 2: Asset Committee Structure Responsibilities Figure 3: Asset Committee Structure Figure 4: Statewide Plans Comparison Chart Figure 5: Risk Assessment Framework Table 1: Bridge Level of Service Measures Table 2: Pavement Level of Service Measures Table 3: Pavement Inventory Table 4: Bridge Condition Rating Scale Table 5: Bridge and Bridge Culvert Inventory Table 6: Pavement Condition Data Table 7: Bridge Condition Data Table 8: Risk Register P a g e


7 Executive Summary Transportation Asset Management (TAM) is an integrated, comprehensive and strategic approach to costeffectively manage Georgia s assets and meet its transportation needs. TAM s key strength is that it is datadriven, and decisions can be supported by the data it uses and generates, as well as by sound engineering judgment. The TAM process has enabled GDOT to move away from the traditional worst-first to most at risk first approach when managing its infrastructure and applying preservation activities. The successful implementation of asset management is reliant on the application of performance-based management within the Department. 7,200mi NHS Roadway The Transportation Asset Management Plan (TAMP) is a federally required document that describes Georgia s current bridge and pavement asset management processes for improving and preserving the condition of the National Highway System. The scope of this TAMP includes pavements and bridges on the entire National Highway System (NHS). The NHS is a significant component of Georgia s transportation 4,300 Bridges and Bridge culverts system. It is comprised of approximately 7,200 miles of roadway within the State which include interstates, state routes and local roads. Of those miles, there are approximately 4,300 structures of both bridges and bridge culverts. Figure 1 Georgia National Highway System GDOT conducted a TAM self-assessment and formed two committees to help guide and implement TAM Department-wide as well as enhance communication between the Subject Matter Experts (SMEs), Asset Managers and Executive leadership. The committee members also drafted the Transportation Asset Management Plan (TAMP). The Federal regulations established the minimum standards States must use for developing and operating bridge and pavement management systems. Even though MAP-21/Fast Act does not establish the performance 7 P a g e
8 targets for State DOTs, it does specify the minimum condition levels for pavement and bridge assets. Thus, Interstate System pavements shall not exceed more than 5 percent of pavement lane miles in Poor condition. Similarly, the Bridges carrying the NHS (including on and off ramps connected to the NHS) shall have no more than 10 percent of their deck in poor condition. GDOT is required to set 4 pavement targets and 2 bridge targets that are inclusive of: % of Interstates in Good Condition % of Interstates in Poor Condition % of Non-Interstate NHS in Good Condition % of Non-Interstate NHS in Poor Condition % of total NHS bridge deck area in Poor Condition % of total NHS bridge deck area in Good Condition Implementation of the TAMP will be demonstrated by aligning and exercising the investment strategies found in the Statewide Transportation Plan (SWTP), Statewide Strategic Transportation Plan (SSTP) and the Statewide Transportation Improvement Program (STIP). Achieving the targets for asset condition and performance of the NHS will ultimately translate into progress toward national performance goals 1. 1 CFR Title 23 Part ( 8 P a g e

9 1.0 Introduction 1.1 Asset Management Program The Georgia Department of Transportation (GDOT) formally embraced the Transportation Asset Management (TAM) approach in the fall of Previously, the Department s investments were made in silos according to each asset category and location. This method led to a reactive worst first approach in managing programs and allocating resources which often precipitated the complete replacement of assets ahead of an actual need. The use of this approach resulted in limited resources for investing in lower cost preventive maintenance activities. In 2010, GDOT developed its first Transportation Asset Management Plan (TAMP) a document that outlined the Department s strategy for incorporating its TAM philosophy into its business processes to support decision-making. In 2012, the Moving Ahead for Progress in the 21 st Century (MAP-21) Act [which continued with the Fixing America s Surface Transportation Act (FAST Act)], was enacted. MAP-21 establishes and mandates the processes that States must use to develop a risk and performance based, asset management plan for preserving and improving the condition of the National Highway System (NHS). At minimum, the plan must include the following: Summary and condition of the State's NHS pavements and bridges Asset management objectives, targets and measures Performance gap identification Life-cycle planning and risk management analysis Financial plan Investment strategies RISK AND PERFORMANCE BASED ASSET MANAGEMENT PLAN 9 P a g e
10 TAM provides the Department with an integrated, comprehensive and strategic approach to meet Georgia s transportation needs. TAM s key strength is that it is data-driven, and decisions can be supported by the data it uses and generates, as well as by sound engineering judgment. At a time when funding for transportation is constrained and programs are forced to compete with one another, TAM is an effective tool to determine how best to spend every transportation dollar in the most efficient way possible. 1.2 Federal Requirements Title 23 Code of Federal Regulations (23CFR) covers the purpose of Asset Management Plans. The purpose of which is to: (a) Establish the processes that a State transportation department (State DOT) must use to develop its asset management plan, as required under 23 U.S.C. 119(e)(8); (b) Establish the minimum requirements that apply to the development of an asset management plan; (c) Describe the penalties for a State DOT s failure to develop and implement an asset management plan in accordance with 23 U.S.C. 119 and this part; (d) Set forth the minimum standards for a State DOT to use in developing and operating highway bridge and pavement management systems under 23 U.S.C. 150(c)(3)(A)(i) 1.3 TAMP Requirements 23CFR Asset management plan requirements: (a) A State DOT shall develop and implement an asset management plan to improve or preserve the condition of the assets and improve the performance of the NHS in accordance with the requirements of this part. Asset management plans must describe how the State DOT will carry out asset management as defined in (b) An asset management plan shall include, at a minimum, a summary listing of NHS pavement and bridge assets, regardless of ownership. (c) In addition to the assets specified in paragraph (b) of this section, State DOTs are encouraged, but not required, to include all other NHS infrastructure assets within the right-of-way corridor and assets on other public roads P a g e

11 23CFR Pursuant to 23 U.S.C.150(c)(3)(A)(i), this section establishes the minimum standards States must use for developing and operating bridge and pavement management systems. State DOT bridge and pavement management systems are not subject to FHWA certification under Bridge and pavement management systems shall include, at a minimum, documented procedures for: (a) Collecting, processing, storing, and updating inventory and condition data for all NHS pavement and bridge assets; (b) Forecasting deterioration for all NHS pavement and bridge assets; (c) Determining the benefit-cost over the life-cycle of assets to evaluate alternative actions (including no action decisions), for managing the condition of NHS pavement and bridge assets; (d) Identifying short- and long-term budget needs for managing the condition of all NHS pavement and bridge assets; (e) Determining the strategies for identifying potential NHS pavement and bridge projects that maximize overall program benefits within the financial constraints; and (f) Recommending programs and implementation schedules to manage the condition of NHS pavement and bridge assets within policy and budget constraints. 1.4 TAMP Oversight and Management The successful implementation of asset management is reliant on the application of performance-based management within the Department. Asset Management and Performance Management are two interrelated activities. Performance-based management is a two-step process. In the first step, performance measures are developed to assess if the Department is achieving the targets set in the strategic objectives. This determines if GDOT is meeting the level of service for assets included in the Asset Management plan. In the second step, the results of the performance measures are used to make decisions and take corrective actions, where necessary, or to implement strategies and initiatives as laid out in the Asset Management Plan to re-stabilize the process. GDOT strives to use Performance-Based Management to facilitate efficient and transparent decisions regarding issues impacting the transportation system and to monitor and update its asset management practices. 1.5 Scope of the TAMP The scope of this TAMP includes pavements and bridges on the entire National Highway System (NHS). Additional assets will be considered during GDOT asset management planning updates. 11 P a g e
12 2.0 Asset Management Road Map 2.1 Goals and Objectives Performance management is a tool utilized to make outcome-based investment decisions by tracking progress towards the agency s goals through the use of performance measures. Performance management supplements and contributes to the optimization of asset management practices. Asset management objectives are asserted in the form of level of service (LOS). Boost Georgia s competitiveness via leadership in transportation The Department uses three factors to determine its Performance LOS: 1. Strategic objectives targeted condition levels that are closely tied to the Department s strategic goals. 2. Department-wide performance measures quantifiable indicators of how the Department is meeting its objectives. 3. Customer feedback Regularly administered employee, motorist and/or public opinion polls to evaluate the services provided. Deliver a transportation system focused on innovation, safety, sustainability and mobility Values Flexible Open Committed Unified Successful 1. Recruit, train and retain a quality workforce 2. Invest in safety for Georgians and GDOT employees 3. Efficiently take care of what we have 4. Deliver all projects on time and on budget 5. Invest to improve reliability, congestion, and connectivity 12 P a g e
13 The Levels of Service are directly related to the Department s Strategic Plan 3 which provides overall direction through Vision, Mission, Goals, Objectives, and short-term business strategies. The primary goal is to improve fiscal responsibility and responsiveness of State government and the efficient delivery of services 4. TAM practices help deliver the goals and objectives set by the agency, which are required by Georgia Code. 3 Strategic Plan (FY ) 4 Georgia Code ; P a g e
14 Levels of Service Measures ASSET PERFORMANCE MEASURE DESCRIPTION TARGET Bridge Structures Percent of NHS Bridges in Poor condition as a percentage of total NHS bridge deck area Bridge Conditions are based on the results of inspections on all Bridge structures. Bridges rated as Poor are safe to drive on; however, they are nearing a point where it is necessary to either replace the bridge or extend its service life through substantial rehabilitation investments. < 10% (NHS) in Poor Condition Bridge Structures Percent of NHS Bridges in Good condition as a percentage of total NHS bridge deck area Bridges rated as Good will be evaluated as to cost of to maintain Good condition. Bridges rated as Fair will be evaluated as to cost of replacement vs. rehabilitation to bring the structure back to a condition rating of Good. 60% (NHS) in Good Condition Table 1: Bridge Level of Service Measures ASSET PERFORMANCE MEASURE DESCRIPTION TARGET Interstate NHS Interstate NHS Percent of Interstate NHS pavements in Poor condition Percent of Interstate NHS pavements in Good condition Pavement conditions are measured through field inspections. Pavements in poor condition are in need of work due to either the ride quality or due to a structural deficiency. Interstate pavement rated as good will be considered for potential pavement preservation treatments to maintain the good rating. < 5% in Poor Condition 50% in Good Condition Non-Interstate NHS Percent of NHS pavements in Poor condition Non-interstate NHS pavements in poor condition are in need of major maintenance. These will be evaluated for potential projects. < 12% in Poor Condition Non-Interstate NHS Percent of NHS pavements in Good condition Non-interstate NHS pavements in good condition will be evaluated for potential preservation treatments. 40% in Good Condition Table 2: Pavement Level of Service Measures 14 P a g e

15 2.2 Asset Management Committee Structure Asset management entails working across multiple offices within an organization and requires a variety of skill sets and knowledge. Having representatives from various functional areas that play a role in asset management is crucial to the TAM implementation process. Asset Management Committees were formed to enhance communication between the Subject Matter Experts (SMEs), Asset Managers and Executive leadership. The Committees are also directly responsible for the Department-wide TAM implementation. Improved communication and clear roles and responsibilities will lead to better synergies and coordination of asset management practices and implementation. The Asset Management Committee responsibilities and structure are shown is Figures 2 and 3 (on the following page). Figure 2: Asset Committee Structure Responsibilities 15 P a g e

16 Figure 3: Asset Committee Structure 16 P a g e
, Statewide Strategic Transportation Plan (SSTP) and the Statewide Transportation")


17 2.3 TAMP Relationship to Other Business Plans Implementation of the TAMP will be demonstrated in the form of proposed investments in the Statewide Transportation Plan (SWTP), Statewide Strategic Transportation Plan (SSTP) and the Statewide Transportation Improvement Program (STIP). Achieving the targets for asset condition and performance of the NHS will ultimately translate into progress toward national performance goals 5. The TAMP will link several existing GDOT plans and programs to fulfill this requirement. Strategic Plan Establishes framework and outlines the agency s overall direction, supports its actions and promotes accountability STIP 4-year program of anticipated revenues that address asset management and improvement Resource Allocations Figure 4: Statewide Plans Comparison Chart SWTP/SSTP Performance-based, focused on economic growth w/investments in GA highway systems 5 CFR Title 23 Part ( 17 P a g e
18 2.4 Self-Assessment In 2009, GDOT conducted a TAM self-assessment as an initial step to assess GDOT s readiness to formalize and implement the Transportation Asset Management program. This marked the first time the Department evaluated its asset management practices (at the management and executive levels) and compared them against TAM best practices as outlined in the self-assessment resource in the AASHTO Transportation Asset Management Guide. In 2017, as a part of MAP-21 requirements continued through the FAST ACT, an updated TAMP was required to better align with the Federal guidelines. The Department re-assessed its TAM practices by administering another self-assessment survey. The Task Force members participated in a TAM survey, which, this time, was customized to better fit the current assessment needs (See Appendix A). The purpose of the survey was to identify gaps related to the federal TAMP requirements and to propose and incorporate improvement initiatives the Department needed to achieve compliance. In addition to the executive and senior management levels, the self-assessment was also issued to SMEs (working levels). The justification for soliciting feedback from the practitioner s (SMEs) point of view was to determine if process and/or communications gaps between different survey groups (leadership, senior management and working level) existed. The survey participation rate was 72% (47 out of 65 invitees participated), and the majority of the feedback came from the representatives from the offices and divisions that directly oversee and manage Georgia DOT s largest assets (pavements, bridges and signs). Specifically, the participants represented the following groups: Bridge, Pavement Maintenance, Traffic Operations, Information Technology, Transportation Data, Finance, Planning, and Materials and Testing. The participants were asked to evaluate the GDOT s TAM readiness related to GDOT pavements, bridges, and sign assets. The results of the assessment revealed the following areas of concern: 1. Data accessibility, data integration and information system were most likely localized 2. Data accuracy had a low level of confidence 3. Risk identification and mitigation strategies seemed to be inconsistently practiced 4. Knowledge management was not centralized Department-wide 5. Life-cycle modeling systems were not readily accessible and/or used due to either lack of systems, expertise or both 18 P a g e
19 The self-assessment summary of results served as an identifier of the risks and process-related gaps that could jeopardize TAMP development and TAM implementation. The gaps will help GDOT to identify improvement strategies that will become a part of a new TAM implementation plan. The survey results were communicated to both the TAM Task Force and Steering Committee members. The results were also posted to the GDOT TAM SharePoint site. The survey findings will be used as the new baseline for measuring TAM implementation progress. 19 P a g e
20 3.0 Asset Inventory and Evaluations Georgia's integrated roadway system is considered one of the best maintained in the nation. The system consists of network city streets, county roads, State highways, national highways and interstates which form a system of public roads that efficiently carries travelers and goods. The National Highway System (NHS) is a significant component of Georgia s transportation system. It is comprised of approximately 7,200 miles of roadway within the State which include interstates and local roads. Of those miles, there are approximately 4,300 structures of both bridges and bridge culverts. Although there are locally owned pavement and bridge assets on the NHS, GDOT keeps an inventory of all pavement systems on the NHS and all bridge structures throughout the State. This section summarizes the asset inventory and evaluation for GDOT s pavement and bridge structures. The collected data is entered into the Georgia Asset Management System (GAMS) which supports the intent of 23 CFR , and is in the process of being verified for compliance by GDOT. 3.1 Pavements Evaluation Interstate and roadway maintenance needs are identified through scheduled inspections, performance reports and public reporting. Scheduled maintenance inspection programs are conducted by the Georgia DOT s Office of Maintenance. Georgia DOT s Office of Transportation Data (OTD) collects and records asphalt and concrete pavement data annually. The pavement data is collected and processed using the Videolog Program. This program employs vehicles equipped with an array of sensors to collect International Roughness Index (IRI) for the full length of the State Route (SR) system and NHS (that is on the SR system and off-sr system) in both directions, every 0.10 of a mile, in the right outside travel lane. While helpful, the IRI measures ride quality (i.e. pavement smoothness) but not the condition of the entire pavement structure. This is done to support both federal reporting requirements 6 and to provide information to the Office of Maintenance for their assessment of the pavement condition on the SR system CFR Data Requirements ( 20 P a g e
21 At the State level, GDOT has a more comprehensive Pavement Management System, with the Computerized Pavements Condition Evaluation Systems (CoPACES) ratings. The CoPACES system evaluates pavement distresses using deduct values, and it calculates the condition rating score by subtracting the deduct value from 100 to obtain the health of the pavement. The CoPACES rating scores range from with a score of 100 reflecting the best condition. The Department finds these ratings to be a more comprehensive assessment of the overall condition of the pavements. The CoPACES rating includes IRI, cracking, rutting, and faulting which are the four ratings used as the national pavement performance measure. In addition, CoPACES also includes shoving, bleeding, and patching. These combined elements provide GDOT with a more detailed condition assessment of the roadway. CoPACES is not a national performance measure requirement. CoPACES is completed annually by the Assistant Area Engineer working in Maintenance in each of Georgia s 7 districts on all routes they are responsible to maintain. All pavements with CoPACES rating of 75 and below are turned into the District Maintenance office and are re-rated by the Assistant District Maintenance Engineer and appropriate Liaison Engineer from the State Maintenance office. Concrete surveys are also performed annually by the District Bridge Maintenance Manager. There is a quality assurance process in place for both surveys to ensure consistency in the calculation of CoPACES ratings. Pavement conditions and corresponding CoPACES ratings are described as follows: Good (85-100) A roadway in good condition ranges from a new road surface to the beginning signs of aging. This roadway contains some cracks in the riding surface and is beginning to fade in color. Fair (70-85) A roadway in fair condition is beginning to show signs of advancing cracks in the wheel paths (where you drive) and across the lanes. The cracks in this section should either be sealed or scheduled to be sealed. Poor (<70) A roadway in poor condition has advanced cracking through a majority of the riding surface. The cracks may begin to resemble an alligator skin pattern. This roadway may have several patched areas. PAVEMENTS SYSTEM CENTER-LINE MILES TOTAL LANE-MILES Interstate NHS 1,250 7,000 Non-Interstate NHS 5,950 20,000 TOTAL 7,200 27,000 Table 3: Pavement Inventory 21 P a g e
22 3.2 Bridge Evaluation The Bridge Maintenance Unit (BMU) in the Bridge Design Office is responsible for inspecting bridge structures and being in compliance with federal regulations National Bridge Inspection Standards (NBIS) 7. The NBIS, established by FHWA, defines a bridge structure and sets minimum requirements for inspecting bridge structures. Compliance with NBIS inspection guidelines is a requirement of the law. Most of Georgia s bridge structures are inspected every two years. Some bridges are inspected more frequently, depending on structure type (such as fracture critical bridges) or condition. The Department collects two different sets of bridge ratings. The first rating is based on the National Bridge Inspection (NBI) scale from 0 to 9, which corresponds to the following: Ratings of 7-9 are considered Good, Ratings of 5-6 are considered Fair, and Ratings of 0-4 are considered Poor. The second rating is based on the GDOT Manual for Element Bridge Inspection which uses a scale from 1 to 4: Rating of 1 being considered Good, Rating of 2 being considered Fair, Rating of 3 being considered Poor, and Rating of 4 being considered Severe. The score represents a composite score of the health of the State Bridge Inventory. Condition Rating Scale (Based on National Bridge Inspection Rating Scale) GOOD FAIR POOR Condition Rating Scale (Based on Element Rating Scale) GOOD FAIR POOR SEVERE Table 4: Bridge Condition Rating Scale P a g e
23 Bridge and bridge culvert data is collected by twelve topside inspection teams, two specialized inspection teams and two underwater inspection teams across the State. The collected data is entered into the Georgia Asset Management System (GAMS) Bridge Inspector Module. GAMS is used to enter, submit, manage, store and analyze the collected inspection data. Bridge inspection data can also be found in GDOT s 411 and GeoPi systems. GDOT s 411 application provides helpful information by linking to all GDOT databases while GeoPi is an online mapping application for the Department s projects and other transportation information. The inspection process undergoes QA/QC by the Regional Bridge Inspection Specialists (RBIS) who review all of the bridge inspections entered into GAMS. The Department also utilizes consultant inspectors to conduct a quality assurance program and some specialized inspections. QA/QC also includes the RBIS conducting field visits with his or her teams to ensure inspections are being performed in accordance with NBIS standards. Further review for errors occurs when the data is compiled for Federal submittal and analyzed through the FHWA s error check program. This is carried out by the Bridge Asset Manager on a monthly basis. After the QA/QC review, the inspection is approved (finalized), and it becomes viewable in GAMS as the latest, official inspection. BRIDGES AND BRIDGE CULVERTS SYSTEM / ASSET COUNT DECK BRIDGE AREA (SQFT) Interstate NHS - Bridges ,651,806 Non-Interstate NHS - Bridges 2,478 37,964,568 Interstate NHS - Bridge Culverts ,970 Non-Interstate NHS - Bridge Culverts 686 1,125,977 TOTAL 4,297 61,481,321 Table 5: Bridge and Bridge Culvert Inventory 23 P a g e


24 4.0 Performance Targets and Conditions 4.1 Performance Targets Georgia DOT's Strategic Plan defines the mission, vision and goals of the Department. Each goal relates to and supports the State s strategic priorities. Established performance measures help GDOT to evaluate its progress, support decisions and achieve the ultimate goal of providing Georgians with the best possible transportation system 8. MAP-21 performance measures and targets directly address the GDOT s strategic goal to: Efficiently take care of what we have. Infrastructure Condition is also a national goal to maintain the highway infrastructure asset system in a state of good repair. Federal regulations require that State DOTs measure the condition and/or performance of the NHS by establishing targets, assessing progress toward targets, and reporting on condition and/or performance such that the Federal Highway Administration (FHWA) could assess the entire system. Without States reporting on the above factors, it is difficult for FHWA to examine the effectiveness of the Federal-aid highway program as a means to address surface transportation performance at a national level 9. Even though MAP-21/Fast Act does not establish the performance targets for State DOTs, it does specify the minimum condition levels for pavement and bridge assets. Thus, Interstate System pavements shall not exceed more than 5 percent of pavement lane miles in Poor condition. Similarly, the Bridges carrying the NHS (including on and off ramps connected to the NHS) shall have no more than 10 percent of their deck in poor condition. 4.2 Pavement Condition Summary Pavement roughness and condition affect not only ride quality, but also fuel consumption, tire wear, maintenance/repair costs, and the overall life of a vehicle. Additionally, pavement roughness and condition can also impact road users travel time and safety. 8 Performance Management Dashboard: CFR Part 490: 24 P a g e
25 By incorporating preservation strategies and maintaining Interstates at a high level, the pavements life-cycles are extended, postponing more costly reconstruction activities. In addition, a well-maintained roadway can benefit end users by reducing overall vehicle operating costs. The biggest benefit to GDOT is the strategic allocation of funding based on data driven decisions that result in performing the right activities at the right time. The Percent of Pavements in Good, Poor and Fair Condition is a measure that evaluates the health of pavements on Georgia s Interstates. This is not a rating of ride quality or smoothness, but rather of how well the interstate pavement structure is maintained. GDOT is required to report federally on the following 4 pavement condition metrics that are inclusive of: % of Interstates in Good Condition % of Interstates in Poor Condition % of Non-Interstate NHS in Good Condition % of Non-Interstate NHS in Poor Condition The Department has adopted the federal minimum condition level of Interstate pavements in Poor condition at 5% or less as a target for Georgia s Interstate pavements. GDOT will maintain condition levels as the Department continues to enhance pavement management practices by moving toward automated data collection and developing degradation curves for pavements. The Department reviewed the historical Highway Performance Monitoring System (HPMS) data to predict current performance trends. Targets for % of interstates in good condition, % of non-interstates-nhs pavements in poor condition, and % of non-interstates-nhs pavements in good condition, were set based on that data. This allows the Department to be confident it is maintaining pavements in a state of good repair. The FHWA HPMS Pavement Report Card is the result of an expanded sample calculation; meaning that portions of the network data provided have been selected to represent the whole. However, complete network data on the NHS is required in HPMS and submitted by GDOT. The pavement condition reports provided by OTD utilize the complete data available on the NHS network giving a more accurate/complete depiction of the condition status. Future changes such as increased truck traffic, changes in traffic volumes/patterns, or an increase/decline in funding levels for preventive maintenance and capital work could change the condition of pavements. Future TAMPs should reevaluate targets for the NHS and interstate system based on changes. 25 P a g e
26 The current pavement conditions are below. PAVEMENTS SYSTEM CONDITION and TARGETS Federal Reporting % Good Target % Fair % Poor Target Interstate NHS 60% 50% 36% 4% 5% Non-Interstate NHS 44% 40% 46% 10% 12% Table 6: Pavement Condition Data 4.3 Bridge Condition Summary The bridge measure tracks the percent of Bridges that meet or exceed a determined standard. Georgia s stateowned bridges are evaluated based on two criteria: strength (i.e., can the bridge carry all legal loads for its type), and condition. Bridge condition data is tracked for all bridges in the State. Currently GDOT s bridges meet the federal requirement of no more than 10% of total NHS bridge deck area in poor condition. The Department has set a target of 60% (over a 4year period) of total NHS bridge deck area in good condition. Below are the current bridge conditions. BRIDGE STRUCTURES SYSTEM / ASSET CONDITION and TARGETS % Good Target % Fair % Poor Target NHS - Bridges and Bridge Culverts 49.11% 60% 49.54% 1.35% 10% NHS - Bridges 47.00% 51.90% 1.11% NHS - Bridge Culverts 45.46% 54.18% 0.36% Table 7: Bridge Condition Data 26 P a g e
27 5.0 Life-cycle Planning Management Life-cycle Planning is the cost-effective management of transportation assets over their whole lives, from the initial construction until the time the assets are retired/disposed. The emphasis is on long term, cost-effective preservation and sustainability without sacrificing system performance or public safety. At Georgia DOT, asset life-cycle planning management involves looking at an asset/a group of assets over its/their life span(s) and applying preservation treatments to prolong its/their remaining useful life while supporting progress toward the national goals. GDOT incorporates performance measures and targets to evaluate asset condition and to determine the annual financial need. The Department also tiers its assets by functional and risk priority levels. Different asset preservation methods significantly prolong an asset s useful life while sustaining performance at the most optimal level affordable. Also, preservation is significantly less costly than replacement. As part of TAM implementation, Georgia DOT will apply Life-cycle Planning in the areas of pavements and bridges which will allow for preventive maintenance activities that will extend the life of the assets at a lower cost over the long term. The following describes how this strategy will be applied. 5.1 Pavement Management The Department identifies its pavement needs based on network conditions. GDOT prioritizes routes as critical, high, medium or low based on their State Route prioritization designation to determine appropriate treatments and funding levels. The life expectancy of the pavements and planned treatment schedules are based on historical trends. GDOT uses the most cost effective preservation treatments to extend the service life of its network. Some of these treatments include fog seals, micromilling, crack filling, chip seals, micro-surfacing, patching and traditional mill and inlay. By performing a number of preservation treatments, GDOT lessens the likelihood of more costly rehabilitation activities. When it is no longer cost effective to apply a preservation treatment, a more substantial project may be programmed which could include a deep mill and inlay. GDOT is currently utilizing pavement management software that optimizes its pavement network. On a network level, the pavement management software, GAMS, performs a life-cycle analysis of various treatment strategies on each roadway segment. The life-cycle analysis is based on the benefit-cost ratio that evaluates the benefit of the life-cycle strategy against the costs. 27 P a g e
28 The program analyzes pavement segments and compares preferred treatment strategies (those with the highest benefit/cost ratio) statewide. The software models the deterioration of an individual segment. It also identifies potential treatment options (preservation, minor rehabilitation, major rehabilitation and/or reconstruction) for that segment based on different distresses identified through CoPACES evaluation (raveling, rutting, bleeding, pushing, faulting and various cracking types). The cost for each potential treatment (or combination of treatments) over time, is calculated. The benefit is manifested as an increase in the pavement condition score over the analysis period. The pavement condition score incorporates a traffic-weighting factor, which increases the benefit proportional to the amount of Average Annual Daily Traffic (AADT) on the highway segment, in each prioritization category. This ensures that treatments on highway segments with high traffic volumes may take precedence over segments with low volumes. The benefit of a treatment or strategy on a given highway segment is divided by the cost to determine the benefit/cost ratio. The higher the benefit/cost ratio for a treatment or strategy, the more cost-effective the strategy is. The pavement management software identifies cost-effective treatment categories given site conditions and predictive pavement segment deterioration trends. The project level process evaluates various treatments to select the most appropriate treatment for the pavement conditions within the project. 5.2 Bridge Management Bridges experience a natural aging process, and each bridge is unique in the way it ages. Various factors including material makeup, weather, and traffic loads play a role in how quickly a bridge ages. While there is no precise way to define an exact useful bridge life, for the purpose of asset management, useful life is considered to be 75 years. Per Federal guidance, the theoretical design life of a bridge has been 50 years, however with new design guidelines and construction materials the anticipated service life for newly constructed bridges is 75 years. Bridge life-cycle planning analysis consist of the following components: degradation curves, preventative maintenance items, minor rehabilitation items, and major rehabilitations items. Currently, bridge construction strategies are identified based on the bridge condition rating to allow cost-effective bridge projects to be implemented sooner and faster. In the future, the goal is to have a matrix for each bridge providing a cost for an activity vs. return of service (years) for any number of preservation or rehabilitation activities. GDOT has a project under contract with the University of Georgia to develop this tool. The anticipated delivery of this 28 P a g e
29 project is within the next 3 years. It is planned to utilize the tool to analyze existing bridge assets. However, once in place, it will be used for new bridge structures as well. 6.0 Risk Management Analysis The evaluation of risk plays a big part in integrating TAM principles into the Department s business strategies as well as influencing decisions. As it pertains to transportation assets, risk is determining how susceptible an asset is to a natural or manmade hazard that would prevent or limit the asset from serving its identified purpose. When considering the risk inherent to an asset, generally the following questions are considered: How likely will a catastrophic event or hazard occur that could impact the asset? What are the consequences to the asset if a catastrophic event or hazard occurs? What are the impacts to the agency or public if the asset can no longer perform its function? What various risk categories should we consider? What agency and programmatic risk does the Department face? Overall, the goal is to enhance the Department s decision making capabilities regarding the preservation of the Departments assets. In 2012, GDOT s Office of Planning formed a group of stakeholders consisting of subject matter experts from the bridge and pavement offices, executive leadership, and a consulting team. Several meetings were held to identify the types of risks that should be considered as part of the risk assessment. An analysis was conducted to develop a priority listing not only for the risks but also the pavement and bridge systems which led to an overall risk profile and preservation priority of the entire NHS system. During this analysis, more meetings were held to vet data through the task team. Recommendations and tools were developed to aid in the decision making for prioritizing maintenance projects. In addition, GDOT utilizes the State Prioritization Program that ranks the state routes as critical, high, medium or low, based on a value determined by pre-defined criteria. Criteria such as functional classification, average annual daily traffic (AADT), lane count and more are not based on individual segments of the state route system but more of a blanket classification. The risk assessment ranks our state routes based on the individual segment s operational risks in the event of failure. 29 P a g e

30 6.1 Risk Identification and Assessment In March of 2016, a GDOT risk assessment was completed. The risk assessment led to the development of a risk profile and preservation priority for the entire NHS. The profile reflects relative preservation priorities. Each bridge and section of pavement has been categorized into one of three preservation priority tiers high, medium, and low. The priority tiers are directly related to the results of the risk assessment. The priorities were determined by applying the risk assessment framework shown in Figure 5. The type of risk considered in this risk assessment analysis is performance failure. Performance failure occurs when an asset deteriorates to the point at which significant work is required, resulting in increased costs to GDOT and travel disruptions. High Priority Medium Priority Low Priority Figure 5: Risk Assessment Framework The risk assessment framework consists of two dimensions: Condition priority - This dimension reflects the likelihood of performance failure. As an asset deteriorates, it becomes more likely that it will require significant work. Bridges and pavements were assigned a condition score on a scale of 0 to 1. A higher score indicates a higher likelihood of failure, and therefore a higher priority in terms of condition. 30 P a g e
31 Economic impact priority - This dimension reflects the consequences of performance failure. If an asset fails and requires significant work, the people and goods using that asset will be impacted. Interstate Highway System (IHS) corridors were assigned an economic impact score on a scale of 0 to 100. A higher score indicates higher consequences of failure, and therefore a higher priority in terms of economic impact. EXTERNAL RISKS External risks were also evaluated as part the risk assessment, but separately from the framework and risk profile previously described. External risks reflect events that may result in damage or closure to the NHS, but cannot be addressed proactively through preservation activities. The results of the external risk assessment are provided to inform subsequent planning, programming, and operations efforts. The analysis of external risks included earthquakes, floods, hurricanes, and tornados. For each of these risks, the NHS was categorized into tiers based on the relative frequency or intensity of the event. Other external risks that were not included in the risk assessment but are very important to consider include: Operational hazards (such as vehicle collisions, heavy loads and construction incidents) Environmental (erosion, weathering, fire) Asset s age Standalone emergency events PROGRAMMATIC RISKS As projects are identified for bridge and pavement maintenance, programmatic risks can occur and affect the timeliness of the preservation activities. Some of these risks might include: reduced funding or funding uncertainties, reduced or insufficient staffing, project scoping issues, data reliability and increased, standalone emergency events. Some other risks deal with legislative changes. For example, Congressional District balancing is a State law that requires GDOT distribute 80 percent of its State and federal transportation improvement funds equally among Georgia s congressional districts. This can have a direct effect on how prioritized projects are funded. 31 P a g e
32 6.2 Risk Mitigation Plan Traditionally, highway agencies across the U.S. have addressed preservation needs by working on their worst assets first. The intent of GDOT s risk assessment is to enable GDOT to apply preservation activities to the mostat-risk assets first. This approach focuses preservation activities on the assets which, if loss of service occurred, would result in a larger economic impact than lesser priority assets. This type of coordination could lead towards more of a corridor management approach for high preservation/priority portions of the NHS. In addition, the Department uses local maintenance staff to perform periodic inspections on pavements. This may occur during routine inspections within any given county, or as part of the CoPACES evaluation. These inspections evaluate the current condition of the pavement, and may detect deterioration and damage to the pavement that has progressed further than anticipated. State Maintenance personnel also work with the National Weather Service, Georgia Emergency Management Agency, Georgia State Patrol, and other State and federal partners to monitor conditions for natural disasters that may impact the road network. This helps to prioritize and monitor high risk assets. It is the intent of the Department to review historical documents (contracts, plans, etc.) to evaluate the NHS roadways or bridges as laid out in 23CFR 667 no later than the required date. Moving forward, GDOT will access repeated damages from winter weather, pre-treatments, and hurricanes on pavements through updated deterioration models as appropriate. 32 P a g e
33 6.3 The Risk Register As TAM is implemented throughout the agency, the owner of each asset must evaluate the risks associated with the asset. This is critical to establish funding scenarios for various assets and programs. AGENCY RISK CONSEQUENCES LIKELIHOOD OWNER STRATEGIES TO ADDRESS RISK Limited Staffing Resources/ Knowledge retention Project inactivity Department wide - Targeted external recruitment initiatives - Filling vacancies using temporary staffing - Utilizing contract/consultant services Access to assets due to natural emergencies Personal injury Traffic Congestion Litigation Maintenance/OTD - Review/update Emergency Management Plan (EMP) annually - Make certain staff has proper training - Test EMP using relevant scenarios to evaluate staff, ensure protocols are coordinated with other respondents and identify gaps Project Delivery Schedules Insufficient/Sustainable Funding Data Reliability Resource waste Loss of economic acitivity Infrastruction deterioration Poor decision making Planning/Program Delivery Commissioner/ Planning Director/Finance Asset Owners/IT - Determine need for outsourced services - Educate Project Managers on various risks to schedules - Include adequate time for contract negotiation - Lack of coordination with capital versus maintenance programs (pavement and bridge) - Continue communication with the Georgia General Assembly - Transportation Investment Act (TIA) - A one percent regional sales tax to fund transportation improvements - Monitor the next Federal transportation bill through AASHTO - Better tracking historical data - Knowledge Management System Organizational Structure/Changes in Laws and Regulations Siloed communication Loss of flexibilty to apply resouces Planning - Better communication of investment methodologies - Expand meetings to more participants -Provide Training to other SMEs involved in planning processes (i.e. STIP, SWTP) Table 8: Risk Register 33 P a g e
34 7.0 Financial Plan and Gap Analysis An asset management Financial Plan should provide the projected 10 year available revenue and expenditures on an annual basis, which will be used to support asset management objectives in order to achieve State DOT targets. 7.1 Anticipated Funding Revenues Anticipated funding for the identified needs will be determined by comparing revenues for FY to the projected investment assessment provided by the maintenance and bridge office for each asset. The Statewide Transportation Improvement Program (STIP) is a 4 year program of anticipated revenues and is used as a base for projecting the 10 year plan. The Office of Financial Management (OFM) will incorporate funding sources from anticipated Federal and State funds and General Obligation Bonds. Inputs in the Financial Plan development set the baseline funding for bridge replacements and maintenance as well as resurfacing which can be used in the development of the asset management plan. Also, funding included in the STIP for specific projects improvements and major rehabilitation to current assets may also be used depending on the projects that are programmed since they may impact asset conditions. 7.2 Projected Funding Levels Federal funding levels are derived from the Highway Funding Matrix and the Balancing sheet produced by the Office of Financial Management. This includes the matched federal funding level for the 4 year STIP period. After the STIP period, funding levels are grown at 1% annually. State funding levels currently use expected motor fuel and fee revenues budgeted for the amended fiscal year 18 and fiscal year 19 budgets and are then grown at 1% annually. Bond issuances and other financing revenues are recognized in their anticipated year based on investment assumptions. Federal Lump Sums are funding amounts for items such as bridge maintenance and resurfacing as well as the bridge program. Lump Sum is programmatic funding to address the highest priority needs on an annualized basis without having to program individual projects in the STIP/TIP. Funding amounts are provided for the STIP years and then grown at 1% annually. These amounts are provided by the Chief Engineer based on the needs to address asset management versus the capital program. The Lump Sum program are set aside funds for eleven groups of projects that do not affect the capacity of the roadway. The Lump Sum projects program is 34 P a g e
35 intended to give the Department and flexibility on a programmatic basis while fulfilling the requirements of the STIP. Georgia utilizes state funded lump sum for bridge, resurfacing, operations, Intelligent Transportation System (ITS) and quick response which act similar to the federal lump sum banks. Other funding such as routine maintenance and local maintenance and improvement (local formula program) which also go to improve conditions state wide. 7.3 Estimated Funding Needs Funding needs will be based upon required maintenance activities for pavement and bridge conditions to meet the anticipated federal performance thresholds. Funding needs will also be based upon funding availability and tradeoff analysis per the Statewide Transportation Plan (SWTP). Each year, federal funds in the STIP are estimated based on the Department s expectations of what Congress will authorize to be spent on the program. Estimates are subject to change based on forthcoming yearly appropriation and obligation levels set by Congress. Funding needs for the TAMP will be revisited once a full life-cycle planning analysis is completed. 7.4 Pavement Funding Gap Analysis Current federal and state funding of approximately $458 million dollars per year ($352 million for maintenance and capital maintenance, $75 million for routine maintenance and $31 million in pavement striping) is utilized for NHS and state route maintenance and preservation, capital maintenance, routine maintenance and pavement striping (inclusive of raised pavement markers). Georgia DOT is satisfying the requirement of having less than 5% of interstate roads in Poor condition. Georgia DOT is currently in the process of setting 10-year targets for: Percent of Interstate Pavements in Good Condition Percent of Non-Interstate NHS Pavements in Good Condition Percent of Non-Interstate NHS Pavements in Poor Condition The Department currently uses a field evaluation system (CoPACES) to rate Interstate, NHS, and State Route pavements. This system factors in a number of deficiencies and includes IRI, cracking, faulting, and rutting in its overall score. These field evaluations are performed yearly. The Department is currently evaluating using 35 P a g e
36 automated data collection vehicles to collect the CoPACES data. These vehicles have the ability to collect all data required for a Highway Performance Monitoring System. Future gap analysis will use assumed deterioration of the overall CoPACES scores for all routes. The Department is using an assumed CoPACES deterioration rate for asphalt pavement and for concrete. In future years, it is anticipated the Department will be able to further refine these numbers to provide deterioration within other sub-groups. Ten year evaluation scenarios will be run using the assumed deterioration rates. Scenarios will look at changes to the network s score based on current funding, a reduction of funding, an increase of funding, and unconstrained funding. This last scenario will be used to estimate the current dollar value of all needs. These scenarios will be updated to account for funding changes to capital program needs. Using these scenarios and the targets set in the categories mentioned above, the Department will be able to predict yearly scorecards along with a 10 year projection of performance based on current condition levels and funding levels. The final scores in these scenarios will be compared to set targets. Looking at the four scenarios above, the Department should be able to predict gaps in future funding at the State or district level. If funding remains the same over the next ten years as current funding levels, it is expected that the Department will continue to meet a state of good repair. 7.5 Bridge Funding Gap Analysis Current funding levels of approximately $330 million dollars per year, which include both replacements for local, state and Interstates and capital maintenance, seem to be adequate to maintain the current level of service for the Department s inventory of bridge structures. Funds will be allocated to maintain current service levels and if cost analysis shows the ability to improve the service level (for example Fair rating to Good rating) a rehabilitation project will be developed. The current value of the NHS bridge structures maintained by the Department is $7,277,377,525 and the value of the NHS structures maintained by locals is $358,778,708. The Department is currently satisfying the requirement of having less than 10% of total NHS bridge deck area in Poor condition and is in the process of setting long range (10 year) targets for the percent of NHS bridges in good and poor condition. The completion of the life-cycle planning analysis will enable GDOT to identify both the short-term routine maintenance needs and long-term capital costs and allow annual spending profiles per asset to be produced. In addition, a life-cycle plan enables long-term predictions about the deterioration of various assets and their maintenance needs to be forecasted. This information is vital to identify true gaps. Currently, the Department 36 P a g e
37 identifies replacement, rehabilitation and preservation projects by running specific queries searching for specific bridges parameters. Future gap analysis capabilities for the Department will include deterioration modeling along with rehabilitation recommendations and associated cost. Along with the NHS bridges, the Department has a State Route system that must be maintained to ensure that freight movement is seamless throughout the State and the traveling public s expectations are met. Factors contributing to declining bridge conditions are Georgia s growing economy (increased truck and vehicle traffic), along with increased port activity (additional freight moving into and through the State). However, if funding remains the same over the next ten years as current funding levels, it is expected that the Department will continue to meet a state of good repair. 37 P a g e
38 8.0 Investment Strategies 8.1 Overall Strategy Development Process The 2040 Statewide Transportation Plan (SWTP)/2015 Statewide Strategic Transportation Plan (SSTP) is a GDOT planning document that demonstrates how best to allocate limited funds in a manner that optimizes performance and supports progress towards long-term transportation goals and objectives 10. For example, how much money should be spent on preserving the existing transportation network versus expanding it? Or, within the preservation program, how much should be allocated to pavement needs versus bridge needs? All transportation agencies face these types of tough decisions. Most agencies address them through a combination of historic funding precedent and/or ad hoc policy development. With the update of the TAMP, the Department will continue moving towards evaluating plan recommendations and placing more emphasis on execution of the plan through target setting and reporting. 8.2 Pavement Specific Strategies Future pavement network condition is forecasted using FHWA s Highway Economic Requirements System tool (HERS) version HERS is a computer model used to estimate investment requirement for pavement and to evaluate alternative highway investment levels based on performance objectives and targets. HERS generates an optimal pavement preservation work program based on engineering standards and economic analysis to minimize pavement deficiencies over a plan horizon. HERS projects future needs based on planning level cost estimates for the improvements determined within the models and based on minimum deficiency levels for pavement condition and engineering standards. GDOT s performance measures will be aligned with Federal performance measures to meet, at minimum, federal condition thresholds. Completion of life-cycle planning analysis will provide the necessary information to complete this section SWTO/2015 SSTP STP%20Reports/SWTPSSTP%20FINAL%20REPORT-00.pdf 38 P a g e
39 8.3 Bridge Specific Strategies The future investment needs analysis relies on FHWA s National Bridge Investment Allocation System (NBIAS) tool to forecast future bridge network conditions for existing assets in Georgia. The analysis involved different annual budget levels and performance targets in a variety of scenarios. NBIAS is designed to minimize maintenance costs by generating an optimal set of preservation actions for bridge elements. The performance measure used is percentage of bridge deck area that is not structurally deficient also referred to as being in poor condition. GDOT s performance measures will align with Federal performance measures to meet, at minimum, federal condition thresholds. Completion of life-cycle planning analysis will provide the necessary information to complete this section. 39 P a g e
40 (Page left blank intentionally) 40 P a g e
41 Appendices 41 P a g e


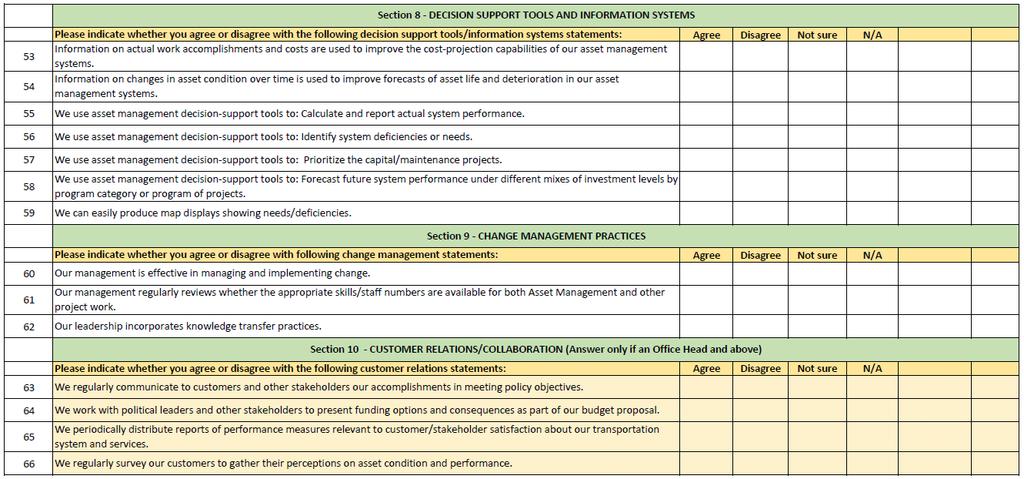
42 Appendix A- TAM Self- Assessment Self-Assessment Questions 42 P a g e

43 43 P a g e