Fragile Networks: Identifying Vulnerabilities and Synergies in an Uncertain Age
|
|
|
- Matilda Byrd
- 5 years ago
- Views:
Transcription

1 Fragile Networks: Identifying Vulnerabilities and Synergies in an Uncertain Age Anna Nagurney John F. Smith Memorial Professor Isenberg School of Management University of Massachusetts Amherst, MA Tutorial Part II
2 Outline of Tutorial Part I: Network Fundamentals, Efficiency Measurement, and Vulnerability Analysis Part II: Applications and Extensions Part III: Mergers and Acquisitions, Network Integration, and Synergies
3 Robustness in Engineering and Computer Science IEEE (1990) defined robustness as the degree to which a system of components can function correctly in the presence of invalid inputs or stressful environmental conditions. Gribble (2001) defined system robustness as the ability of a system to continue to operate correctly across a wide range of operational conditions, and to fail gracefully outside of that range. Schilllo et al. (2001) argued that robustness has to be studied in relation to some definition of a performance measure.
4 Motivation for Research on Transportation Network Robustness According to the American Society of Civil Engineering: Poor maintenance, natural disasters, deterioration over time, as well as unforeseen attacks now lead to estimates of $94 billion in the US in terms of needed repairs for roads alone. Poor road conditions in the United States cost US motorists $54 billion in repairs and operating costs annually.
5 Network Robustness The focus of the robustness of networks (and complex networks) has been on the impact of different network measures when facing the removal of nodes on networks. We focus on the degradation of links through reductions in their capacities and the effects on the induced costs in the presence of known demands and different functional forms for the links.
6 Robustness in Transportation Sakakibara et al. (2004) proposed a topological index. The authors considered a transportation network to be robust if it is dispersed in terms of the number of links connected to each node. Scott et al. (2005) examined transportation network robustness by analyzing the increase in the total network cost after removal of certain network components.
7 A New Approach to Transportation Network Robustness
8 The Importance of Studying Transportation Network Robustness The US is experiencing a freight capacity crisis that threatens the strength and productivity of the US economy. According to the American Road & Transportation Builders Association (see Jeanneret (2006)), nearly 75% of US freight is carried in the US on highways, and bottlenecks are causing truckers 243 million hours of delay annually with an estimated associated cost of $8 billion. The number of motor vehicles in the US has risen by 157 million (or %) since 1960 while the population of licensed drivers grew by 109 million (or %) (US Department of Transportation (2004)).
9 The Transportation Network Robustness Measure Under U-O Behavior Nagurney and Qiang, Europhysics Letters, 80, December (2007) We utilize BPR functions user link cost functions c for the robustness analysis.

10 A Simple Example Assume a network with one O/D pair: w1=(1,2) with demand given by dw1=10. The paths are: p1=a and p2=b. In the BPR link cost function, k=1 and β=4; ca0=10 and cb0=1. Assume that there are two sets of capacities: Capacity Set A, where ua=ub=50; Capacity Set B, where ua=50 and ub=10.
11 Robustness of the Simple Network
12 We can see from the Figure that the network with capacity set A is more robust under different capacity retention ratios. This is because that network has more slack/redundant capacity that is available when the links are subject to partial degradation.
13 Another Example: Braess Network with BPR Functions Instead of using the original cost functions, we construct a set of BPR functions as below under which the Braess Paradox still occurs. The new demand is 110.
14 β= 1 β= 2 β= 3 β= 4
15 From this example we can see that, for a given capacity retention ratio, when the value of beta is small, the robustness of the network drops less severely than when it is large. This is due to the fact that this parameter indicates, in part, the effect of congestion on the links. For a certain capacity reduction, a less congestion-sensitive network can keep its efficiency closer to the original value.

16 Example: The Anaheim, California Network There are 461 nodes, 914 links, and 1, 406 O/D pairs in the Anaheim network.
17 Robustness vs. Capacity Retention Ratio for the Anaheim Network
18 By applying a similar concept, we can also study network robustness when the network capacities are enhanced. In such situations, gamma will be greater than or equal to 1 and the robustness measure is a capacity enhancement ratio.
19 Different Perspectives on Transportation Network Robustness: Relative Total Cost Indices The index is based on the two behavioral solution concepts, namely, the total cost evaluated under the U-O flow pattern, denoted by TCU O, and the S-O flow pattern, denoted by TCS O, respectively. The relative total cost index for a transportation network G with the vector of demands d, the vector of user link cost functions c, and the vector of link capacities u is defined as the relative total cost increase under a given uniform capacity retention ratio γ (γ (0, 1]) so that the new capacities are given by γu. Let c denote the vector of BPR user link cost functions and let d denote the vector of O/D pair travel demands. We still utilize BPR functions user link cost functions c for the robustness analysis.
20 Definition of The Relative Total Cost Indices where TCU O and TCγU O are the total network costs evaluated under the U-O flow pattern with the original capacities and the remaining capacities (i.e., γu), respectively. where TCS O and TCγS O are the total network costs evaluated under the S-O flow pattern with the original capacities and the remaining capacities (i.e., γu), respectively.
21 Example: The Sioux Falls Network From the above figure, we can see that the Sioux-Falls network is always more robust under U-O behavior except when β is equal to 2 and the capacity retention ratio is between 0.5 and 0.9.
22 Example: The Anaheim Network Ratio of IU O to IS O for the Anaheim Network under the Capacity Retention Ratio γ
23 Relationship Between the Price of Insightsand Gained the Total AboveCost Example Anarchy the from Relative Indices ρ captures the relationship between total cost across distinct behavioral principles. The total emissions generated are lower under the U-O behavioral The two relative principle total from costγ= indices 1 untilare γ =focused.7. For γon = the.7,.6, and so degradation on, through of γnetwork =.1. Therefore, performance under within S-O U-O behavior, or S-O the transportation behavior. network may be viewed as being more robust an environmental perspective. from The relationship between the ratio of the two indices and the price of anarchy: The rankings of the links are identical for this example when the travelers behave in either a U-O or in a S-O manner. The result from the above ratio can be less than 1, greater than 1, or equal to 1, depending on the network and data.
24 Robustness in Supply Chains

25 Depiction of a Global Supply Chain
26 Supply Chain Disruptions In March 2000, a lightning bolt struck a Philips Semiconductor plant in Albuquerque, New Mexico, and created a 10-minute fire that resulted in the contamination of millions of computer chips and subsequent delaying of deliveries to its two largest customers: Finland s Nokia and Sweden s Ericsson. Ericsson used the Philips plant as its sole source and reported a $400 million loss because it did not receive the chip deliveries in a timely manner whereas Nokia moved quickly to tie up spare capacity at other Philips plants and refitted some of its phones so that it could use chips from other US suppliers and from Japanese suppliers. Nokia managed to arrange alternative supplies and, therefore, mitigated the impact of the disruption. Ericsson learned a painful lesson from this disaster.

27 The West Coast port lockout in 2002, which resulted in a 10 day shutdown of ports in early October, typically, the busiest month. 42% of the US trade products and 52% of the imported apparel go through these ports, including Los Angeles. Estimated losses were one billion dollars per day.

28
29 As summarized by Sheffi (2005), one of the main characteristics of disruptions in supply networks is the seemingly unrelated consequences and vulnerabilities stemming from global connectivity. Supply chain disruptions may have impacts that propagate not only locally but globally and, hence, a holistic, system-wide approach to supply chain network modeling and analysis is essential in order to be able to capture the complex interactions among decision-makers.

30 The Multitiered Network Structure of a Supply Chain
31 Assumptions Manufacturers and retailers are multicriteria decisionmakers Manufacturers and retailers try to: Maximize profit Minimize risk Individual weight is assigned to the risk level according to decision-maker s attitude towards risk. Nash Equilibrium is the underlying behavioral principle.


32
33 What About Financial Networks?
34 Because today s financial networks may be highly interconnected and interdependent, any disruptions that occur in one part of the network may produce consequences in other parts of the network, which may not only be in the same region but miles away in other countries.
35 In 2008 and 2009, the world reeled from the effects of the financial credit crisis; leading financial services and banks closed (including the investment bank Lehman Brothers), others merged, and the financial landscape was changed for forever. The domino effect of the U.S. economic troubles rippled through overseas markets and pushed countries such as Iceland to the verge of bankruptcy (see also Chari, Christiano, and Kehoe (2008)).
36 It is crucial for the decision-makers in financial systems (managers, executives, and regulators) to be able to identify a financial network s vulnerable components to protect the functionality of the network. Our financial network performance measure (Nagurney and Qiang (2008)) and component importance indicator was published in the edited volume Computational Methods in Financial Engineering.
37

38
39 The financial network performance measure εfn defined above is actually the average demand to price ratio. It measures the overall (economic) functionality of the financial network. When the network topology G, the demand price functions, and the available funds held by source agents are given, a financial network is considered performing better if it can satisfy higher demands at lower prices.
40
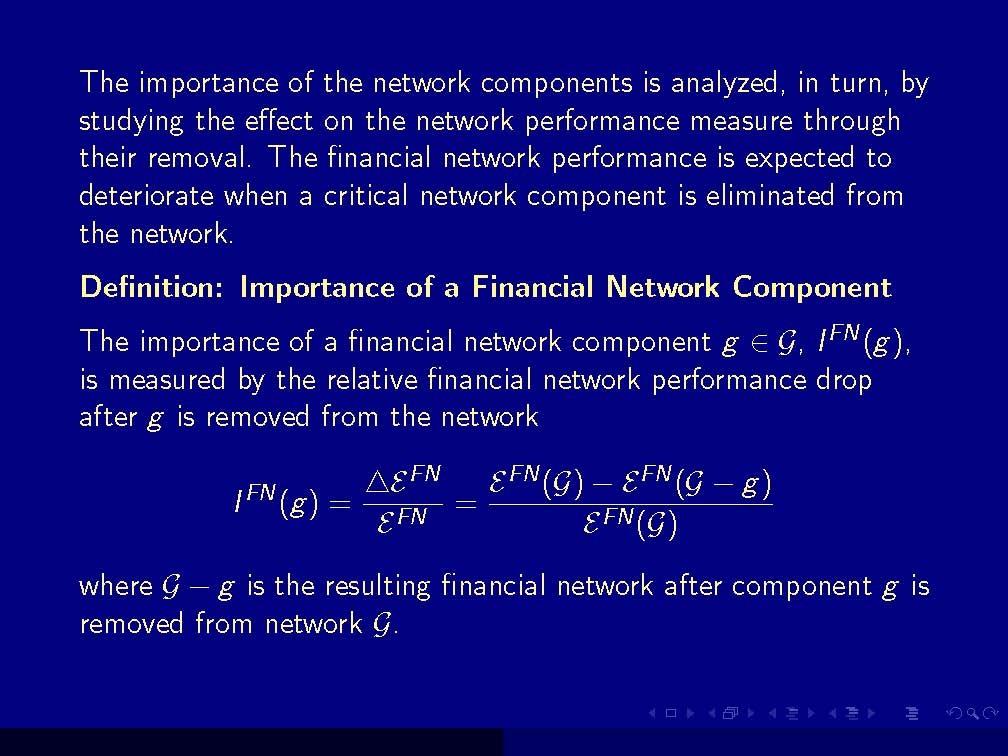
41 It is worth pointing out that the importance of the network components is well-defined even in a financial network with disconnected source agent/demand market pairs. In our financial network performance measure, the elimination of a transaction link is treated by removing that link from the network while the removal of a node is managed by removing the transaction links entering or exiting that node. In the case that the removal results in no transaction path connecting a source agent/demand market pair, we simply assign the demand for that source agent/demand market pair to an abstract transaction path with an associated cost of infinity.
42 Some Other Relevant Papers for Part II Environmental Impact Assessment of Transportation Networks with Degradable Links in an Era of Climate Change, Nagurney, Qiang, and Nagurney, International Journal of Sustainable Transportation 4: (2010), pp A Relative Total Cost Index for the Evaluation of Transportation Network Robustness in the Presence of Degradable Links and Alternative Travel Behavior, Nagurney and Qiang, International Transactions in Operational Research 16: (2009), pp Modeling of Supply Chain Risk Under Disruptions with Performance Measurement and Robustness Analysis, Qiang, Nagurney, and Dong, invited chapter in: Managing Supply Chain Risk and Vulnerability: Tools and Methods for Supply Chain Decision Makers, T. Wu, and J. Blackhurst, Editors (2009), Springer,