A FEASIBILITY STUDY FOR A STANDARD GAUGE SEPARATE RAILWAY LINE IN ESTONIA, LATVIA AND LITHUANIA. Arnis Kakulis AECOM, Director, Baltic Region
|
|
|
- Anis Carroll
- 5 years ago
- Views:
Transcription

1 A FEASIBILITY STUDY FOR A STANDARD GAUGE SEPARATE RAILWAY LINE IN ESTONIA, LATVIA AND LITHUANIA Arnis Kakulis AECOM, Director, Baltic Region 24 March 2011
2 Objective of the Feasibility Study The main objective of this feasibility study is to identify the most desirable feasible development option for a 1435 mm gauge line in the Rail Baltica corridor evolving from a top-down transport strategy covering all the three Baltic States and an EU-wide rail network rationale, and to give a complete and substantiated picture for the authorities of the 3 Baltic countries and the EU if the project seems viable enough to justify a more detailed analysis on the respective national levels and to propose a possible period for implementation of further studies at the national levels.
3 Sustainable Mobility The overall objective of the Core Network is to enhance the European added value of the Trans-European Transportation Network (TEN-T). This is defined as a benefit that goes beyond those achieved at national level and includes not only economic benefits, but also those derived in the cohesion, environmental and safety and security areas. Principles of the future TEN-T core network: integration, sustainability, territorial cohesion and openness to third countries

4 TEN-T Network Priority Projects


5 Objective of the Feasibility Study
6 Macro Economic Context in the Baltics POPULATION Population in the Baltic region is shrinking GDP Average long term growth in GDP is 2.3% in the Baltic States GVA Growth in GVA is stronger in the urban areas than in the rural areas GOODS N/S freight market is containerised E/W freight market is bulk URBAN RURAL
7 Analysis of the Supply of Transport Services RAIL Int l passenger rail service is poor. Regional rail is infrequent, yet cheap. N/S rail freight service is poor. E/W rail freight service is good. ROAD Road network quality is poor, yet permits reliable journey times. Good regional and int l coach network. AIR Reasonable network of routes for international air movements. Air service is less attractive for shorter distances. SEA E/W freight from ports to inland CIS. N/S freight is regional to Baltic ports. Sea cargo is mainly bulk cargo.


8 Existing Demand PASSENGER Passenger demand is generally low for cross border movements. Road is the preferred mode for shorter distances but changes to air for longer journeys FREIGHT There is a reasonable N/S freight demand which is currently carried by road and sea Global recession has had a negative effect on demand


9 Existing Demand - Freight ROAD RAIL
10 Constraints ECONOMIC Funding Government EU Implementation Costs CAPE OPE REGULATORY Planning Land expropriation Setting of Tarrifs Infrastructure Access Passenger Tariffs Freight Tariffs ENVIRONMENTAL Noise Emissions Protected Territories Sustainability TECHNICAL (TSI) New core TEN-T mixed traffic line: Line Category IV-M Structure Gauge GC (1435 mm) Maximum axle load 25 tonne Minimum maximum line speed 200kph FAST CONVENTIONAL RAIL
11 Three Track Layouts Under Consideration New Dual Track New Dual Track Adjacent to Existing Track Dual Guage/ Dual Track
12 Option Identification
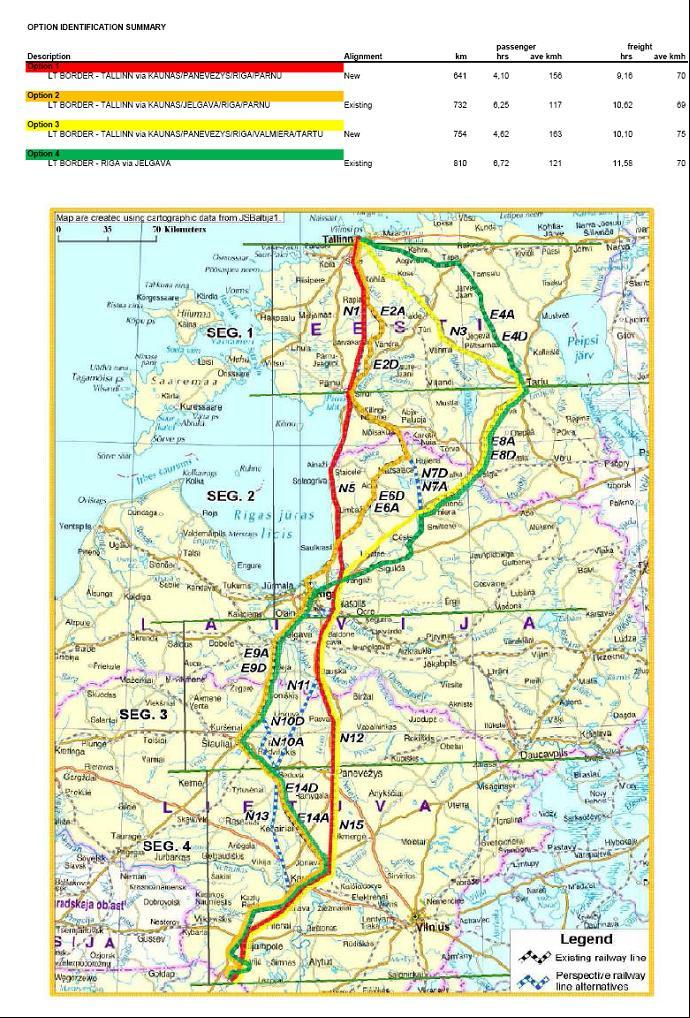
13 Option Identification Initial 20+ variations narrowed down to 4 basic options. OPTION DESCRIPTION ALIGNMENT DISTANCE (km) Option 1 Red Route Option 2 Orange Route Option 3 Yellow Route Option 4 Green Route LT Border Kaunas Panevezys Riga Parnu - Tallinn LT Border Kaunas Siauliai Riga Parnu - Tallinn LT Border Kaunas Panevezys Riga Valmiera Tartu - Tallinn LT Border Kaunas Siauliai Riga Valmiera - Tartu - Tallinn New 728 Existing 815 New 818 Existing 885
14 Options Identification Distance/Passenger Journey Time Comparison Tallinn Tallinn Tallinn Tallinn 140 km.81 hrs 150 km 1.16 hrs 178 km.89 hrs 190 km 1.4 hrs Parnu 200 km 1.08 hrs Riga 160 km.88 hrs Panevezys 105 km.49 hrs Parnu 218 km 1.56 hrs Riga 42 km.35 hrs Jelgava 94 km.65 hrs Tartu 134 km.82 hrs Valmiera 120 km.75 hrs Riga 160 km.88 hrs Panevezys Tartu 134 km.82 hrs Valmiera 124 km 1.04 hrs Riga 42 km.35 hrs Jelgava Kaunas Sauliai 105 km.49 hrs 94 km.65 hrs 148 km.93 hrs Kaunas Sauliai Warsaw Kaunas 148 km.93 hrs Warsaw Kaunas Warsaw Warsaw Red = 728 km P = 4.13 hours (170) F = hours (68) Orange = 815 km P = 6.14 hours (128) F = hours (70) Yellow = 818 km P = 4.81 hours (165) F = hours (71) Green = 885 km P = 6.74 hours (127) F = hours (72)
15 Technical Analysis Results Diverted Trips from Competing Modes For optimum fare rates. For all options there is a significant diversion from coach Diversion from rail is highest for options which follow existing rail routes Diversion from air is highest for fastest options

16 Technical Analysis Model Outcome Option 1 (Red Route) 2040 Trains per day Assumes an inter-modal train with payload of 900t and bulk train with a payload of 3600t Assumes 14t per container 1 train replaces 50 lorries Assumes 18t of bulk per lorry 1 train replaces 200 lorries

17 Technical Analysis Freight Total tonnages over all flows for each of these scenarios are: Red 9.8 million 12.9 million 15.8 million Orange 7.6 million 10.1 million 12.6 million Yellow 8.1 million 10.6 million 13.2 million Green 6.6 million 8.7 million 10.9 million
18 Technical Analysis Initial Option Comparison RED ORANGE YELLOW GREEN Option 1 Option 2 Option 3 Option 4 Comments Destination and Connectivity Primary Cities Secondary Cities Airports Journey Times Passenger Freight Capacity Passenger Freight Capability Compliant with TSI Gauge Transfer Facilities Estonia/Latvia/Lithuania Terminal Facilities Tallinn/Riga/Kaunas Environmental Noise/Emissions Protected Territories FRS Compliancy (initial targets overestimated) Min Operating Costs Min Capital Costs Max Journey Time Savings Max Revenue Generation Max Passenger Trips Max Freight Volumes Min Technical Constraints Min Expropiation Min Spatial Planning Approvals Max International Movements Max inner-country Movements Analysis Indicators Total
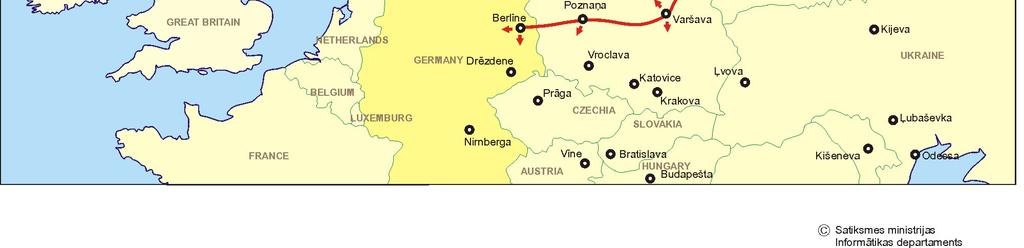
19 Regional Cohesion Tallinn Tallinn Tallinn Tallinn 2 hrs 3.25 hrs Riga 4.5 hrs 1.5 hrs Riga Kaunas 10 hrs 2.5 hrs Riga Kaunas Warsaw 4 hrs Warsaw Riga Kaunas Berlin? EISTING RAIL EISTING ROAD GREEN OPTION EISTING ALIGNMENT RED OPTION NEW ALIGNMENT
20 Business Model Influencers Demand: speed increases passenger and freight demand Capital Costs: length of alignment and speed increases capital cost (conventional v. HSR/VHSR) Land Costs: existing alignments increase land cost (especially in urban areas) Infrastructure Management: single infrastructure manager will be considered single implementation authority will be considered Operations Mixed train service increases operating revenues
21 Cost Benefit Analysis Framework Capital Costs Journey Time Savings Wider Economic Benefits Safety Operating Costs/Revenues Environmental/Social Impacts Technical/Operational Feasibility Financing & Funding Requirements Implementation Impacts
22 Feasibility Study Finalization Red Alignment TASK 5 - Best Feasible Option TASK 6 - Cost-Benefit Analysis Week 0 Week 1 Week 2 Week 3 Week 4 Week 5 Week 6 Week 7 Week 8 Week 9 Week 10 SUBMIT TASK 7 - Conclusions TASK 8 - Interoperability Assessment TASK 9 - Implementation Issues Draft Final Report Preparation RBSC DRAFT to EU RBSC Submission/Presentation RBSC Review Final Report Preparation Internal Review Submission
23 Thank You