January 31, 2018 Asset Management and Performance Measures for Roads and Bridges Maryland Department of Transportation State Highway Administration
|
|
|
- Buddy Fleming
- 5 years ago
- Views:
Transcription


1 January 31, 2018 Asset Management and Performance Measures for Roads and Bridges Maryland Department of Transportation State Highway Administration Amy J. Purves, PE
2 Asset Management and Performance Measures for Roads and Bridges Maryland Department of Transportation Transportation Asset Management Plan (TAMP) Status and Challenges TAMP Requirements and Timeline Draft Preparation and Content Condition Assessment and Performance Measures Investment Scenarios Challenges Next Steps
3 TAMP Required Content Summary of NHS pavement and bridge inventory and condition based on new performance measures Asset management objectives and measures Performance gap identification Life-cycle planning Risk management analysis Financial plan for 10 years Investment strategies Improvement strategies Processes to support these areas to be included in Initial Draft (April 2018) Analyses of these areas to be included in Final (June 2019)
4 MDOT TAMP / TPM Timeline October 2, 2017 Requirements in effect for 23 CFR Part 515 TAMP Workshops with Stakeholders MPO s, MDTA, SHA November 7, 2017 December, 2017 January, 2018 January, 2018 February, 2018 March, 2018 April 30, 2018 May 20, 2018 November 15, 2018 Preliminary Draft to FHWA Div Office; review meeting Local jurisdictions provided NHS projects and funding MDTA work session final funding plan TPM Work Shop with MPO s MDOT Internal Review; Second Draft to FHWA Div Office Review by MPO s Initial Draft Submittal to FHWA Finalize State NHS Performance (PM2) Targets Finalize Regional (MPO) Performance (PM2) Targets
5 NHS Performance Measures Bridge % of NHS bridge deck area in good condition % of NHS bridge deck area in poor condition Pavement % of pavement on Interstate in good condition % of pavement on non-interstate in good condition % of pavement on Interstate in poor condition % of pavement on non-interstate in poor condition Establish targets by May 2018
6 NHS Performance Measures Bridge % of NHS bridge deck area in good condition % of NHS bridge deck area in poor condition Pavement % of pavement on Interstate in good condition % of pavement on non-interstate in good condition % of pavement on Interstate in poor condition % of pavement on non-interstate in poor condition Establish targets by May 2018 Structurally Deficient Remaining Service Life
7 Inventory and Condition NHS BRIDGES OWNER DECK AREA (square meters) GOOD FAIR POOR SHA 2,186, % 66.7% 0.9% MDTA 1,359, % 75.4% 1.7% MAA % 0.0% 0.0% CITY/MUNICIPAL 315, % 74.8% 14.5% COUNTY 15, % 36.0% 0.7% NATIONAL PARK SERVICE 27, % 84.0% 0.0% TOTAL 3,905, % 70.4% 2.3%
8 Non-Interstate Interstate Inventory and Condition NHS PAVEMENT OWNER LANE MILES GOOD FAIR POOR SHA 2, % 40.8% 0.3% MDTA % 37.0% 2.0% CITY/MUNICIPAL % 63.9% 20.4% SUBTOTAL 2, % 40.5% 0.9% SHA 5, % 57.5% 3.2% MDTA % 47.1% 1.4% CITY/MUNICIPAL % 67.2% 32.3% COUNTY % 73.1% 20.2% OTHER LOCAL % 79.9% 20.1% CORPS OF ENGINEERS % 100.0% 0.0% NATIONAL PARK SERVICE % 62.2% 1.6% SUBTOTAL 6, % 58.9% 6.7% TOTAL NHS 9, % 53.4% 5.0%

9 67 Rated Structurally Deficient in 2017


10 Structurally Deficient Bridges Keep the element from becoming SD by performing preservation activities Eliminate SD element with a Major Rehabilitation or a Total Replacement of the structure Paint Program Deck Overlays Invert Paving Substructure Preservation Major Rehabilitation Program Bridge Replacement Program Small Structure Replacement Program
11 Structures Evaluation Tour Consistent evaluation of all candidate structures across state by four person team of senior staff. Opportunity for District to provide input and identify structure concerns within the District. Structures receive a overall tour condition rating and are prioritized with BR/BH programs. Opportunity to review consistency of Inspection Team ratings across the entire state. Opportunity to evaluate what repairs are necessary to hold a structure while in the program for major rehabilitation. Over 300 bridges and small structures were visited during the 2016 Tour.

12 Maryland Network-Level Pavement Life Cycle Analysis
13 TAMP Development Update current draft with 2016 Data/Results Bridge, Pavement Life Cycle Planning Funding Levels Investment Strategy Future Asset Management, Extreme Weather, and Proxy Indicators Pilot Project Refine Risk and Mitigation Improvement Strategies Other Assets (non-nhs, TSMO, ITS, Drainage.)
14 Challenges Complete the Asset Lifecycle Project Tracking District decision making Set Performance Targets Maintain condition versus available funding Regional targets Funding Levels Available Extend to 10 years Local Funding / Investment Strategy Requested project information

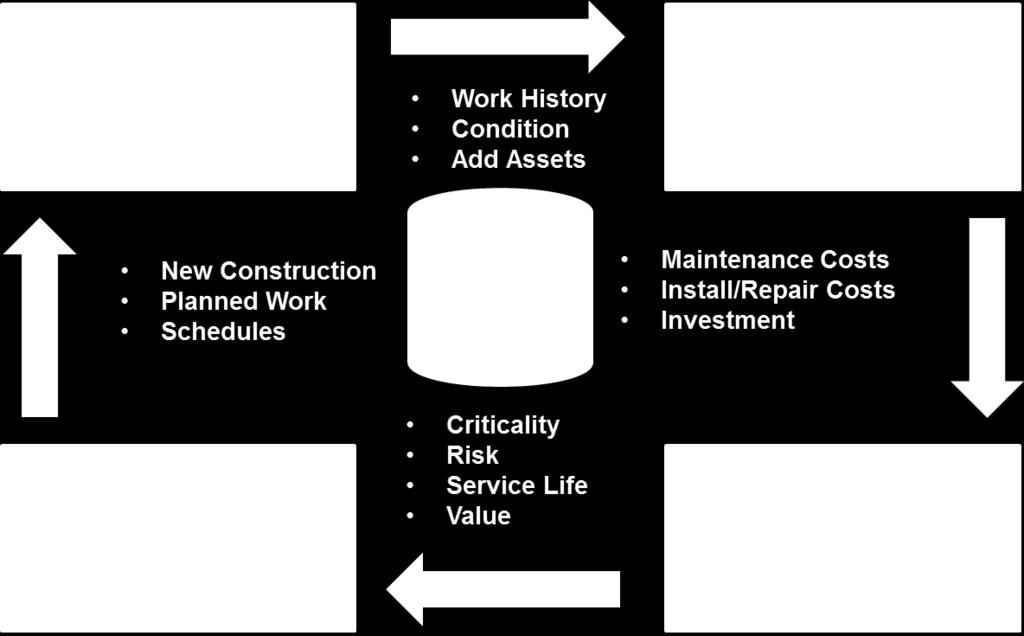
15 Primary Asset Work Flows

16 Support Asset Management Life Cycle
17 Next Steps Set Performance Targets Expand to Local Funding / Scenarios Update Funding Levels Available Extend to 10 years Determine Investment Scenarios Projection of Condition / Investment for Scenarios Stakeholder input / review