The Missouri Public Service Commission
|
|
|
- Myron Marsh
- 5 years ago
- Views:
Transcription


1 National Association of Regulatory Utility Commissioners Energy Regulatory Partnership Program between The National Agency for Energy Regulation of Moldova and The Missouri Public Service Commission May 15, 2013 Kim M. Wissman Director, Department of Energy and Environment Public Utilities Commission of Ohio Executive Director, Ohio Power Siting Board 1
2 Why Regulation? Electricity has historically been considered a natural monopoly Entry into this market required huge investments in infrastructure Electricity was considered a public good Electric Infrastructure is very capital intensive, which creates barriers to entry for potential investors 2
3 FEDERAL vs. STATE JURISDICTION and MARKET STRUCTURES 3
4 ELECTRIC WHOLESALE 4
5 Federal Energy Regulatory Commission Order 888 (1996) and Order 2000 (1999) Determined the public interest would be best served by a competitive wholesale market FERC asserts jurisdiction over transmission (pricing) Code of Conduct Same Time Information System Provided for non-discriminatory and open-access on the transmission system/open Access Transmission Tariff Required transmission owners to join an Independent System Operator ISO: An independent, Federally regulated entity established to coordinate regional transmission in a non-discriminatory manner and ensure the safety and reliability of the electric system. 5
6 FERC Oversight - Wholesale No direct jurisdiction over generation PJM administered capacity market PJM administered energy market Administrative Market Construct Sales for Resale Bulk Power System Transmission Tariffs Market Monitoring Reliability Assurance (North American Electric Reliability Council and Standards) 6
7 Regional Transmission Organization (RTO) is: Independent from market participants Responsible for grid operations and reliability Responsible for transmission service within region 7
8 RTO Functions Grid Operation Non-discriminatory treatment Monitoring transmission system Reliability of the system Generation and load balance responsibilities Market Operation Capacity Energy Ancillary Services Regional Transmission Planning and Expansion Reliability requirements Operational Economic 8

9 Nine Major North American RTOs / ISOs 9

10 PJM Regional Transmission Organization 10
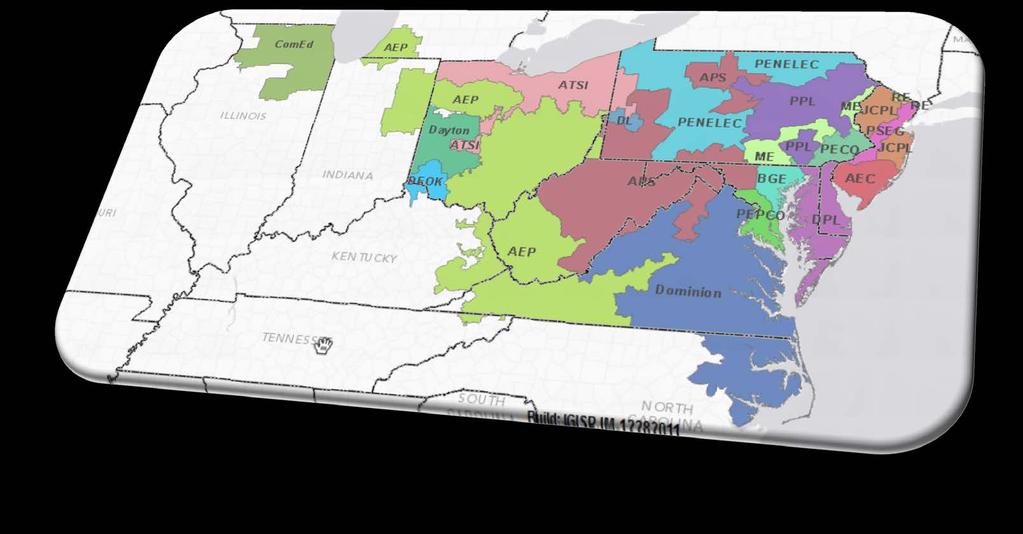

11 11 Transmission Owner Zones
12 Dos and Don ts Regional Transmission Organization Operation of the assets Maintenance scheduling and coordination Match load and generation Non-profit Local Utility Owns assets Performs maintenance Directly serves end use customers Publicly traded company 12
13 Regional Transmission Organization Pricing and Planning 13
14 Capacity vs. Energy Capacity A resource commitment to provide energy Capacity revenues paid to committed resource whether or not energy is produced by resource Participation in Reliability Pricing Model Auction Daily product Energy Generation of electrical power over a period of time Energy revenues paid to resource based delivery Participation in Day-Ahead & Real-Time Energy Markets Hourly product 14
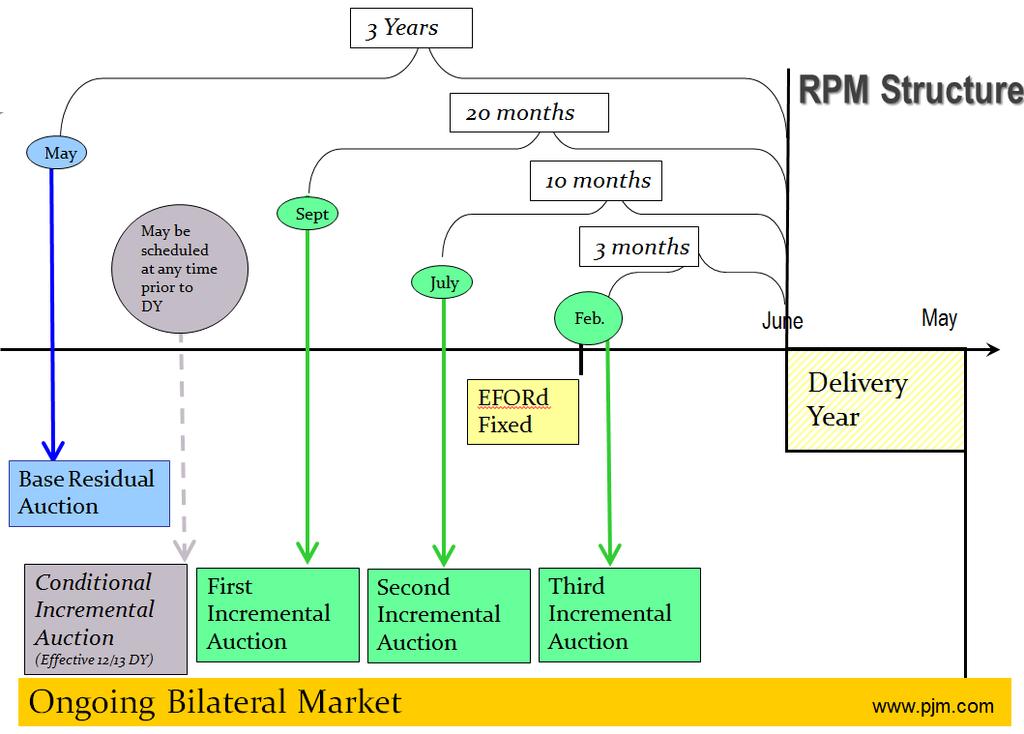
15 Wholesale Capacity Markets Reliability Pricing Model (RPM) Bid Based Auction Process Annual Product Three years in advance resource commitment to meet future peak load Capacity Bids Generation Demand Response Energy Efficiency Transparency of information Places value on capacity resources 15
16 16

17 RPM Auctions 17
18 Resource Adequacy Requirement Determines the amount of capacity resources required to serve the forecast peak load taking into consideration the reliability criterion The reliability criterion is based on Loss of Load Expectation (LOLE) not exceeding one event in ten years An Installed Reserve Margin (IRM) satisfies the reliability criterion, adjusted annually, currently 15.2% Resource Adequacy Requirement = Forecast Peak Load * (1+ IRM) 18
19 PJM determines pricing sub-regions (i.e., locational deliverability areas) to be included in RPM Auctions to recognize and quantify the locational value of capacity These would be considered constrained areas due to import capability limitations 19
20 The Variable Resource Requirement (VRR) Curve is a downward sloping demand curve that relates the maximum price for a given level of capacity resource commitment relative to reliability requirements If resources are less than the reliability requirement, the price is higher and lower when the resources are in excess VRR Curves are determined for the PJM RTO and for each constrained Locational Deliverability Area (LDA) within the PJM region 20
21 Illustrative Example of a VRR Curve Price = UCAP Price ($/MW-day) 1.5 Net Cone Net Cone 0.2 Net Cone (a) Effective 12/13 DY: Target Level = Reliability Requirement Short Term Resource Procurement Target (b) (c) Quantity = UCAP MW A VRR Curve is defined for the PJM Region. (IRM 3%) (IRM + 1%) (IRM + 5%) IRM Individual VRR Curves are defined for each Constrained LDA. 21
22 Clearing 2012/2013 Base Residual Auction Clearing determined by the intersection of the supply and the demand curves. 22

23 $200 Rest of RTO Capacity Prices in $/MW-Day $180 $160 $140 $120 $100 $80 $60 $40 $20 $ Rest of RTO Price 23
24 PJM Energy Markets Day Ahead Hour Ahead Bid Based Security Constrained Dispatch of all Generating Plants in Footprint 24
25 Security Constrained Economic Dispatch Ensure sufficient generation is available to satisfy the demand at any hour of the day Monitor, operate and control the high voltage transmission system in a reliable manner 25
26 PJM Dispatch Curve by Fuel Type: 10/06/11
27 Locational Marginal Pricing Cost of serving the next MW of load at a given location Lowest production cost of generation available Recognizes physical transmission limitations Physical flow, not contract path Generation Marginal Cost + Transmission Congestion Cost + Cost of Marginal Losses = LMP 27
28 Energy Price System-wide price Optimal dispatch (no congestion or losses taken into account) Intersection of the Supply and Demand Curve Day ahead and real time calculations 28
29 Transmission Congestion Price Price of congestion/constraints taken into account, calculated using cost of marginal units on a bus by bus basis No constraints = no cost assigned to congestion Day ahead and real time calculations 29
30 Transmission Losses Price of marginal losses reflected Location by location basis, calculated using penalty factors Distance Voltage Thermal rating Day-ahead and real-time calculations 30

31 PJM Energy Market LMP 7/18/2012, 2:40 PM 31

32 PJM Energy Market LMP 7/18/2012, 3:05 PM 32

33 PJM Energy Market LMP 7/18/2012, 3:10 PM 33
34 PJM Energy Market LMP 7/18/2012, 3:15 PM 34

35 PJM Energy Market LMP 7/18/2012, 4:00 PM 35

36 Western PJM 4 PM Weather 36

37 Storm Tracks 37

38 Next Day Recap - Genscape 38
39 Financial Transmission Rights Financial Transmission Rights Auctions held Financial instruments Awarded to winning bidders Entitles winner to revenues based on the hourly Day Ahead congestion price differences across a path Hedging mechanism to protect against price uncertainty Can be traded separately from the transmission service Independent of energy delivery 39
40 Auction Revenue Rights Entitlements to Firm Transmission Service Customers to receive an allocation of the revenues from the Annual FTR Auction ARRs provide a revenue stream to the firm transmission customer to offset purchase price of FTRs ARRs are allocated annually 40
41 Two Settlement Markets Forward markets for electric energy in PJM Day-ahead Market Financial market using Bid-In Load Prices calculated hourly Settlements made hourly Includes virtual bids and price sensitive demand Real-time Market Physical Market based on actual system conditions Prices calculated every 5 minutes Hourly settlements based on deviations from Day-Ahead position 41


42 Day-Ahead Market Timeline Up to 12:00 noon PJM receives bids and offers for energy next Operating Day 12:00 noon 12:00-4:00 pm Day-ahead market is closed for evaluation by PJM 4:00 pm 4:00-6:00 pm Re-bidding period 6:00 pm 4:00 pm PJM posts day-ahead LMPs & hourly schedules Throughout Operating Day PJM continually re-evaluates and sends out individual generation schedule updates, as required midnight 42
43 Ancillary Services Regulation Market Synchronized Reserve Market Black Start Service Reactive Services Scheduling, System Control & Dispatch 43
44 Regulation Market Scheduling, System Control & Dispatch Provide balance of generation and load Generation and Demand Response resources Transmission customer must provide or purchase RMCP = Regulation Market Clearing Price Regulation Price = Higher of RMCP or offer price plus opportunity cost Provide transmission service and operate energy markets Control Area Administrative Service FTR Administrative Service Market Support Service Regulation Administrative Service Capacity Resource and Obligation Service 44
45 Blackstart Service Provide balance of generation and load Transmission Owners and PJM identify critical Blackstart units Generator annual revenue requirements - Cost-based service Charges go to Transmission Customers Annual Blackstart testing requirements Reactive Supply & Voltage Control Maintain transmission voltages within acceptable limits FERC approves reactive revenue requirements PJM calculates zonal rate Paid by transmission customers Credits go to generation resources and transmission owners 45
46 Synchronized Reserves Market Bring generation and load back in balance with a loss of generation Load Serving Entities have obligation to purchase based on Load Ratio Share Bilateral Schedule own resources Purchase from Synchronized Reserve Market Co-optimized with Regulation Market Allows for participation by Demand Side Response resources 46
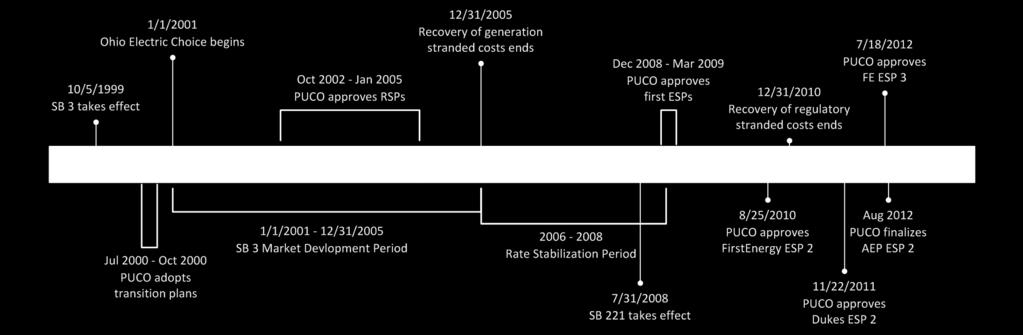
47 GAS WHOLESALE 47
48 History of Natural Gas Restructuring Turn of the (20 th ) Century System Vertically integrated industry more localized Local production wells Short distance gathering/distribution lines End-user consumption in areas appurtenant to production Late 1930s-1960s Natural Gas Act of 1938 established Federal Power Act authority over interstate natural gas sales by U.S. Congress, including wellhead prices Some natural gas assets split into interstate transmission (FERC) and intrastate (PUCO) Additional interstate (long-line) transmission built from Mid-continent and Gulf Coast to Midwest & Northeast Local distribution companies and interstate pipelines utilized bundled rates 48
49 History of Natural Gas Restructuring 1950s-1960s Significant demand growth fueled by access to new interstate pipelines and postwar economic growth 1970s Regulated wholesale pricing caused new production (supplies) to dwindle Late 1970s early 1980s U.S. Congress: Natural Gas Policy Act of 1978 partial price decontrols at wellhead 49
50 History of Natural Gas Restructuring 1980s Significant evolution away from regulated wellhead pricing Introduced competitive forces in interstate pipeline rates by unbundling those rates (commodity, capacity, and storage services were separated out) FERC Orders 436 & 500 implemented open access (shippers could purchase gas commodity from someone other than the pipeline) FERC Order 636 removed pipelines from merchant function (no longer could sell natural gas commodity) 1990s FERC strengthened codes of conduct for pipelines and their affiliates 50
51 51
52 ELECTRIC RETAIL 52
53 State Jurisdiction - Retail Local Distribution monopoly Cost of service rate making for Distribution services Market tests Standard Service Offer Retail Auction Oversight Competitive Retail Service Supplier Certification Retail Market Monitoring We also do: Wholesale market monitoring Generation Siting Transmission Siting 53
54 History of Electric Restructuring in Ohio Senate Bill 3 A 1999 law effective January 2001 restructured Ohio s electric industry allowed customers to shop for electricity provided a five-year market development period Turn of the Century System Unbundling of vertically integrated system Customers served by generator of choice Transmission and distribution remain regulated For generation, the rate of return system of regulation replaced by competition 54
55 State of Ohio Reforms Unbundling of Rates Transmission (monopoly, FERC jurisdiction) Distribution (monopoly, PUCO jurisdiction) Generation (deregulated, market based) Customer Choice Competitive Retail Electric Services Aggregation of Customers Supplier Tariffs 55
56 Dos and Don ts Regional Transmission Organization Operation of the assets Maintenance scheduling and coordination Match load and generation Non-profit Local Utility Owns assets Performs maintenance Directly serves end use customers Publicly traded company 56
57 Issues Under Restructuring Unbundling Market Power Transitional Issues Independent System Operation Social Issues Environmental Issues Taxes 57


58 Unbundling Generation ( or supply ) Shop for this Transmission Remains regulated by FERC Distribution Remains regulated by PUCO and provided by your local utility 58
59 Bundled Rates Rates were previously a bundle of costs for different services. Generation Transmission Distribution Ancillary Services Specific Surcharges Total Rates Specific Surcharges Ancillary Services Generation Transmission Distribution 59
60 Unbundled Rates Total Rates Generation Specific Surcharges Ancillary Services Transmission Distribution Electric Restructuring would unbundle the rates so the generation component could be shopped for, and priced at market. The bill anticipated that market rates would be lower than regulated rates. 60
61 Transitional Issues Temporary issues pertaining only to the period of transition from a regulated to a competitive industry. Timing How soon full competition can begin Stranded Costs Production Regulatory 61
62 Social Issues Universal Service Provider of Last Resort Low Income Programs Consumer Education Metering & Billing Unfair & Deceptive Practices 62
63 Focus Regulatory Shift to Market Monitoring & Development The ability to control prices and product quality Vertical A vertically integrated company favors its own or an affiliates generation over alternatives through non-price barriers. A single supplier or group of suppliers has a strategic advantage in terms of access to customers relative to other suppliers. Horizontal A single supplier or group of suppliers has undue influence on the price of the product due to concentration of market share that can be used strategically. 63
64 Market Development Period What did it look like? 5 year market development period during which time rates are frozen Local utility delivers electricity and maintains infrastructure Utility is default supplier What happened then? Early results early showed significant switching in some high cost service territories while the moderate-to-low priced utilities experienced limited customer switching Governmental aggregation was a success story A fully competitive market had not developed as quickly as envisioned by lawmakers 64
65 PLUS... Many other things happened during the 5-year Market Development Period The California crisis and Enron scandals Extreme volatility and upward movement of market prices (due to rising gas prices, rising coal prices, and construction facilities not matching the projected increases in demand) And the slower than expected development of Independent System Operators for the transmission systems 65
66 Rate Stabilization Plans As the end of the market development period neared, there were a limited number of competitive electric suppliers and low degree of market activity. Therefore, there was concern that an immediate shift to market-based rates in 2006 would not be in the best interest of customers To avoid rate sticker shock and gradually transition customers to market-based rates, the PUCO worked with Ohio s electric utilities and stakeholders to develop Rate Stabilization Plans (RSPs). Most Rate Stabilization Plans lasted through
67 Energy, Jobs and Progress Plan Middle-ground Approach to Electricity Regulation Evidence demonstrated few competitive options existed at the retail level Did not close the door on market pricing, but required a demonstration that competition is effective Action was necessary to secure Ohio s energy future PUCO can set rates and allow utilities to recoup the cost for new generation and modernization of the electric system The plan was a comprehensive, long-term approach to the challenges of supplying reliable and affordable power It also had to address the approaching expiration of the Rate Stabilization Plans Attract energy jobs of the future through an Ohio advanced energy portfolio standard Ensure affordable and stable energy prices to protect Ohio consumers and existing Ohio jobs 67

68 Electric Restructuring Timeline 68
69 Retail Markets Two Offerings: o Standard Service Offer (SSO) is the default option o Competitive Retail Electric Supplier (CRES) competitive alternative to standard service Both retail constructs are derived from the wholesale market 69
70 Standard Service Offer (SSO) o o Default service for non-shopping customers Price based upon the results of competitive procurement auctions Competitive Retail Electric Supplier (CRES) o Independent marketers certified by Commission o Compete to attract customers from SSO o Flat-price offers for mass-market customers o Specific offers to larger commercial and industrial customers based on their unique energy needs (load profile) and cost of service o May own generation (or be affiliate) o May source energy from wholesale market 70
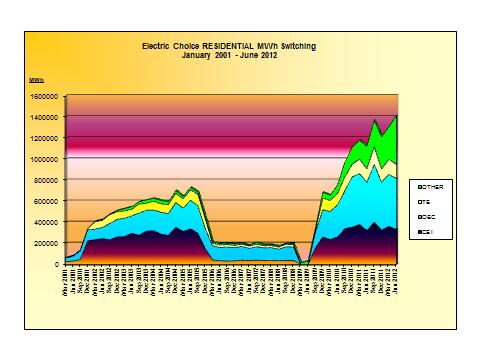
71 Standard Service Offer (SSO) Auctions o Suppliers compete for right to serve default load o Master Supply Agreement governs bidder requirements and product definition o Independent auction administrator o Bidders may own generation or obtain energy and capacity through wholesale market SSO Load is divided into identical units called tranches o Each tranche represents one percent (1%) of the actual hourly energy required for SSO load for the applicable delivery period as well as one percent (1%) of the PJM capacity requirement o No bidder may win more tranches than the load cap o The PUCO has ordered a load cap of 80% 71

72 Example of a Declining Clock Auction

73 Multiple solicitations of various durations are blended together to mitigate wholesale price volatility 73
74 Standard Service Offer (SSO) Auctions If there are more tranches bid than the number of tranches needed at the current round price, the price for a product ticks down for the next round After each round a bidder may be able to: o Withdraw some tranches o Switch bids between products o Both withdraw and switch Auction ends when number of bids = tranche target o Sealed Bid Round for final true-up 74
75 Standard Service Offer (SSO) Auctions Full Requirements Service o Suppliers bid to provide energy, capacity, transmission service, ancillary transmission service Retail rates will be developed directly from the final prices Reconciliation mechanism ensures the distribution utility neither makes nor loses money related to the provision of SSO Generation Service 75
76 Where We are Today Wholesale Markets o Regional Transmission Operators o Capacity and Energy Auctions Retail Markets o Corporate Separation o Competitive Retail Suppliers o Default Service Auctions 76

77 Things that haven t changed: Same safe, reliable service Local utility still delivers the electricity Local utility still maintains the poles and wires Still call your local utility in case of a power outage Still get service even if choose not to change Low income programs continue 77
78 78 Electric CHOICE Switching Rate Report
79 79
80 Governmental Aggregation: the power of group buying Ohio Electric Choice allowed for local governments to join all of the customers in a community into a single buying group. Most cases opt-out is used Community passes a ballot issue Everyone in community automatically enrolled and a supplier is chosen for the group Everyone given a chance to opt-out or say you don t want to participate 80
81 GAS RETAIL 81
82 History of Natural Gas Restructuring in Ohio Turn of the (20 th ) Century System Vertically integrated industry more localized Local production wells Short distance gathering/distribution lines End-user consumption in areas appurtenant to production 1970s Regulated wholesale pricing caused new production (supplies) to dwindle Winters and saw significant sustained cold weather in Midwest & Great Lakes Natural gas curtailments due to lack of supplies Schools & businesses closed for days to weeks 82
83 History of Natural Gas Restructuring in Ohio Late 1970s early 1980s Ohio s Self-Help program LDCs in the state interconnected delivering Ohio production across their systems Kept gas off interstate systems; therefore not subject to FERC authority General Motors (GM) owned production in eastern part of Ohio sought ability to transport gas across multiple LDCs for delivery to their production facilities in northern and western Ohio 1980s Docket No GA-COI implemented LDC open access for very large volume customers (major industrial customers) By late 1980s, PUCO kept revising downward the volume threshold to be able to transport gas (allowed mid-sized commercial & industrials to utilize) 83
84 History of Natural Gas Restructuring in Ohio 1990s Ohio LDCs began allowing residential customers to select their own suppliers of commodity LDC continued to deliver the gas Marketers provided the commodity Began with pilot programs in certain areas before full implementation 84
85 Natural Gas Legislation In 1996, the Natural Gas Alternative Regulation Law, House Bill (HB) 476 was passed. It established customer choice as a State policy goal. The natural gas industry was unbundled or deregulated in 2001 as a result of amended substitute House Bill (HB)9. Unbundling is the process of separating the charges for natural gas delivery and the actual gas itself, allowing consumers to order their gas from another supplier. 85
86 Natural Gas Legislation The major provisions of House Bill (HB) 9 required that: retail gas suppliers to be certified by PUCO authorizes governmental aggregation for competitive retail gas service authorizes the PUCO to order open access for large LDCs consolidates consumer protection authority over certain retail natural gas transactions 86
87 Natural Gas A pilot program was begun in 1997 that allowed consumers to choose an alternate supplier for their natural gas. All four LDC s had CHOICE programs by As Energy Choice programs grew, parties recognized that the GCR mechanism did not send proper price signals. In 2006, in Case No GA-EXM the PUCO approved a company s application to began Phase I of the Exit of the Merchant Function. 87
.")
88 Natural Gas 88 This Phase I replaced the Gas Cost Recovery (GCR) rate with a market based rate, called the Standard Service Offer (SSO). An auction awards the winning suppliers the right to supply the distribution company s SSO natural gas supply. The winning rate is called the Retail Price adjustment (RPA). The PUCO approves that auction rate. The SSO Rate is based on NYMEX month-end settlement price plus the RPA auction result. SSO rate varies monthly, same as the GCR rate
89 Commodity Market Transformation In an SSO auction, wholesale supply volume, not actual customers, is bid out Market to be supplied is divided into slices (tranches) Maximum share per supplier is for one-third of total available Bidders are pre-approved for creditworthiness Standard Choice Offer (SCO) auction in which the retail supply obligation for Choice-eligible customers is bid out Promotes a direct retail relationship between customer and supplier Same general process as SSO, i.e., market divided into tranches, one-third share maximum, credit pre-approval, etc. Bidders must be certified to provide Energy Choice service Supplier name and contact info appears on the bill 89
 will help discipline prices. 90")
90 Amos Energy is the LDC next to Atlanta Gas Light A highly competitive Provider of Last Resort (or SSO), as opposed to allowing customers to be assigned out to marketers (as happened in Atlanta Gas Light) will help discipline prices. 90
91 Ohio Today Large Ohio LDCs transitioning to exit the merchant function altogether Supplier of last resort function is bid out to alternative suppliers through a descending clock auction process (lowest qualified bidder) Guarantees against defaults by all suppliers 91

92 92 Natural Gas CHOICE Switch Rates
93 THANK YOU! 93