08 th July 2010 New Delhi. State of the Indian Automotive Industry Quarterly Review : Q1 F11. SIAM Society of Indian Automobile Manufacturers
|
|
|
- Pamela Cox
- 5 years ago
- Views:
Transcription


1 08 th July 2010 New Delhi State of the Indian Automotive Industry Quarterly Review : Q1 F11 SIAM Society of Indian Automobile Manufacturers
2 Domestic Market Q1 F 11 Segmental Performance & Growth Analysis and Driving Factors Global Comparison Exports Performance F11 Outlook Challenges and Concerns
3 Domestic Market Q1 F 11 Segmental Performance & Growth Analysis and Driving Factors Global Comparison Exports Performance F11 Outlook Challenges and Concerns
4 34% 35% 29% Healthy growth in Passenger Vehicles (PVs) PVs=Cars+UVs+MPVs 49% 33% 24%

5 34% 35% 29% Healthy growth in Passenger Vehicles (PVs) PVs=Cars+UVs+MPVs 49% 33% 24% 33% growth in Q1 F11 over Q1 F10 4% growth in Q1 F10 over Q1 F09 Higher growth in June 2W= Scooters+ M Cycles + Mopeds 22% 29% 32% 28%
6 34% 35% 29% Healthy growth in Passenger Vehicles (PVs) PVs=Cars+UVs+MPVs 49% 33% 24% 33% growth in Q1 F11 over Q1 F10 4% growth in Q1 F10 over Q1 F09 Higher growth in June 2W= Scooters+ M Cycles + Mopeds 22% 29% 32% 28% growth in Q1 F11 over Q1 F10 14% growth in Q1 F10 over Q1 F09 28%
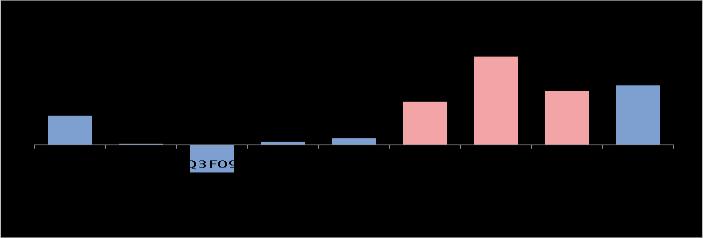
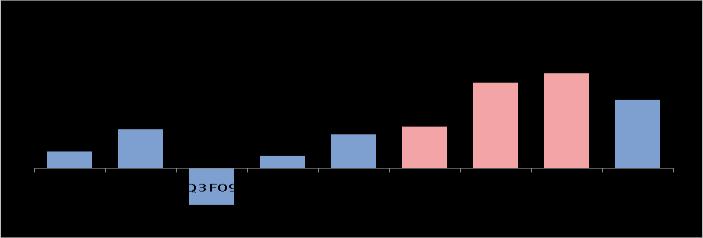
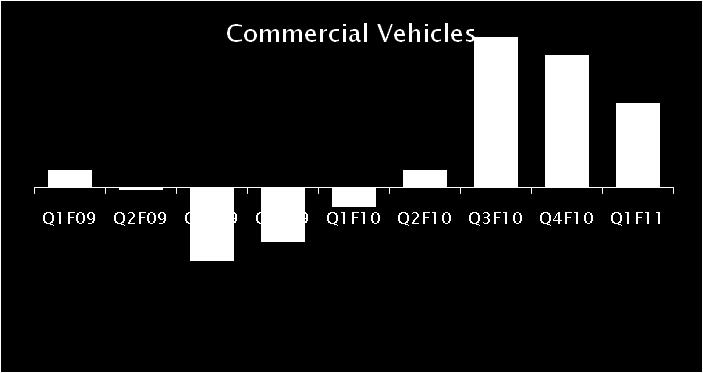
7 CV on the recovery path 64% 58% 44% CVs=MHCVs+LCVs 55%
8 CV on the recovery path 64% 58% 44% CVs=MHCVs+LCVs 55% 55% growth in Q1 F11 over Q1 F10 13% degrowth in Q1 F10 over Q1 F09 Improving trend (3Ws) 20% 10% 15% 15%
9 CV on the recovery path 64% 58% 44% CVs=MHCVs+LCVs 55% 55% growth in Q1 F11 over Q1 F10 13% degrowth in Q1 F10 over Q1 F09 Improving trend (3Ws) 15% growth in Q1 F11 over Q1 F10 7% growth in Q1 F10 over Q1 F09 20% 10% 15% 15%
10 42% 38% 28% 103% 88% 66% 36% 83% 36% growth in Q1 F11 over Q1 F10 15% growth in Q1 F10 over Q1 F09 83% growth in Q1 F11 over Q1 F10 37% degrowth in Q1 F10 over Q1 F09
11 Domestic Market Q1 F 11 Segmental Performance & Growth Analysis and Driving Factors Global Comparison Exports Performance F11 Outlook Challenges and Concerns


12 $145 bn by F-16 $34 bn In F-07 Vision 2016 By 2016, India will emerge as the destination of choice in Asia for the design & manufacture of automobiles and automotive components. The output of the India s automotive sector will be 115 billion by 2016, contributing to 10% of India s Gross Domestic Product and providing employment to 25 million persons additionally. Source : SIAM & AMP

13 AMP Trend line Despite perceived good growth Demand significantly below AMP indicative requirement

14
15 Fiscal Stimulus Packages Continues Excise Reductions Infrastructure spending Thrust on rural employment Stable Auto Finance Rates Consumer Confidence Commodity price rise impact not passed New Launches


16 Nissan Micra Mercedes E Class Coupe Suzuki Wagon-R Refresh Hyundai i20 Era, Sports Hyundai Verna Refresh Tata Winger Luxury Tata Indigo CS Variant Toyota innova Special Edition Honda Unicorn Dazzler Yamaha FZ S Suzuki GSX-R 1000 Royal Enfield Electra And slew of new launches coming up
17 Domestic Market Q1 F 11 Segmental Performance & Growth Analysis and Driving Factors Global Comparison Exports Performance F11 Outlook Challenges and Concerns
18 Country Cars YOY (% Var.) China 39.2% India 31.6% Japan 24.5% UK 22.0% US 16.6% Brazil 13.1% Italy 7.9% France 7.2% Russia -5.0% Germany -27.7% Country CVs YOY (% Var.) India 76.5% China 60.2% Brazil 50.1% Russia 37.0% US 17.7% Italy 11.6% Japan 11.0% UK 8.8% France 5.9% Germany 4.0%
19 Domestic Market Q1 F 11 Segmental Performance & Growth Analysis and Driving Factors Global Comparison Exports Performance F11 Outlook Challenges and Concerns
20 11% 103% 150% 68% 20% 9% 64% 14% Exports as a % of Domestic Sales

21
22 Domestic Market Q1 F 11 Segmental Performance & Growth Analysis and Driving Factors Global Comparison Exports Performance F11 Outlook Challenges and Concerns
23 SIAM Demand Forecasts for Indian Automobile Industry
24 A formal and continuous forecasting exercise, across domestic automobile segments Objective to develop statistically rigorous forecasting methods Economic Research Group (ERG) of SIAM commissioned to develop the forecasting model for domestic Auto Industry Annual forecasts prepared for
25 Statistical methods used for forecasting, considering all the relevant demand drivers for each segment Models prepared after considering an exhaustive list of relevant variables Macro-economic variables: eg. GDP components, industrial production, inflation, interest rates, stock indices Sector variables: eg. Model launches, vehicle price, intersegment competition Enablers/barriers: eg. Finance availability, road connectivity
26 Automobikle Segments growth over (%) Passenger Cars Utility Vehicles Commercial Vehicles (goods) Commercial Vehicles (buses) 4-5 Two Wheelers 9-10 Three Wheelers (goods) 5-6 Three Wheelers (passenger) 8-9
27 Segment FY 10 FY 11 (P) Growth (%) Total Cars 1,526,259 1,714, Total Utility Vehicles & MPVs 422, , Total Passenger Vehicles 1,949,248 2,196, Factors considered: Income demographics Per capita income, Household incomes Cost of ownership Vehicle prices, Fuel prices, Finance penetration, EMI Consumer confidence Sensex, Risk premium Enablers and Barriers Finance, Model launches, Road connectivity
28 Segment FY 10 FY 11 (P) Growth (%) LCV Goods 251, , MHCV Goods 201, , Total Goods 453, , Passenger (Buses) 77,502 81, Total Commercial Vehicles 531, , Factors considered: Macro-economic GDP, Inflation, Interest rates, Industrial Production Transport related Freight rates, Railway Freight rate Costs EMI, Fuel Costs Enablers and Barriers Product innovation, Road connectivity, Regulations
29 Segment FY 10 FY 11 (P) Growth (%) Motorcycles 7,341,139 8,038, Scooters 1,462,507 1,657, Mopeds 564, , Total Two Whelers 9,368,230 10,287, Factors considered: Commuting need Employment, Education Income demographics Per capita income, Household income Cost of ownership Vehicle prices, Fuel prices, Finance penetration, EMI Enablers and Barriers Model launches, Risk premium, Road connectivity
30 Segment FY 10 FY 11 (P) Growth (%) 3W Goods 90, W Passenger 349, W Total 440, Factors considered: Consumption drivers Consumption expenditure, disposable incomes Mobility drivers Urbanisation, Employment Enablers & barriers Rural roads, Finance, Regulations (permits) Substitution - Buses, small commercial vehicles
31 Domestic Market Q1 F 11 Segmental Performance & Growth Analysis and Driving Factors Global Comparison Exports Performance F11 Outlook Challenges and Concerns
32 6 Month Variation Commodity Unit Nov-09 May-10 % incr Natural Rubber Rs/kg % Pig iron Rs/ton 22,800 28,400 25% HR steel Rs/ton 31,000 37,750 22% CR steel Rs/ton 36,000 41,500 15% EPDM Rs/kg % Polypropylene Rs/kg % Carbon Black Rs/kg % Forging steel Rs/ton 38,500 42,500 10% Aluminium USD/ton 1,981 2,070 4% Copper USD/ton 6,697 6,873 3%
33 Commodity prices on the rise, now stabilising Capacity constraints at suppliers Interest rates stable but concerns of rising Export markets concern in Europe New emission norms pan country roll out Stimulus package partial roll back Low base effect wearing off


34 SIAM Society of Indian Automobile Manufacturers