Gene Seroka APL President, Americas. January 24, 2013 Tampa, Florida
|
|
|
- Lydia O’Connor’
- 5 years ago
- Views:
Transcription

1 Gene Seroka APL President, Americas January 24, 2013 Tampa, Florida
2 Contents Economic Trends Market Dynamics Building a Sustainable Organization Integrated Partnerships 1
3 2 Economic Trends


4 Global Demand for Key Markets & Trades TRANSATLANTIC 2011 Size: 6.1 m TEU 2012 Growth Rate: 2.8% HH -3.1% BH ASIA - EUROPE 2011 Size: 23.2 m TEU 2012 Growth Rate: -2.0% HH 1.0% BH TRANSPACIFIC 2011 Size: 20.8 m TEU 2012 Growth Rate: 3.0% HH 3.1% BH AFRICA IMPORTS 2011 Size: 5.6 m TEU 2012 Growth Rate: 10.8% INTRA-ASIA 2011 Size: 45.5 m TEU 2012 Growth Rate: LH 10.8% HH 9.7% BH SS 6.9% LTAM 2011 Size: 13.4 m TEU 2012 Growth Rate: NS/EW 8.5% HH 9.3% BH Intra LTAM 9.2% Notes World trade is forecasted to be MTEU by Remaining volume unaccounted in the map primarily include Africa exports and Central Asia total trade Source: Seabury, GPS, Drewry
5 Containerized trade has continued to grow in 2012 but at a more moderate pace Global GDP and Container Demand Growth 20.0% 15.0% 10.0% 5.0% 0.0% -5.0% -10.0% 11.2% 4.8% 3.8% 2.3% 11.1% 2.9% 13.4% 3.6% 13.9% 4.9% 10.9% 4.6% 10.2% 5.3% 11.0% 5.4% 2.8% 4.0% -0.7% -9.9% 14.0% 5.2% 7.3% 3.8% 7.7% 3.2% 7.8% 3.9% -15.0% F 2013F Global GDP Container Demand Growth Note: EIU data forecasts used for 2012 and 2013 Source: Drewry, Seabury, Clarksons, IMF WEO Sep2011/Jan 2012, EIU Global Forecasting 4
6 Oversupply will extend into 2013 due to orders of >8,000 TEU vessels during 2010 and 2011 Demand and Supply Growth Rate Forecast F 2013F Demand Growth Supply Growth Source: Alphaliner, Drewry, Clarksons, Seabury, MDS 5
7 Cumulative Operating Earnings by Carrier: Jan-Sep 2012 Source: Alphaliner 6
8 Lack of recent newbuild orders will result in diminishing deliveries from 2H 2013 Thousand TEU 550 Delivery peaked in 2Q % % % % % Q 12 2Q 12 3Q 12 4Q 12 1Q 13 2Q 13 3Q 13 4Q 13 1Q 14 2Q 14 3Q 14 4Q 14 1Q 15 2Q 15 3Q 15 4Q % Scheduled Newbuild % of Global Fleet Source: MDS March2012 7
9 Vessel Delivery by Carrier Source: Alphaliner 8

10 Challenging container shipping environment is forcing liners to manage capacity Source: Alphaliner 9
11 10 Market Dynamics
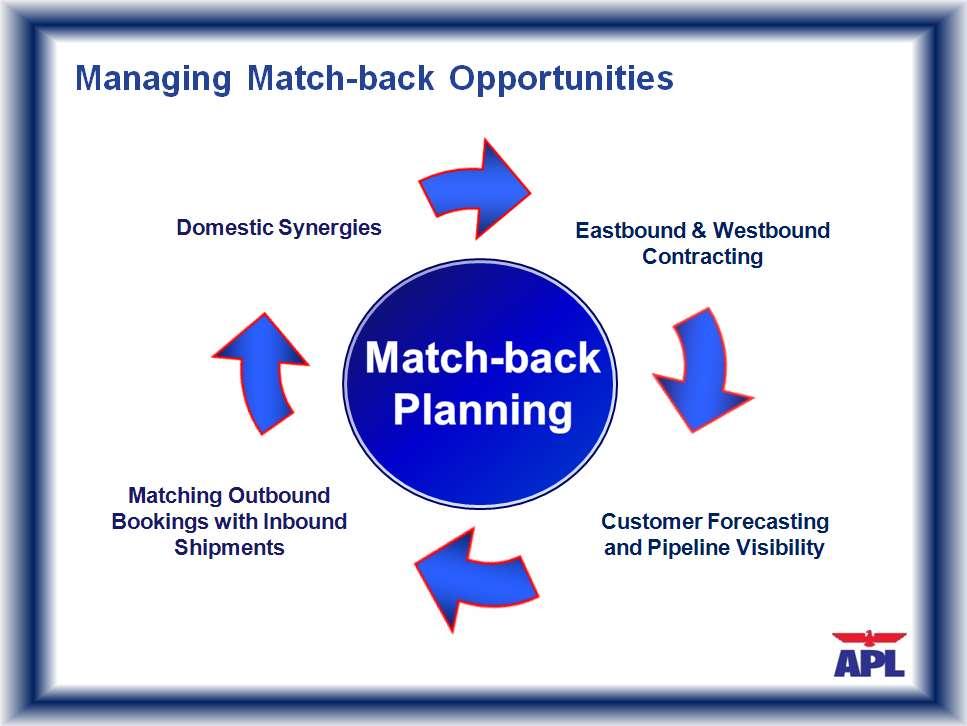
12 Market Dynamics Significant industry losses have forced carriers to drastically reduce costs The formation of super consortia is enabling carriers to operate bigger ships at reduced slot costs MSC and CMA G6 Evergreen, CHKY, China Shipping, Zim Ambitious cost savings goals have been announced USD500 million USD400 million USD350 million USD300 million Carriers are more conscious of equipment matchback opportunities in order to reduce repositioning costs 11

13 Trade flows to/from Asia have shifted significantly. Shifting pattern in Asia is producing a significant increase in equipment repositioning as inbound flows are growing in countries other than China where the outbound demand is highest. Top EB countries are not growing their WB volumes as fast as other Asian countries, creating increasing mismatch of in/ out volumes in Asia North China South China Japan Vietnam UAE Malaysia US Exports growing to SEA, M East which need longer transit Repositioning Boxes need to be repositioned to major exporting regions e.g. North China This relatively recent shift in flow creates longer equipment turn, drives up repositioning cost to get the boxes to China where they are needed to support outbound demand, and increases the size of the equipment fleet carriers must have to service the market.increasing costs. 12
14 World Containerized Trade Outlook World containerized trade estimated to have moderate growth this year. TP growth is expected to pick up in 2013 Containerized Trade Growth Intra-Asia Global -4.2% -7.1% 17.2% 16.0% 15.3% 15.0% 9.3% 8.3% 8.4% 6.9% 6.8% 6.7% 6.4% 5.9% 5.5% 4.9% 0.4% 2.4% Global Trade Growth Alphaliner (Mar 20, 2012) 7.7% 6.5% 7.5% Clarksons (Feb 21, 2012) 7.9% 7.7% 8.3% Drewry (Dec 22, 2011) 6.5% 5.4% - JP Morgan (Nov 29, 2011) 6.4% 4.5% 6.3% Global Insights (Sep 30, 2011) 6.9% 6.8% 6.7% Transpacific HH Trade Growth Clarksons (Feb 21, 2012) -0.4% 4.2% 6.1% Alphaliner* (Jan 10, 2012) -0.8% 4.6% 5.1% Drewry (Dec 22, 2011) 0.4% 3.1% PIERS (Dec 2, 2011) 0.2% 2.7% 4.9% Transpacific (HH) Asia-Europe (HH) -13.9% -15.1% E 2013E Asia-Europe HH Trade Growth Clarksons** (Feb 21, 2012) 3.3% 2.8% 6.1% Alphaliner* (Jan 10, 2012) 2.8% 1.5% 6.3% Drewry (Dec 22, 2011) 3.9% 2.0% - 13 Source: Equity analysts, shipping consultants and SLM estimates Note: *Alphaliner TP is FE-US, ASEU is FE-Europe **Clarksons growth is Far East to Europe

15 Panama Canal Expansion: Update Larger vessels with increased deadweight Provide the capability to serve USEC from Asia Post Panamax trade patterns expected to shift, benefiting Atlantic Coast Ports Upgraded infrastructure is required to increase capacity and efficiently move products for global import and export customers 14
16 15 Building a Sustainable Organization
17 NOL Efficiency Leadership Program Gaining the Edge Q through 2012 Efficiency Leadership Program Challenging the way we do business today $500 Million Goal Driving for smarter ways to accomplish our tasks Discerning and meeting customer needs more effectively NOL s unique strengths Deep customer outreach Innovation Double-stack trains Post-panamax vessels Ocean guarantee Supply-chain products Recent strategic investments Re-modeling our IT: Completed SAP Finance module Modernizing our fleet: Invested in 32 large modern containerships (US$4 billion in last 4 years) 16
18 Fleet Renewal Building a modern and cost-competitive fleet, six 10,000 TEU vessels already delivered in ,000-9,999 TEU 10,000-12,999 TEU > 13,000 TEU Number of vessels 250,000 TEUs , , , ,000 6 vessels delivered Note: 5 out of the 10 x 14,000 TEU vessels for delivery between 2013 and 2014 will be chartered out to MOL
19 18


20 Service Options: Investing in our Network New CGG Facility 43 Acres Container Capacity: 1,600 Stalls, 400 Decked Gates: 4 Inbound/3 Outbound M&R: 19,000 Sq. Ft. Shop 10 Bay Chassis/ Container Repair 700 Gate moves daily Fleet Expansion 34 Vessels ordered Delivery between Q and 2014 Best fuel efficiency in the industry 10x14,000 TEU Vessels Productivity Improvements at GGS Crane Backreach Opens up more traffic lanes under the hook Better traffic flow, increased efficiency Future growth Increased safety 19

21 APL s Carbon Reduction Statement APL s 2015 goal is to reduce greenhouse gas emissions associated with cargo transportation and handling to 30% below 2009 emissions levels. 20

22 Container Shipping & Emissions Shipping is the most environmental friendly and energy efficient form of transportation 21

23 Continued Environmental Initiatives Eco-responsible operations for a sustainable future Enforcement of Emission Control Area (ECA) Speed Optimization, schedule, weather routing and best practices to reduce CO 2 emissions Low Sulphur Fuel Cold Ironing Seawater Scrubber Ballast Water Treatment Environmentally friendly paint on ship hulls Voluntary Speed Reduction in Southern California waters to reduce emissions Eliminating drayage thru on-dock rail Received Premier Marine Environment Award 22 22

24 APL New Builds - Environmental Features 23
25 24 Integrated Partnerships


26 Integrated Partnerships Collaboration Planning Building a Sustainable Organization Cost Efficiency Innovation 25
27 Thank You