דוגמאות ליישומי ניתוח רשתות בתחום התחבורה (הציבורית)
|
|
|
- Abigayle Lucas
- 5 years ago
- Views:
Transcription
1 דוגמאות ליישומי ניתוח רשתות בתחום התחבורה (הציבורית) YUVAL HADAS Department of Management, Bar-Ilan University Ramat Gan, Israel כנס יישומים סביבתיים של מדעי הנתונים, 23/10/18, בר-אילן
2 PT 101 Open data for PT (GTFS) PT Spatiotemporal analysis Outline 1. Hadas, Y., Ceder, A., Public Transit Network Connectivity: Spatial-Based Performance Indicators. Transportation Research Record: Journal of the Transportation Research Board 2143, Hadas, Y., Ranjitkar, P., Modeling public-transit connectivity with spatial quality-of-transfer measurements. Journal of Transport Geography 22, Hadas, Y., Assessing public transport systems connectivity based on Google Transit data. Journal of Transport Geography 33, Hadas, Y., Rossi, R., Gastaldi, M., Public Transport Systems' Connectivity: Spatiotemporal Analysis and Failure Detection, Transportation Research Procedia 3, Hadas, Y., (in progress). Spatial analysis of time-table change: the impact on users level-of-service.
3 PT 101
4
5 Time Ride Wait Board/Alight Walk Space Distance Comfort Effort Level of service Accessibility frequency Capacity Reliability Information Direction Location Arrival time PT systems characteristics Priority at intersections, dedicated lanes Timetables synchronization, operational tactics Electronic payments Stations location, connection, ease of connection Network design, optimization Navigation systems, automatic data collection, lowenergy positioning, micro navigation The Transit Capacity and Quality of Service Manual, (Kittelson and Associates et al., 2003)
6 Public Transit Design & Operations Design (predetermined goals static data): Network design (routes) Setting frequencies Timetable development Vehicle scheduling Crew scheduling Operations (real-time data & reliability dynamic data): Priority Tactics
7 Open Data (GTFS)

8 What Is Google Transit?

9 Google maps
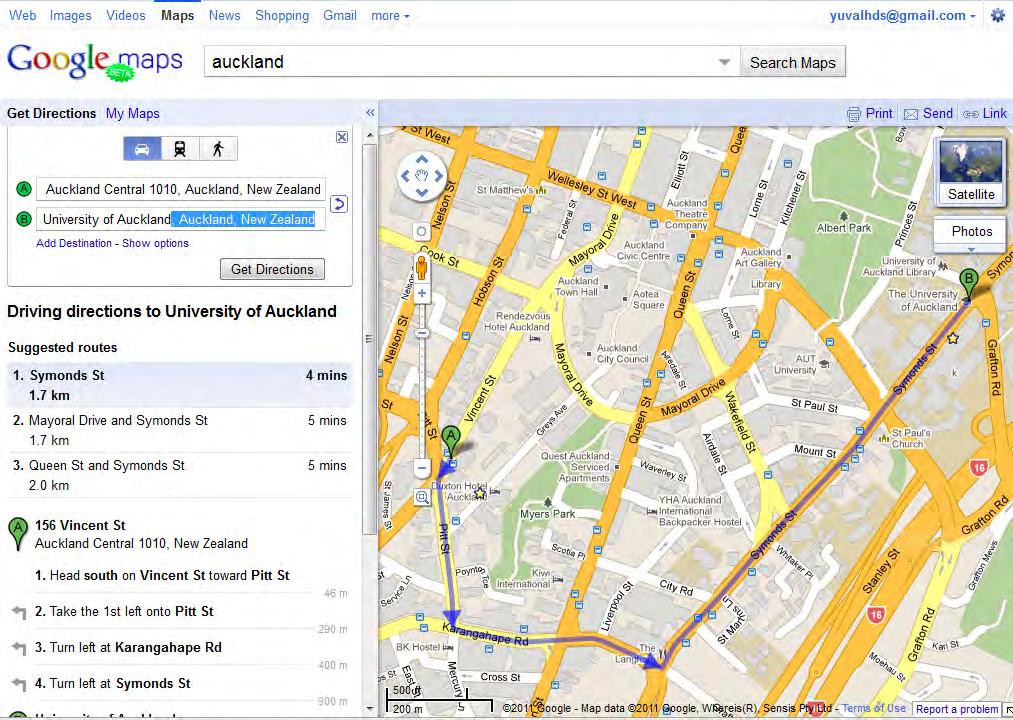
10 Driving Directions
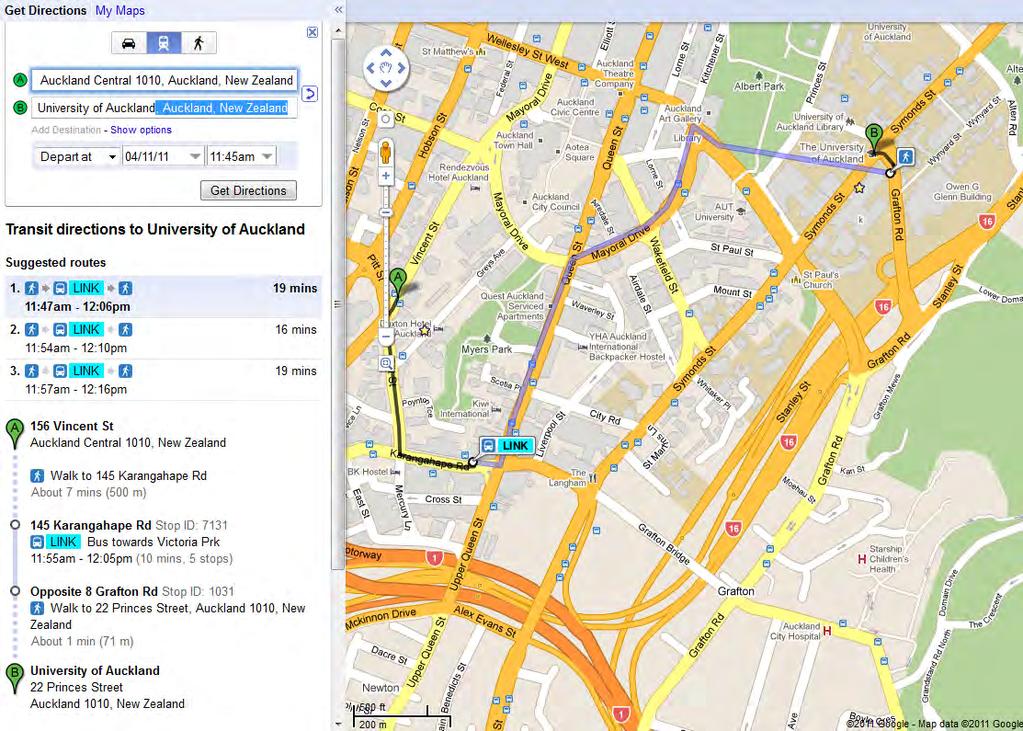
11 Transit Directions
 defines a common format for public")

 Enables authorities and operators to easily publish static data Enables developers")
12 What is GTFS? The General Transit Feed Specification (GTFS) defines a common format for public transportation schedules and associated geographic information. GTFS "feeds" allow public transit agencies to publish their transit data and developers to write applications that consume that data in an interoperable way (Google Developers, 2012) Enables authorities and operators to easily publish static data Enables developers to supply information to users (with realtime information) Enables researchers to easily investigate real world data
13 The General Transit Feed Specification Data Tables Data Table Agency Stops Routes Trips Stop times Calendar Calendar dates Fare rules Shapes Frequencies Transfers Description This file contains information about one or more transit agencies that provide the data in this feed. This file contains information about individual locations where vehicles pick up or drop off passengers. This file contains information about a transit organization's routes. A route is a group of trips that are displayed to riders as a single service. This file lists all trips and their routes. A trip is a sequence of two or more stops that occurs at specific time. This file lists the times that a vehicle arrives at and departs from individual stops for each trip. This file defines dates for service IDs using a weekly schedule. Specify when service starts and ends, as well as days of the week where service is available. This file lists exceptions for the service IDs defined in the calendar.txt file. If calendar_dates.txt includes ALL dates of service, this file may be specified instead of calendar.txt. This file defines the rules for applying fare information for a transit organization's routes. This file defines the rules for drawing lines on a map to represent a transit organization's routes. This file defines the headway (time between trips) for routes with variable frequency of service. This file defines the rules for making connections at transfer points between routes.
14 Agencies providing GTFS feeds 7/12 11/13 12/16 10/18 * Open access No access Total ( * - Google feeds
15 GTFS based assessment of PT systems
16 Objectives (1) Develop a model for assessing PT connectivity based on the attributes of time and transfer by mode Provide a decision-support tool for the identification of inefficiencies in the public-transit system PT data, Network, Demand
17 Trip Components
18 Connecting stops
19 Creating routes
20 PT routes

21 Road network and PT routes
22 Trip s Dimensions Transfer Street-crossing transfer Sidewalk transfer Non-walk transfer One-leg trip Ride time (α=1) Wait time (α=3) Walk time (α=2) Time
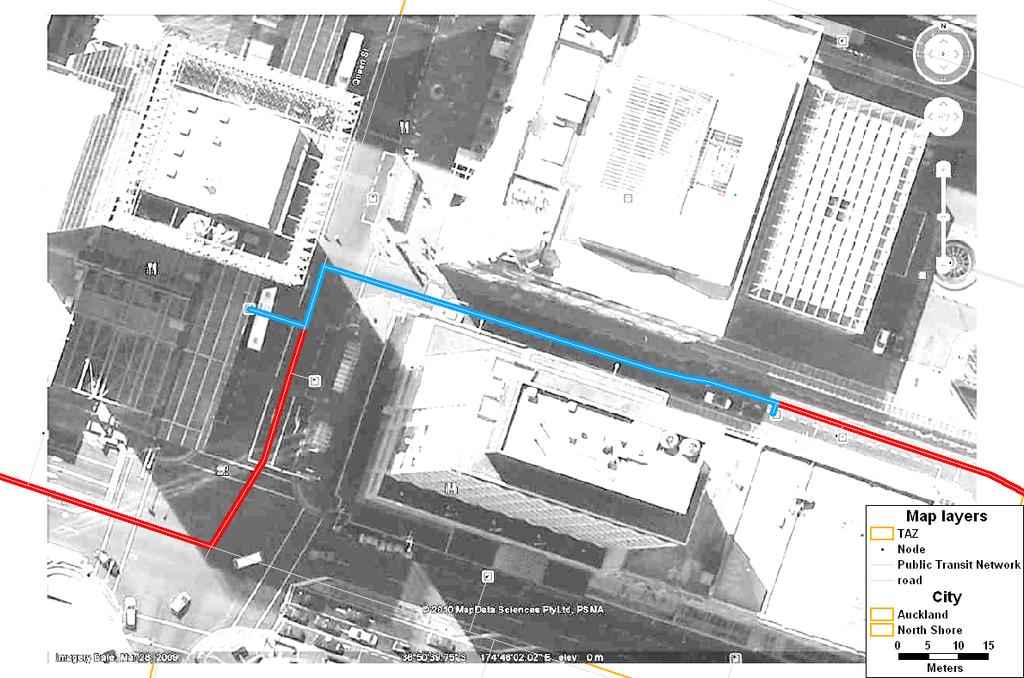
23 Street-crossing transfer
24 Sidewalk transfer


25 Non-walk transfer

26 One-leg trip

27 Case study

28 Case Study (Auckland, New Zealand)
29 Results Origin Destination OD Pairs Paths Average Travel Time Analysis Travel Time Average Travel Time [min] Ride Time Auckland Auckland 108, % Auckland North Shore 38, % North Shore Auckland 38, % North Shore North Shore 13, % Trips Legs and Mode Split Analysis Origin Destination Average Trip Legs % Bus Wait Time % % % % Walk Time % % % % Mode % Rail % Ferry % Walk Auckland Auckland % 2% 0% 52% Auckland North Shore % 2% 2% 47% North Shore Auckland % 0% 2% 44% North Shore North Shore % 0% 0% 47% Origin Destination Street Crossing Transfer-Type Analysis % Transfers Sidewalk Non-walk One-Leg Trip Auckland Auckland 73% 6% 3% 18% Auckland North Shore 77% 18% 4% 1% North Shore Auckland 76% 13% 6% 5% North Shore North Shore 57% 17% 4% 21%
30 Objectives (2) The assessment is based solely on Google-transit data and transport networks PT data, Network, Demand

31 Speed Analysis Auckland Portland Vancouver

32 Road coverage in Auckland CBD 08PM-10PM 08AM-10AM
33 Road coverage in Vancouver
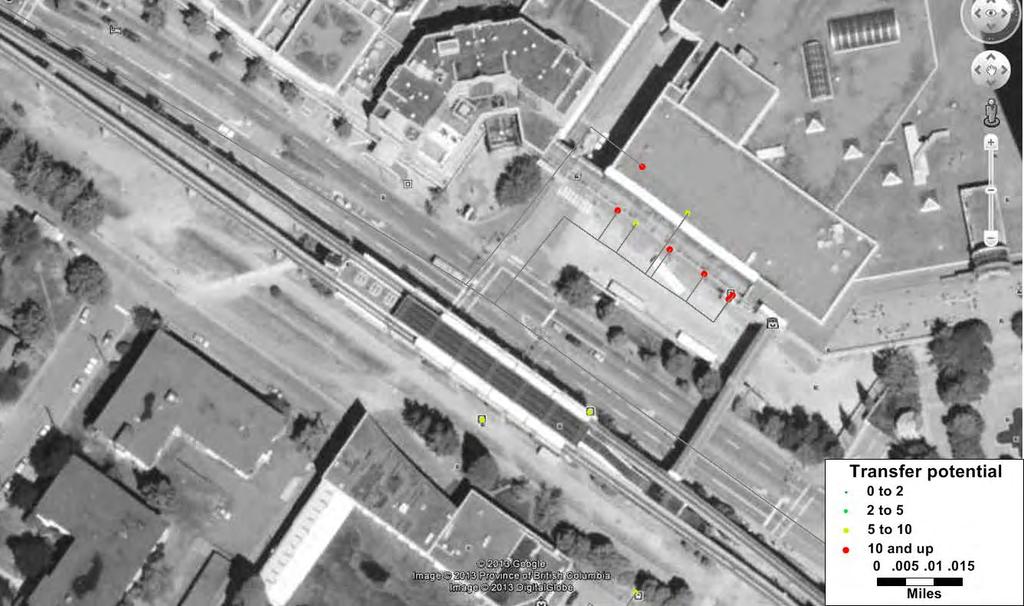
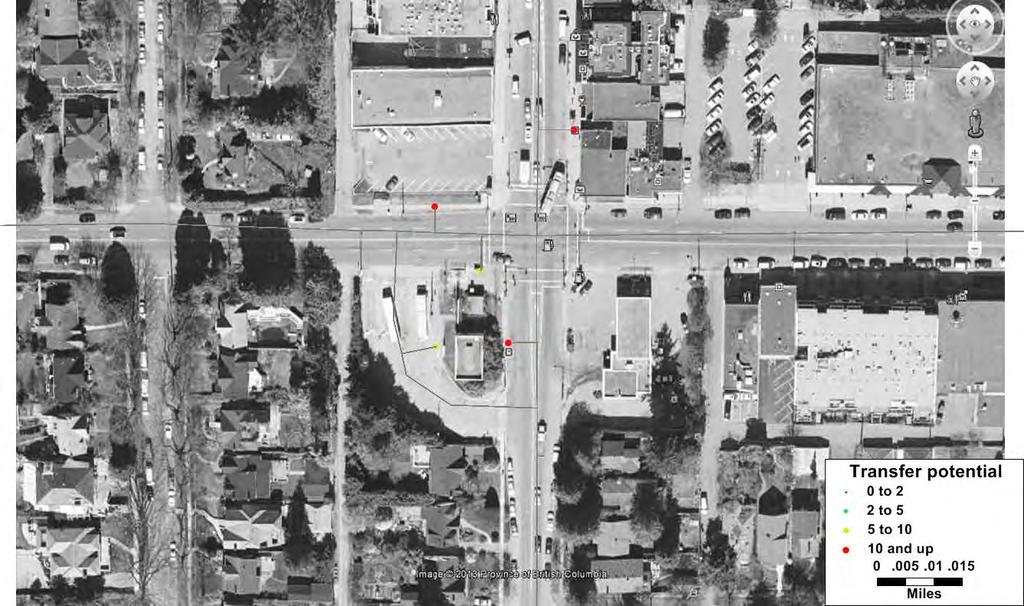
34 Stop-transfer Potential 100m 50m 1, 2 3, 5 3, 4 Dist. 50m 100m wait 1min 4 7 5min , 1
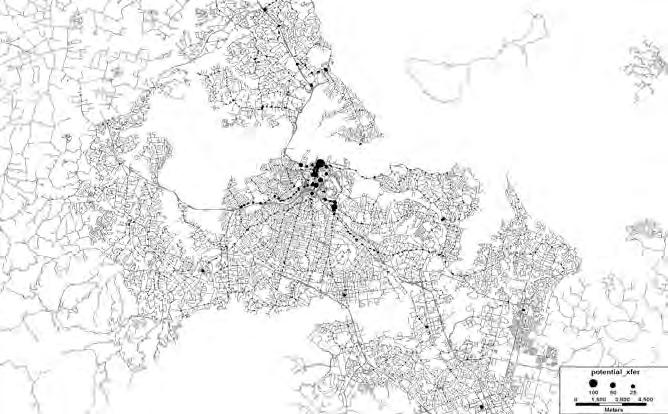


35 Stop-transfer potential maps Auckland Portland Vancouver

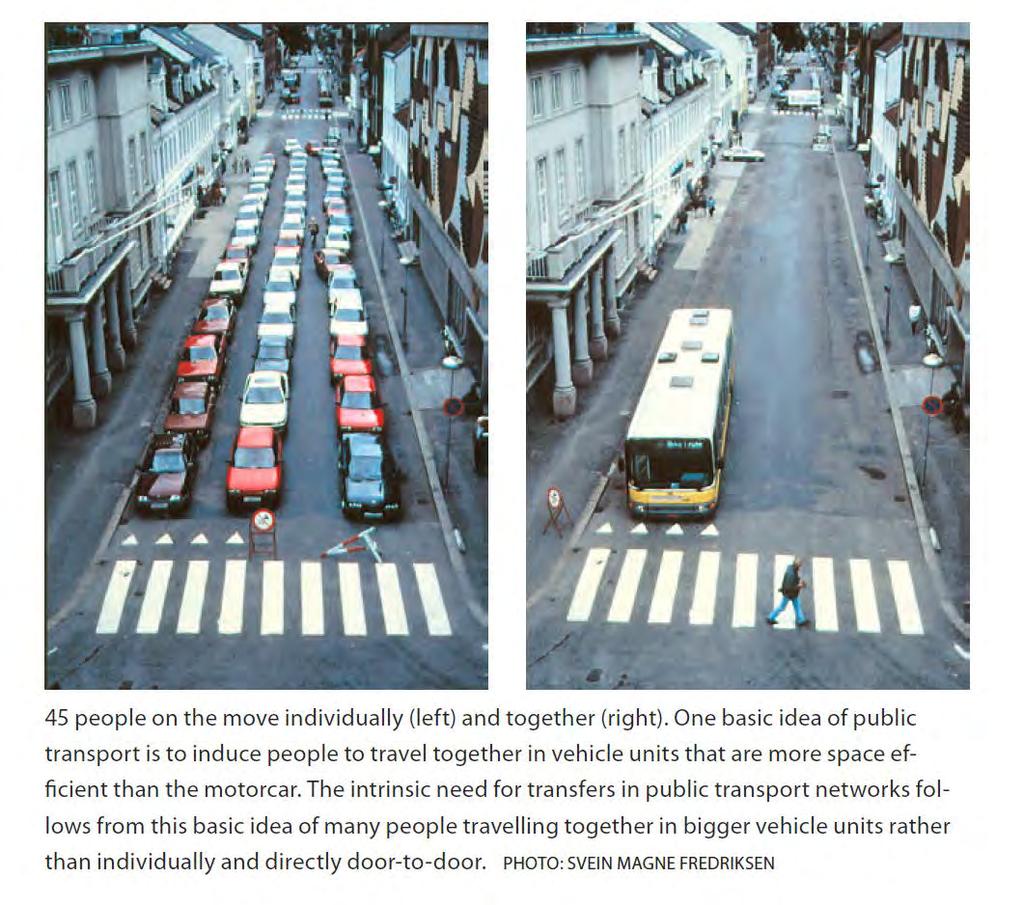
36 Good planning space and time
37
38
39 Objectives (3) The assessment is based solely on Google-transit data and demand PT data, Network, Demand

 Set 3( a, b, c) Set 4")
40 Destination-direct stop coverage indicator Destination set 1 Destination set 2 b a c Set 1 (a) Set 2 (a, b) Set 3( a, b, c) Set 4 (all stops)
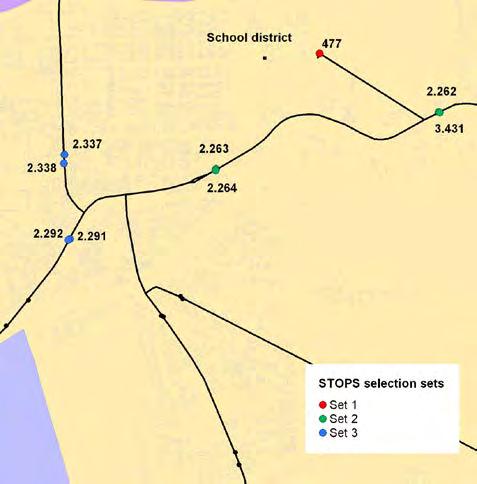
41 School accessibility
42 Objectives (4) The assessment is based solely on Google-transit data PT data, Network, Demand

43 The question Is the new timetable better?
44 I don t know! The answer
45

46 Data sources GTFS based data Routes Stops Trips & stop-times Calendar Population per zone Road layer (for visualization)
47 Aggregated analysis Destination Origin Hospital Industrial Zone High-tech Park Municipality Trips Travel Time Trips Travel Time Trips Travel Time Trips Travel Time Quarter Feb June Feb June Feb June Feb June Feb June Feb June Feb June Feb June For selected destinations. Green significant improvement, Red - significant decline

48 Spatial analysis Industrial Zone Accessibility is mostly with a transfer Direct trips Indirect trips Direct + Indirect trips

49 Spatial Change Analysis - =
50 The difference between the two periods: Blue increase (higher frequency) Red decrease (lower frequency) Change in direct trips
51 Change in travel time The difference between the two periods: Green decreased travel time Red increased travel time Decrease Increase
52 I don t know! The answer
53 תודה Thanks