Virginia s Prioritization Process Implementing SMART SCALE
|
|
|
- Caroline Ellis
- 5 years ago
- Views:
Transcription

1 Virginia s Prioritization Process Implementing SMART SCALE Transportation for America Massachusetts Transportation Leadership Academy December 12, 2017
2 Overview Developing a prioritization process for Virginia State legislation and bi-partisan support General framework Integration of planning and programming Applications process Who can apply Eligibility Project evaluation and scoring Factors and weighting Scoring Measures and methodologies Lessons Learned 2
3 Building the Foundation for SMART SCALE
4 Virginia s Statewide Prioritization Process Legislation championed by Democratic Governor and the Republican Speaker of the House 2014 Virginia General Assembly :5 of the Code of Virginia Requires Commonwealth Transportation Board (CTB) use objective and quantifiable process for the allocation of construction funds Board allocates construction funds for the Commonwealth Programming of funds for capacity enhancing projects Intent for the CTB to select the highest ranking projects however, they maintain the authority to propose adjustments to the rankings. Policy developed over a 16 month period and adopted by Commonwealth Transportation Board in June
5 Broad-Based Evaluation Factors Candidate projects are screened to determine if they qualify to be scored. All projects by law are evaluated using the following factors: Safety Congestion mitigation Accessibility Land Use (only in areas over 200,000) Economic development Environmental Quality 5
6 Three Key Goals Established goals for successful implementation: Promote performance in the selection of projects Provide stability to the Six-Year Improvement Program Establish project pipeline that links planning to programming Board direction: Simple and straightforward Does not require applicants to invest significant time and resources or require the use of consultants VDOT and DRPT staff will be available to provide support and tools for applicants in compiling data and information needed for application The application process will be electronic and map-based to facilitate automated population of key data elements 6
7 Context for Reform Legislature enacted significant transportation revenue package in 2013 Desire by lawmakers to demonstrate to public the benefits from new taxes Decision-making process was opaque in the sense that it was driven by politics Lawmakers and stakeholders concerned that state was not advancing projects that addressed the more urgent needs Governor McAuliffe campaigned on reforming transportation to pick the right projects, build the best ones 7
8 Political Support is Critical Keys to Political Support Broad based evaluation something for everyone Recognizes that different parts of the state have different needs Process Development Mode-neutral Legislature controlled by opposite party of Administration Process Implementation Did not impact fully-funded projects Provide transparency in the process Deliver! Demonstrate effective and efficient use of funding by delivering on time and on budget 8
9 Concerns of State and Local Officials All the funds will all go to Northern Virginia Rural areas will lose out in this process My region pays taxes and has transportation needs Prioritization should be done at a regional level, not a statewide level Politics will still drive this process I do not think this is going to change anything 9
10 Public Engagement is Critical 27 Commonwealth Transportation Board public hearings across the state Stakeholder session in every construction district Individual meetings with every Metropolitan Planning Organization (MPO) Numerous presentations at stakeholder and association conferences Developed Stakeholder Communication Plan and Public Engagement Plan 10
11 Guiding Principles for Measures Analyze what matters to people and has a meaningful impact Look at benefits relative to cost Transparent and understandable Must work for both urban and rural areas Must work for all modes of transportation Minimize overlap in measures 11
12 Process Used to Develop Measures Researched best practices from other state DOTs and MPOs Secretary established an Executive Work Group to oversee implementation Established sub-work groups focused specifically on policy, measures and the online portal Held peer exchange workshop Held outreach meetings with key stakeholders Surveyed stakeholders Pilot project evaluation brought before the Board 12
13 Reformed Funding Formulas In 2015 legislature adopted Administration s recommended revisions to funding formulas Amend and reenact which established the highway allocation formula for the $500 million CTB annual allocation Runs all state and federal construction revenues, excluding specialized programs, through formula After capital rehabilitation and reconstruction 50% of funds distributed at statewide-level based on prioritization process 50% of funds set-aside for districts based on formula and then distributed within the district using prioritization process 13
14 Benefits of SMART SCALE The team successfully developed and implemented what is likely the most transformative transportation legislation in Virginia the last 30 years. Improved transparency Enhanced accountability Better certainty for project sponsors and business community Project design focused on achieving most benefits for the least cost Provides political cover to allow planning and programming to proceed without intervention 14
15 Impact of SMART SCALE to Project Development Stronger and more thorough project planning Planning before capital improvement program Project Scopes and Estimates focusing scope on problem/ needs trimming the fat Re-evaluating solutions to problems Evaluate whether identified need can be addressed through operational improvements or TDM Evaluate current scope to determine if there are components that do not address identified need(s) Evaluate current scope to determine whether design can be modified or design exceptions utilized to reduce costs Thinking beyond SOVs opportunities for bike/ped, transit, TDM 15
16 Impact of SMART SCALE to Program Development Strong link between planning and programming Paradigm shift for how projects are selected for funding Increased stability in the SYIP Shift from a top down approach to a bottom up approach to transportation - VDOT/DRPT cannot submit projects Projects are no longer partially funded - projects selected for funding will be fully funded through construction Stronger role for CTB members - can only be removed for cause 16

17 Increased Transparency 17
18 Major Challenges Experienced Group Discussion 18
19 Integrating into the planning and programming processes 19


20 Life Cycle of a Candidate Project How it s planned. How it s scored. How it s funded. MPO CLRPs Corridor Studies STARS program Local Comp Plans District Grant High-Priority
21 How it is planned: VTrans 2040 VTrans is the long-range, statewide multimodal policy plan - Vision and Goals for transportation in the Commonwealth VTrans2040 serves two functions and produces two independent, but connected documents: 25 year vision document Multimodal Transportation Plan (VMTP) includes Multimodal Needs Assessment


22 How are projects filtered? Project must meet a need identified in VTrans to be eligible
 by October 1, 2015 to ensure that projects submitted to promote these areas meet the HB2 screening requirement.")
23 VTrans - Needs Assessment 4 Need Categories Corridors of Statewide Significance Regional Networks Urban Development Areas (UDA) Safety Note: Map includes all locally designated growth areas that appear consistent with the intent of OIPI is asking that localities who want their growth areas to qualify for HB2 funding to add a code reference ( ) by October 1, 2015 to ensure that projects submitted to promote these areas meet the HB2 screening requirement. Projects promoting UDA-like designated growth areas with the proper code reference submitted after October 1 will not be considered in the first round of HB2 project screening. 23

24 Virginia CoSS 24
25 Regional Networks Defined as: Jurisdictions that are included either in whole or in part within MPO Planning Area Boundaries Any additional element of the transportation system that is connected to the MPO area and deemed critical to the MPO 25

26 Urban Development Areas UDAs Areas voluntarily designated by local governments as prime areas for future economic growth pursuant to Must reflect transportationefficient land use principles including Mixed-use land use Interconnected streets Moderately compact growth 26

27 Safety Safety needs based on the top 100 intersections and segments identified based on PSI, Potential for Safety Improvement, in each district PSI score is the number of serious or fatal crashes minus the predicted rate for that type/volume roadway 27
28 First round of projects FY Six-Year Improvement Program Update $500M for High Priority Projects Locally or Regionally submitted projects compete statewide $500M for Construction District Grant Projects How it is funded: HB 1887 Formula driven distribution to 9 construction districts Locally submitted projects compete within each district 28 28
29 Group Discussion Q&A 29
30 SMART SCALE Application Process 30
31 Who can submit? Project System Regional Entity (MPOs, PDCs) Locality* (Counties, Cities, Towns) Public Transit Agencies Corridor of Statewide Significance Yes Yes, with a resolution of support from relevant regional entity Yes, with resolution of support from relevant regional entity Regional Network Yes Yes Yes, with resolution of support from relevant entity Urban Development Area No Yes No * Localities are also eligible to submit projects addressing a safety need identified in VTrans 2040 under the Construction District Grant Program 31

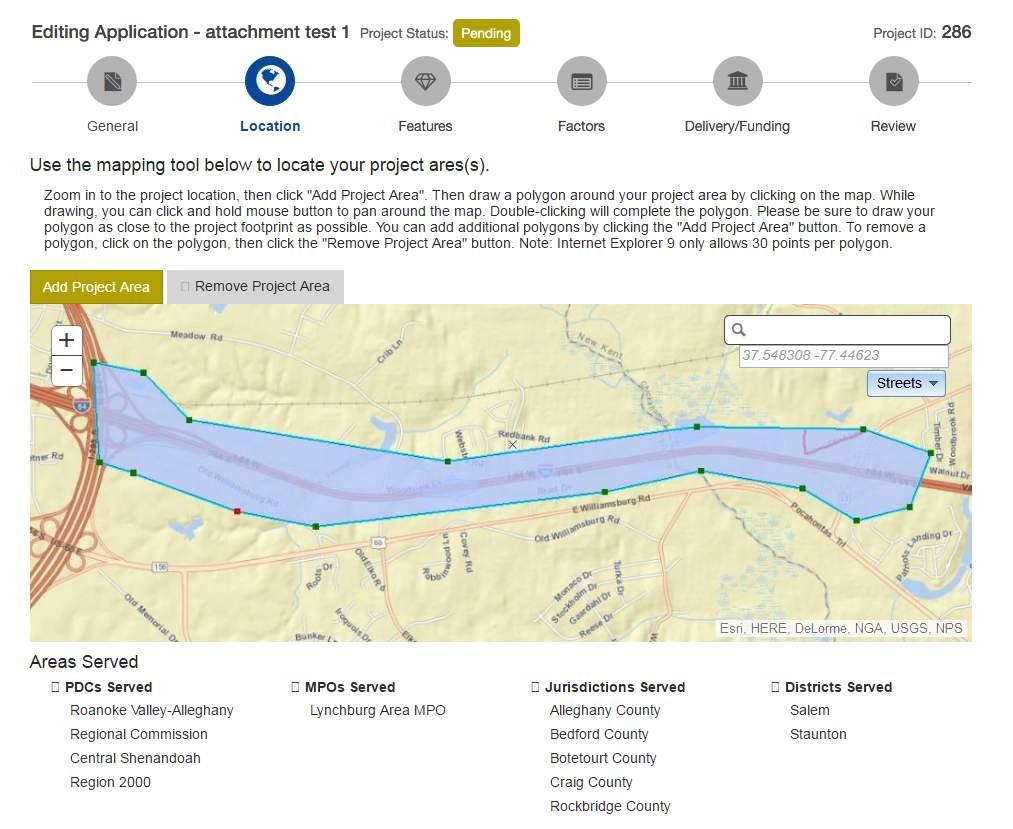
32 How do they submit an application? 32
33

34 All grant request applications managed in one system
35
36 SMART SCALE Validation and Screening 36
37 Validation Process VDOT/DRPT review Focus on the following: Project Eligibility Studies not allowed Project must be capital improvement, demand management or safety project State of Good Repair projects not allowed Scope and Budget Project Readiness Projects must be sufficiently developed such that benefits can be calculated SMART SCALE Factors Scoring items that applicant provides in the following categories 1) Accessibility, 2) Environment, 3) Economic Development and 4) Land Use and Transportation Coordination (Area Types A and B only) Application Changes Utilized portal to document changes between applicant submitted application and State recommended changes Applicant concurrence of changes documented 37 37
38 Screening/Eligibility Process High Priority Projects Project must meet a need identified for Corridor of Statewide Significance Regional Network Construction District Grant Programs Project must meet a need identified for Corridor Statewide Significance Regional Network Urban Development Area Safety Projects must meet eligibility requirements must be a capacity, operational, TDM or safety improvement must be developed sufficiently such that benefits can be calculated must have a preferred alternative VTrans Multimodal Work Group VDOT 38 38
39 Group Discussion Q&A 39
40 SMART SCALE Measures and Scoring 40

41 SMART Scale Factors 41
42 Factor Areas Goals that guided measure development Safety reduce the number and rate of fatalities and severe injuries Congestion reduce person hours of delay and increase person throughput Accessibility increase access to jobs and travel options Economic Development support economic development and improve goods movement Environmental Quality improve air quality and avoid impacts to the natural environment Land Use support transportation efficient land development patterns 42


43 How Scoring Works Everything is Relative

44 Everything is Relative Highest Value Dictates Scores Change here only affects one score Change here affects all scores The best project for that measure dictates the score for all other projects 44

45 Area Type Weighting Factor Congestion Mitigation Economic Development Accessibility Safety Environmental Quality Land Use Category A 45% 5% 15% 5% 10% 20% Category B 15% 20% 25% 20% 10% 10% Category C 15% 25% 25% 25% 10% Category D 10% 35% 15% 30% 10% 45
46 Sample Project Scoring Congestion Safety Accessibility Environ. Econ. Dev. Land Use Project "A" - located in Typology A Throughput Delay F &SI Crashes F &SI Crash Rate Access to Jobs Access to Jobs (Dis. Pop.) Multimod al Choices Air Quality Natural & Cult. Resource s Economi c Develop ment Goods Movement Travel Time Reliability Trans. Efficient Land Use Measure Score Measure Weight 50% 50% 50% 50% 60% 20% 20% 50% 50% 60% 20% 20% 100% Weighted Measure Score Raw Factor Score Factor Weighting (Typ. A) 45% 5% 15% 10% 5% 20% Weighted Factor Score Project Score 35.9 Total Project Cost $20,000,000 Score Divided by Total Cost HB2 Cost $10,000,000 Score Divided by HB2 Cost

47 How does cost affect the score? SMART SCALE requires that benefits produced by a project be analyzed on a basis of relative costs Results to be provided to Commonwealth Transportation Board based on: Benefits relative to SMART SCALE cost Benefits relative to total cost Benefit Score Cost 47

48 Why benefit/$ is important Raw Benefit Score 48


49 Why benefit/$ is important Project Cost (requested amount) 49


50 Why benefit/$ is important SMART SCALE Score - Benefit/Cost 50
51 Rethinking how we solve transportation problems SMART SCALE STARS Arterial Preservation and Innovative Intersections Common Sense Engineering Common Thread Focused Cost Effective Solutions 51
52 Why Cost Effectiveness Matters Opportunity Costs Fleet Manager Analogy Objective: Increase fuel efficiency of 100 vehicle fleet Budget: $100,000 Strategy 1 Replace 2 vehicles with electric vehicles at cost of $50,000 each Strategy 2 Invest $1000 in each vehicle in fleet to improve fuel efficiency of each vehicle by 10% New gas saver tires Vehicle tuning chip High efficiency air filters 52
53 Why Cost Effectiveness Matters Opportunity Costs Scenario Comparison Objective: Reduce congestion and improve safety along corridor with 10 signalized intersections Strategy 1 Widen corridor by one lane in each direction for $90,000,000 Strategy 2 Convert entire corridor to Superstreet and install adaptive signal controllers and transit signal priority for $30,000,000 53
54 Transportation as a System Grade separate for $65M Peak hour queuing Bottleneck transfers to next signal 54
55 Transportation as a System Innovative intersection treatments at all 4 signals to improve throughput and reduce conflict points - $3-$5M per intersection Peak hour queuing Improved performance along corridor - savings can be used to solve problems on other corridors 55
56 Measures used to calculate project benefits 56
57 Measuring SAFETY 50% of score Expected reduction in Equivalent Property Damage Only (EPDO) crash frequency (100% of score for transit projects) 50% of score Expected reduction in Equivalent Property Damage Only (EPDO) crash rate Factor Congestion Mitigation Economic Development Accessibility Safety Environmenta l Quality Land Use Category A 45% 5% 15% 5% 10% 20% Category B 15% 20% 25% 20% 10% 10% Category C 15% 25% 25% 25% 10% Category D 10% 35% 15% 30% 10% 57
58 Safety - How Highway Projects Compile fatal/injury crash data for project limits (5 years) Segment project for safety analysis (segments and nodes) Convert crashes to EPDO Weights Fatal (K) Severe Injury (A) - 30 Minor Injury (B) - 10 Non-visible injury (C) - 5 Based on project scope select Crash Modification Factor(s) Use CMF(s) to calculate reduction in crashes and rate 58 58

59 CMFs How a CMF works # of crashes before project * CMF = number of crashes expected to remain after project Lower number is better - CMF of 0.20 means 80% of crashes are expected to be eliminated 59

60 CMFs For list of planning level Crash Modification Factors used in SMART SCALE please visit the SMART SCALE Resources page - Link under safety
61 Safety - How Transit*/Travel Demand Management/New Location Identify corridor(s) served Compile fatal/injury crash data for project limits (5 years) Convert crashes to EPDO Use ridership/volume reduction to calculate reduction in VMT Use VMT reduction to calculate crash reduction *Transit - Fatal and Injury frequency weighted at 100% 61
62 Safety Measures Proposed Changes for Next Round Many fatalities and severe injuries are the result of factors unrelated to roadway design Vehicle age and age of occupants plays a major role in determining whether a crash results in a fatality or severe injury Statistics from 2013 NHTSA Report 71% more likely to die if car is 18+ years old 50% more likely to die if car is years old 2012 AAA Traffic Safety Report Deaths per 100 million VMT decrease from age 16 until age 60 then it increases sharply (survivability) Current methodology weights fatalities 18x greater than severe injuries 62
63 Safety Measures Proposed Changes for Next Round Roadway improvements often cannot address crashes resulting from driving under the influence Have had a project recommended for funding due to single crash over 5-year period that involved alcohol Remove crashes that are the result of driving under the influence from consideration in scoring 63
64 Safety Measures Proposed Changes for Next Round Difference between fatality and severe injury often related to age of vehicle and age of occupant Many states used a blended value for fatalities and severe injuries Recommend the use of a blended weighting for SMART SCALE similar to other states in Round 3 scoring 64
65 Safety Measures Use of Reduced and Blended Rates Agency Fatal Injury (K) Incapacitating injury (A) Moderate Injury (B) Minor Injury (C) PDO Missouri Oregon DOT Massachusetts Ohio Wyoming Kansas Illinois Hampton Roads, VA Iowa $1,000,000 $150,000 $10,000 $2,500 $2,500 Minnesota $540,000 $270,000 $58,000 $29,000 $4,200 Virginia Smartscale


66 Encouraging Access Management Poor Access Management Good Access Management 66


67 Encouraging Alternative Intersections Divergent Diamond Superstreet Jug Handle Continuous Flow Intersection Quadrant Roadway Intersection 67
68 Rural Application - US 17 in Leland, NC 55% decrease in Fatal and Injury crashes Superstreets can be implemented without signals 68
69 Urban Application - US 281 in San Antonio, TX 53% decrease in travel time Loons to facilitate U-turns 69
70 Measuring CONGESTION MITIGATION 50% of score Change in peak period (multimodal) person throughput in the project corridor 50% of score - Change in the amount of peak period person hours of delay in the project corridor Factor Congestion Mitigation Economic Development Accessibility Safety Environmenta l Quality Land Use Category A 45% 5% 15% 5% 10% 20% Category B 15% 20% 25% 20% 10% 10% Category C 15% 25% 25% 25% 10% Category D 10% 35% 15% 30% 10% 70
71 Congestion How Person Throughput Highway Projects Volume to Capacity ratio for each segment and intersection calculated for peak hour Calculate volume above capacity now being served by improvement convert to person throughput Select lowest increase in throughput from all components Apply expansion factor to account for peak period based on INRIX Travel Time Index (TTI) Transit/Travel Demand Management Identify corridor served Determine peak period ridership/volume reduction (Throughput A) Using process above for highways, calculate additional vehicle demand that can now be served based on transit diversion in corridor served (Throughput B) Add together to get total person throughput 71 71
72 Congestion How Person Hours of Delay Highway Projects (Existing) Delay for each segment and intersection calculated for peak hour Sum delay reduction (up to posted speed limit) and convert to person hours Apply expansion factor to account for peak period Transit/Travel Demand Management Identify corridor served Determine peak period ridership/ volume reduction Using process above for segments, calculate reduction in person hours 72 Method only calculates delay savings up to posted speed limit 72
73 Congestion How Adjusting Volume to Capacity Transit, P&R V C Before Speed V C After Speed No build 73 Capacity Improvement Build 73
74 Congestion Scoring: Major Widenings on Interstates and New Location Facilities Projects that have impacts to regional travel patterns and require the use of travel demand model in congestion evaluation: Major widenings of interstates (addition of one or more travel lanes) over two miles in length New location facilities Combination projects (widening and new location) Inputs Number of lanes Design speed Proposed functional classification Assumptions Vehicle occupancy rate is held constant statewide persons per vehicle based on National Household Travel Survey Peak period from travel demand models is assumed to be 30% of the daily volume Throughput increase based on total delay savings and average trip length (in time) from the NB condition 74
75 New Location Example 75
76 New Location Example If segments served by project are not operating below posted speed limit - delay saving not counted 76

77 Importance of Intersections Reducing full movement access points Improving turn lanes Reducing # of signal phases Alternative intersection treatments 77

78 Urban Application - US 281 in San Antonio, TX 53% decrease in travel time Loons to facilitate U-turns 78

79 Rural Application - US 17 in Leland, NC 55% decrease in Fatal and Injury crashes Superstreets can be implemented without signals 79
80 Measure Enhancements Congestion Benefits to longer projects may have been impacted Phased improvement projects broken into pieces could score similar results to the entire project Shorter projects have a higher probability of receiving funding EXAMPLE: District Staunton Salem Description Extend SB Deceleration NB Acceleration lanes by 150' each, I-81 Exit 296 in Staunton Construct 1.12 mile auxiliary lane on I-81N between Exit 140 to 141 Throughput Score Recommend modifying measure to account for increase in person miles travelled allowed by the project within the capacity of the facility
81 Measuring ACCESSIBILITY 60% of score Change in cumulative job accessibility (within 45 minutes) (within 60 minutes for transit projects) 20% of score - Change in cumulative job accessibility for disadvantaged populations (within 45 minutes by automobile and 60 minutes by transit) 20% of score Assessment of the project support for connections between modes, and promotion of multiple transportation choices Factor Congestion Mitigation Economic Development Accessibility Safety Environmenta l Quality Land Use Category A 45% 5% 15% 5% 10% 20% Category B 15% 20% 25% 20% 10% 10% Category C 15% 25% 25% 25% 10% Category D 10% 35% 15% 30% 10% 81 81
82 Accessibility - How Access to Jobs All Projects Using analysis for congestion measures use change in speed Also consider reduced travel distances from new facilities and changes in land development patterns Use improvement in speed to code improvement into Accessibility GIS tool conduct before and after analysis to get change in cumulative job access Accessibility Tool GIS based model Analysis done at Census block group level job access between each block group within 45 minutes (60 minutes for transit) Decay factor applied based on travel time 82 82
83 Accessibility - How Access to Jobs Accessibility Tool No-Build Tool analyzes existing accessibility to jobs 83
84 Accessibility - How Access to Jobs Accessibility Tool No-Build Tool moves to next block, assessing existing accessibility 84 84
85 Accessibility - How Access to Jobs Accessibility Tool No-Build Process is repeated for all blocks to establish existing accessibility to jobs 85 85
86 Accessibility - How Access to Jobs Accessibility Tool Build Tool then analyzes change in access to jobs based on proposed improvement 86 86
87 Accessibility - How Access to Jobs Accessibility Tool Build Tool moves to next block, calculating change in job access 87 87
88 Accessibility - How Access to Jobs Accessibility Tool Build Process is repeated for all blocks increase in access for each block is summed and used to score projects 88
89 Disadvantaged Access to Jobs Similar process in previous slides used for disadvantaged access to jobs Main difference is the utilization of disadvantaged population data in the calculation Disadvantaged population Low income, elderly, minority, and Limited English Proficiency population percentage by Census Block Group Compared block group and identified block groups in the 75 th percentile of the region regions defined as PDC/MPO/NVTA 89 89
90 Projects receive points based on features than enhance multimodal access (Max 5 points) Transit Park and Ride Bike Accessibility - How Access to Travel Options Pedestrian HOV/HOT Real time traveler info or wayfinding Scaled by the number of anticipated Non-SOV users Transit Users + Bike Users + Pedestrians + HOV/ Park and Ride 90 90
91 Measuring ENVIRONMENTAL QUALITY 50% of score Potential of project to reduce criteria air pollutant and greenhouse gas emissions 50% of Score Potential impacts to natural and cultural resources Factor 91 Congestion Mitigation Economic Development Accessibility Safety Environmenta l Quality Land Use Category A 45% 5% 15% 5% 10% 20% Category B 15% 20% 25% 20% 10% 10% Category C 15% 25% 25% 25% 10% Category D 10% 35% 15% 30% 10% 91
92 Environment How Air Quality and Energy Air Quality/Energy Non-SOV Points awarded based on: Providing bicycle or pedestrian facilities Improvements for transit New or expanded Park and Ride lot Provisions for hybrid/electric vehicles or energy efficient infrastructure Points scaled based on number of non-sov users Freight Points awarded based on: Reduces delay at congested intersection, interchange or other bottlenecks Includes improvement to freight rail network or intermodal (truck to rail) facility Points scaled based on truck volume (facilities with 8% trucks or higher) 92 92
93 Environment How Natural/Cultural Resource Impact Sum the total acreage of land (within ¼ mile of project) in four categories: Conservation Land Species/Habitat Cultural Resources Wetlands (Data sources: VOF, VDCR, VDOF, VDGIF, NPS, VDHR, USFWS) Example Project Conservation Species/Habitat Cultural Resources Wetlands Total Acres A
94 Environmental Data Layers Conservation Land: VDCR 6F Properties Conservation Lands Easements Natural Heritage Screens VDOF Agricultural/Forest Districts VOF Protected easements TNC Protected Easements Species/Habitat: VDGIF Threatened and Endangered Species Threatened and Endangered Species (Eagles) Cultural Resources: NPS American Battlefield Protection Program Potential National Register Eligible Areas VDHR Architecture Archaeology Wetlands: USFWS National Wetlands Inventory 94

95 Methodology Buffer Area 1. Shows ¼-mile buffer created around each submitted project. 95

96 Methodology Buffer Area 2. Apply definition queries to the layers (e.g. excluding resources determined not eligible for the National Register of Historic Places) 3. Clip the individual layers to the buffer area for each project. 96

97 Methodology Buffer Area 4. Create a union of all features within each of the four categories and dissolving the resulting shapefile based on the Application ID. (Note: Overlapping acreage within each category will only be counted once; however, acreage between categories may overlap.) 97

98 Methodology Buffer Area 5. Acreages are then calculated for each category and Data exported to tables. 98

99 Environment How Natural/Cultural Resource Impact Scaling Impact and Assigning Points: The type of environmental document required for each project will be used to assess and scale the potential natural resource impacts. Environmental Impact Statement 50% of acreage will be used for scoring Environmental Assessment 30% of acreage will be used for scoring Categorical Exclusion 10% of acreage will be used for scoring In Round 2, the scoring method for this measure was modified - The potential for impact is weighted by the benefits points in other measures
100 Environment How Natural/Cultural Resource Impact Project Conservation Species/ Habitat Cultural Resources Wetlands Total Acres Enviro Doc Scaled Acres A EA 100 B EIS 150 C CE This value gets divided by the total acres within the ¼ mile project buffer 100
101 Environment Round 2 Scoring Method Impacted buffer ratio is used to develop normalized score (0-100) Buffer ratio of 0 = 100 points Next lowest buffer ratio >0 = 95 points Straight line linear regression between lowest buffer ratio >0 and greatest buffer ratio (greatest buffer ratio = 0 points) Buffer Ratio Normalized Score Project A Project B Project C Normalized Project D points are 50 multiplied 0 by the weighted points for the other scoring measures (Delay, Throughput, Crash freq, Crash Rate, Access Jobs.) Value above is renormalized and weighting (10%*50%) applied to calculate weighted score 101
102 Measuring ECONOMIC DEVELOPMENT Factor 60% of score Assessment of progress made towards new economic development 20% of score - Rate projects based on the extent to which the project is deemed to enhance access to critical intermodal locations, interregional freight movement, and/or freight intensive industries 20% of score Project s impact to travel time reliability 102 Congestion Mitigation Economic Development Accessibility Safety Environmenta l Quality Land Use Category A 45% 5% 15% 5% 10% 20% Category B 15% 20% 25% 20% 10% 10% Category C 15% 25% 25% 25% 10% Category D 10% 35% 15% 30% 10% 102
103 Economic Development How Development Supported For each project, development sites are identified that the project supports Proposed transportation improvement is evaluated on: Consistency with Local Comp Plan/Local Economic Development Strategy up to 1 point Consistency with Regional Economic Development Strategy up to 1 point Each development site is evaluated on: Consistency with local comp plan/zoning up to 1 point* Development status up to 1 point Site utilities up to 1 point Max 5 points per site used to weight square footage
104 Economic Development How Development Supported Buffers - Tier 1 Project Type 1 mile buffer Access Management Convert Existing Lane to Dedicated Bus Service Lane ITS Improvement(s) Add/Construct Bike Lane Improve Bike/Pedestrian Crossing (At Grade) New Intersection Bike/Pedestrian Other Improve Bike/Pedestrian Crossing (Grade Separated) New Park and Ride Lot Bus Transit Other Improve/replace existing bridge(s) Provide New Service Routes Construct Bus Stop / Shelter New/Expanded Vanpool or On-Demand Transit Service Rail Transit Other Construct Shared-Use Path Paved Shoulder (Minimum 4-Foot Ridable Surface) Ramp Improvement(s) Construct Sidewalk Right of Way/Easements acquisition required Road Diet Highway Other Roadway Reconstruction/Realignment TDM Other Improve Bus Stop/ Shelter Shoulder Improvement(s) Turn Lane Improvement(s) Improve Park and Ride Lot Improve Rail Crossing Increase Existing Route Service Addtl Vehicles or Increased Frequency Widen Existing Lane(s) (No New Lanes) 104
105 Economic Development How Development Supported Buffers - Tier 2 Project Type 3 mile buffer Increase Existing Rail Service Additional Cars or Routes Intersection Improvement(s) Managed Lane(s) (HOV/HOT/Shoulder) New Traffic Signal/Signal Optimization Rail Yard Improvements Station or Terminal Improvements 105
106 Economic Development How Development Supported Buffers - Tier 3 Project Type 5 mile buffer Add New Through Lanes(s) Additional Track - Rail Transit Additional Track - Freight Rail Freight Haul Increase Improve Grade-Separated Interchange New Bridge New Interchange New Rail Yard New Station New Terminal Roadway on New Alignment 106
107 Economic Development How Development Supported Adjusting Weighted Square Footage Two Adjustments Distance from project in miles (except sites less than 1 mile) Type of access provided Project provides a new, direct (physically to the site), primary access to the site that does not exist today Project improves existing access (or relocates existing access) to the site directly (Site must be physically adjacent to the project) 100% 100% Project enhances economic development by improving congestion, mobility, access, or operations in the vicinity of the site but the site is not physically adjacent to the project Formula (Points) x (Square Footage) / (Distance) x (Access Adjustment) 50% Development Name Total Points Square Footage Distance Site Access Access Adjusted Square Adjustment Footage Development A Project enhances economic development by improving congestion, mobility, access, or operations in the vicinity of the site but the site is not physically adjacent to the project 50% Development B Project improves existing access (or relocates existing access) to the site directly (Site must be physically adjacent to the project) 100%
108 Measure Enhancements ED.1 - Site Development Round 2 results raise concerns about the reasonableness of the results for this measure Roundabout project on 2 lane roadway and a cul-de-sac scored highest in the state Findings Zoned properties within allowable buffer contributed to anomalous results Gimme points - consistency with plan and utilities Project - Local Plans Project - Regional Plan Site - Zoning Site - Utilities Blank 13 Blank 344 Blank 141 Blank 289 Consistent with 833 Consistent with 944 Consistent with 1738 In place 1676 Referenced in 1145 Referenced in 703 Referenced in 112 Programmed 26 Grand Total 1991 Grand Total 1991 Grand Total 1991 Grand Total
109 Measure Enhancements ED.1 - Site Development Feedback/Direction from June CTB meeting Consider additional point for economically distressed areas Several data sources are available for determination of economically distressed areas Next several slides outline potential data sources to establish economically distressed areas in Virginia 109
110 Measure Enhancements ED.1 - Site Development Measuring Economic Distress 110

111 Measure Enhancements ED.1 - Site Development Measuring Economic Distress 111
112 Measure Enhancements ED.1 - Site Development Measuring Economic Distress 112
113 Measure Enhancements ED.1 - Site Development Measuring Economic Distress 113


114 Measure Enhancements ED.1 - Site Development Measuring Economic Distress 114
115 Measure Enhancements ED.1 - Site Development Recommendations for Round 3 Zoned properties must get primary access from project Remove 0.5 point for consistency with local and regional plans Transportation Project specifically referenced in local comprehensive plan or regional economic development strategy = 0.5 points Project within economically distressed area = 0.5 points Reduce max buffer to 3 miles for economic development sites 115
116 Measure Enhancements ED.1 - Site Development Recommendations for Round 3 (cont) Distinguish the level of readiness for site plans Site Readiness Points Conceptual site plan submi>ed 0.5 Conceptual site plan approved 1 Detailed site plan submi>ed 2 Detailed site plan approved 4 Consider the establishment of maximum square footage Based on current level of development - cannot exceed x% of total current square footage in jurisdiction(s) Currently working with several localities to determine if appropriate data is available 116
117 Economic Development How Intermodal Access Project can get up to 6 points Improve access to distribution centers or intermodal/manufacturing facilities Within 1 mile 2 points 1 to 3 miles 1 point Improve STAA Truck Route Improvement to STAA route - 2 points, Improve access to STAA route 1 point Improve access or reduce congestion around port/airports Within 1 mile - 2 points 1-3 miles 1 point Point are scaled by freight tonnage along corridor IHS Transearch data was used to calculate daily tonnage on the project Improve Access to distro, intermodal and manufacturing Improve STAA truck route Improve access reduce congestion ports/airports Tonnage (1000's) per day Measure Scaled by tonnage Project A Project B Project C
118 Measure Enhancements ED.2 - Intermodal Access Current Method Points are awarded based on a project s proximity to freight generators, truck routes, and freight destinations Total points are scaled by the maximum freight tonnage within the project area While the size of a project may affect its likelihood of falling within the buffer distance of freight facilities, its score does not directly scale by the size of the improvement 118
119 Measure Enhancements ED.2 - Intermodal Access Proposed Method District Project Description Total Points Round 1 and 2 Math Proposed Round 3 Math Maximum Freight Tonnage Improvement Length (miles) Intermodal Access Measure Staunton Extend SB Deceleration NB Acceleration lanes by 150' each, I-81 Exit 296 in Staunton ,160,000 69,600 Salem Construct 1.12 mile auxiliary lane on I-81N between Exit 140 to , ,000 Recommendation Scale points by freight tonnage-miles by multiplying the freight tonnage by the length of the improvement 119
120 Economic Development How Travel Time Reliability Measure looks at reliability of proposed corridor(s) served by the project Buffer Index (BI) - measure of the extra time traveler needs to add to trip to ensure arrival on-time - BI of 0.2 means travel has to add 20% buffer to trip Buffer Index is then adjusted to account for the following Crashes Crash Frequency - how crashes are affecting reliability (value 0-5) Crash Impact - effectiveness of project to reduce impact of crashes (value 0-2) Weather Frequency of weather events (snow and flooding) (value 0-2) Weather impact - effectiveness of project to reduce impact of weather event (Value 0-2) TT Reliability Measure ((Crash Freq * Crash Impact)+(Weather Freq * Weather Impact)) * BI Measure is then scaled by the Vehicle Miles Traveled (VMT) of the project
121 Measuring LAND USE 100% of score Degree to which project will support transportation efficient land use patterns and local policies Points awarded based on: Promoting walkable bicycle friendly mixed use development Supporting in-fill development Having an adopted corridor/access management plan that exceeds VDOT standards Points scaled by 2025 Activity Density within 1 mile Activity Density Calculation - Future Density + Change in Density Future Density ((2025 Pop+Emp)/Area in sq. mileage) + Change in Density* (2025 Pop+Emp/Buffer Area sqmi)-( 2015 Pop+Emp))/Buffer Area sqmi Project 2015 Pop+Emp Density 2025 Pop+Emp Density Change in Density 2025 P+E Density + Change A B C
122 Land Use How Local/Regional Land Use Policies Local/Regional Land Use Policies Points awarded based on: Promoting walkable bicycle friendly mixed use development Supporting in-fill development Having an adopted corridor/access management plan that exceeds VDOT standards Points scaled by projected population and employment density (from MPO approved travel demand model)

123 Access to Jobs Recommended Changes Eliminate the 45 and 60 minute cap for auto and transit job access respectively 123
124 Land Use Focused on projects that support transportation efficient development patterns in urban areas Current methodology has limitations Subjectivity Degree to which an area meets certain criteria Office of Intermodal Planning and Investment has developed new methodology to measure key characteristics non-work accessibility 124
125 Land Use Non-work Accessibility Examines accessibility to key non-work destinations such as grocery, healthcare, education, etc Targets for destinations established using Virginia observations Uses GIS software used for Access to Jobs measures Eliminate subjectivity and captures degree to which development patterns meet certain criteria 125

126 Land Use Non-Work Accessibility Northern Virginia 126

127 Land Use Non-Work Accessibility Roanoke 127
128 Land Use Recommended Measures 70% of score based on 2025 population and employment X non-work accessibility 30% of score based on Change in population and employment (Current day to 2025) X non-work accessibility 128
129 Communication and Outreach of Scoring 129
 Independent Verification and")

130 How do we communicate Building Public Trust and Transparency During the Scoring Process Blind testing of applications (10%) Independent Verification and Validation External Peer Review Group comprised of Virginia Association of Counties Virginia Municipal League, Virginia Transit Association Other non-governmental groups 130

131 How do we communicate Building Public Trust and Transparency After Projects are Scored General Assembly provided copy of score cards Documents posted on-line SMART Portal open for review of submitted applications Statewide Public Hearings After Projects are Selected for Funding SMART SCALE Dashboard 131

132 How projects are scored Scoring Process Teams established for each measure Central Office lead with regular communication/coordination between Central Office Resources and District Staff Utilization of embedded consultant resources at peak Conduct QA/QC Results combined and score generated Scoring results provided to Programming team to generate Staff Recommended Funding Scenario 132
133 How projects are recommended for funding Staff Recommended Funding Scenario Released in January (150 days prior to CTB action to adopt SYIP) along with measure calculations and scores Projects recommended for funding based solely on scores Forms SMART SCALE portion of Draft SYIP Stepwise process Step 1: Fund top scoring projects within each district eligible for DGP funds using DGP funds until remaining funds are insufficient to fund the next highest scoring project. Step 2: Fund top scoring projects within each district that would have otherwise been funded with available DGP funds, but were not because they are only eligible for HPP funds, using HPP funds, as long as their SMART SCALE cost does not exceed the total amount of DGP funds available to be programmed based on their rank. Step 3: Fund projects with a benefit relative to SMART SCALE score greater than an established threshold based on the highest project benefit using HPP funds until funds are insufficient to fund the next unfunded project with the highest project benefit. 133
134 Group Discussion Q&A 134
135 Lessons Learned 135
136 Lessons Learned After both rounds completed: Conducted Key Lessons Learned Activities External Review Group Review of measures development and scores Internal and External Stakeholder Surveys Surveys focused on application in-take process, screening and validation Implementation Team Workshops (included OIPI, DRPT, VDOT staff) Workshops focused on all aspects of process 136
137 Areas for Improvement External Review Group Consider approach to scale cost to avoid bias of low cost projects Consider modifications to accessibility measure to include non-work accessibility Provide additional feedback to applicants to improve application quality in future rounds Process was transparent and a great deal of information was made available to facilitate understanding 137
138 Lessons Learned Stakeholder surveys were conducted in December 2015/January 2016 (Round 1) and December 2016 (Round 2), focusing on the application intake, screening and validation processes: External Survey, for Applicants and Sponsors Internal Survey, for VDOT and DRPT staff, received 84 responses Internal workshop with VDPT/DRPT staff involved in SMART SCALE process Feedback helps us improve the process and better understand what worked and what didn t work As a result of the lessons learned, identify possible changes to the process and policy 138
139 Survey Results - Challenges Application Timing. Insufficient time given to complete all the required collaboration, application preparation, and submission Process Consistency. Changing rules, process, and guidelines as the process evolved Data & Documentation Collection. Significant data collection requirements for the pre-application and application, including information, documentation, site plans, etc. Time/Staffing Requirements. Time required for applicants to collect data and prepare application, travel and attend training sessions, and understand all SMART SCALE material on top of their daily work activities Economic Development Factor. Understanding the ED factor along with trying to estimate future economic benefit Jurisdictional Equity. Ability to compete against other jurisdictions that had other local funding sources 139
140 Survey Results - Successes VDOT/DRPT Staff Assistance. VDOT /DRPT staff praised for developing and implementing such a comprehensive process in such a short timeframe, and subsequent assistance and over-and-beyond helpfulness. SMART SCALE Outreach and Training. VDOT/DRPT staff lauded by applicants for provision and helpfulness during SMART SCALE outreach and training. Several District staff were specifically mentioned by applicants as being especially easy to work with, helpful, reassuring, and quick responding. SMART SCALE Online Application Tool. SMART SCALE Online Application Tool was user-friendly, making use of technology for ease of use, easy-to-follow, and the ability to save work and resume at a later time without losing data or time. SMART SCALE s Objectivity. Best part of SMART SCALE is its attempt to level the playing field in terms of transportation projects across the State. 140
141 Areas for Improvement Implementation Team Guidance and Information Sources Update and improve clarity of Policy Guide and FAQs Add tutorials and include example projects Pre-Application Training and Coordination Start coordination process early Develop Train the Trainer materials on process to ensure consistent guidance statewide Provide clear direction on application requirements, and ensure project readiness before proceeding with application Require completion of the pre-application form Validation/Screening Define criteria for meeting VTrans needs and project type eligibility Determine if project is eligible/meets a VTrans need before further development of application Evaluation and Scoring Provide better definitions of inputs such as mixed-use land use and economic development impacts Potentially consider tiers of projects based on size so that a turn lane project is not competing against a mega project 141

142 Recommendations to Improve Application Process Round 1 Update application tool to allow feedback during application submission (pre-screening and validation) Strongly encourage submission of information early Advance knowledge of the number and types of applications Notice of Intent to Apply - early screening decisions Over half the 321 submitted applications were created the final two weeks
143 Recommendations for Administrative Process Round 1 Project includes matching funds from other sources then documentation of availability of other funds will be required and commitment to fund if other sources do not become available If project cost at advertisement or award exceeds thresholds in SMART SCALE policy then project must be reevaluated (Rescoring) IF revised benefits/cost is higher than lowest scoring funded district project then project moves forward IF revised benefits/cost is lower then funds will be de-allocated unless CTB takes action to retain funding on project and address shortfall IF revised budget exceeds sliding scale CTB takes action to address shortfall Developed guidelines for reevaluation 143
144 Recommendations for Factor Areas Round 1 Environmental Factor Projects receiving significant amount of points without providing any other benefits Determine points by scaling environmental score based on impact to environment (current methodology) and benefits in other categories. Economic Development Site Support Types of projects evaluated do not influence growth over the same impact area In many localities zoning took place 30+ years ago and does not necessarily have relationship to current growth patterns Restrict the distance around certain types of projects where benefits may be considered buffers by project type Eliminate the extra scaling point for having zoning in place 144
145 Recommendations for Factor Areas Round 1 Reliability Buffer Time Index (BTI) comes from INRIX data does not provide statewide coverage For facilities where data does not exist, method pulls BTI from other nearby facilities this approach leads to questionable results on low volume roadways If INRIX BTI data does not exist, assume there is no reliability issue and score will be 0 Include scaling factor based on vehicle miles traveled to better scale the benefit testing underway Intermodal Access Questionable results when comparing measure scores to project types, specifically with using mainline tonnage Refine methodology to adjust tonnage for ramps 145
146 Recommendations for Factor Areas Round 1 Safety Fatal and Severe Injury crashes represent about 7% of total crashes Some fatal and severe injuries crashes are random and due to factors unrelated to roadway design Look at Fatal and All Injury crashes apply federal EPDO weighting Land Use Measure provides points based on projected future density but does not consider whether there is any growth between today and the future Base score on both future density and the change in density between today and the future 146
147 Modification for Scoring Process Corridor-based Transit Improvement Round 1 Transit Chicken/Egg problem all VRE platforms must be extended to add new rail cars to all trains, but only final platform extension would receive benefits under current methodology Example: Brooke and Leeland platform extensions by themselves do not allow for longer trains but without those improvements longer trains will never be able to run Analyze full corridor improvement (station + future capacity improvement) and assign benefit score on a pro-rata basis If station improvement is 10% of the cost, then we take 10% of the ultimate benefit $10,000,000 platform and station improvement that will facilitate a $90,000,000 future investment in rolling stock and service expansion. We would analyze full improvement, then take 10% of Total Benefit Score 147
148 Recommendations to Improve Application Process SMART SCALE on-line application tool undergoing improvements based on feedback Improved logic for applicant eligibility Improved logic for some factor areas (especially Economic Development) Online application tool will be expanded to include other funding programs: Revenue Sharing Program Transportation Alternatives Program Highway Safety Improvement Program Bicycle-Pedestrian Safety Program 148
149 Lessons Learned SMART SCALE Policy Round 2 Project Eligibility need to more clearly define in the Policy and Technical Guide project types that are not eligible for SMART SCALE this year there were a number of signal system projects and bridge projects that were in a gray area. Very frustrating for applicants. Economic Development Eligibility and rules regarding zoned-only properties More stringent documentation requirements Buffer logic possibility of limiting to linear buffer along facilities being improved Project Readiness clearer definition of project readiness Limited Access Roadways - new interchanges and modifications to existing IMR/ IJR with preferred alternative identified concurrence from FHWA on Interstate facilities Traffic Signal Warrants 149
150 Lessons Learned Application Process Round 2 Notice of Intent to Apply majority of respondents (82%) indicated the instructions were clear but challenges included uncertainty that it was required, change in deadline caused confusion, and did not receive confirmation that NOI had been received Submission Deadline majority of respondents (77%) said application period was long enough (up from 68%), 77% said applications are not submitted earlier in the submission period as data is still being acquired/ reviewed/updated Needed Revisions/Improvements to Sections of Application or Instructions VTrans Needs Description (50%), Factor Inputs Economic Development (40%), and Project Location Mapping (37%) 150
151 Applying what we learned Application Process Round 2 2-Step Application 1 st step similar to NOI basic information and project description Eligibility and screening (meet VTrans need) 2 nd step projects eligible and screened as meeting need proceed to fill out full application Move up deadline March 2018 open Portal to begin Round 3 applications August 1st submission deadline provides 5 months to conduct analysis and scoring Improve functionality of SMART Portal Improve mapping and VTrans needs components Ability to clone applications between grant programs 151
152 Lessons Learned Validation Process Round 2 Nature of Changes needed documentation for economic development, needed more detail on project description or revisions to project sketch, changes to project cost and schedule cost estimate had to be revised to match funding allocation schedule Needed Revisions/Improvements to Validation Process Improve data entry Streamline common fields Incorporate Validation Process/Tool into the SMART Portal 152

153 General Observations Scoring Round 2 Project planning/readiness Number of applications with little to no prior planning analysis or alternatives testing Planning critical to minimize project risks No planning raises question of public buy in to proposed improvement Project Description why is less important than what need clear project description Round 1 vs Round 2 Round 1 Round 2 Total Project $ $46,700,000 $27,000,000 Requested $ $25,700,000 $21,200,000 Benefit Score SMART SCALE Score
154 Look Back Weighting Frameworks Examined what would happen to staff recommended scenario from Round 2 if weighting frameworks were modified 2 categories urban (A and B combined), rural (C and D combined) 1 category congestion and safety 1 category safety and economic development 1 category all measures are weighted equal Factor Congestion Mitigation Economic Development Accessibility Safety Environmental Quality Land Use Category A 45% 5% 15% 5% 10% 20% Category B 15% 20% 25% 20% 10% 10% Category C 15% 25% 25% 25% 10% Category D 10% 35% 15% 30% 10% 154
155 Evaluation of Weighting Frameworks - Conclusions Major changes to weighting frameworks results in a 7-25% change in projects selected and a -3 to 4% change in project funding Modifications to Area Type C had minimal impact on number of projects selected in funding scenario; however, Area Type C received additional funding As determined previously, measures appear to have greater influence over whether a project is funded than weighting frameworks Currently, no proposed changes to weighting frameworks 155
156 Look Back Is there a bias in project size? The number of projects by size funded through SMART SCALE is in line with the number of projects by size funded in the FY06-11 Six-Year Improvement Program The amount of funding going to projects of a certain size funded through SMART SCALE is in line with the amount of funding going to projects of a certain size funded in the FY06-11 Six-Year Improvement Program <=$5,000,000 >$5,000,000 <$20,000,000 >=$20,000,000 FY2006 SYIP 10% 28% 62% Round 1* 11% 32% 57% Round 2 17% 24% 59% * Analysis excludes Transform
157 Look Back What types of projects are being funded through SMART SCALE? Round 1 92% of funding to Highways 8% of funding to Bike/Ped, Bus Transit, Rail Transit, and TDM Bus Transit projects most successful (100% funded) Rail Transit projects least successful (33% funded) Round 2 81% of funding to Highways 19% of funding to Bike/Ped, Bus Transit, Rail Transit, and TDM Rail Transit projects most successful (100% funded) Highway projects least successful (32% funded) 157
158 Proposed Changes to Administrative Policies and Procedures Biennial schedule Number of applications allowed per applicant Project readiness Project eligibility 158

159 Biennial Cycle 159