EMERGING TRENDS IN MARITIME TRANSPORT & PORT INFRASTRUCTURE DEVELOPMENT The Transport and ICT Global Practice Smart Connections for All
|
|
|
- Henry Singleton
- 5 years ago
- Views:
Transcription


1 EMERGING TRENDS IN MARITIME TRANSPORT & PORT INFRASTRUCTURE DEVELOPMENT The Transport and ICT Global Practice Smart Connections for All Biju Ninan Oommen Ports & Maritime Transport The World Bank 19 th May 2017
2 Agenda Current Scenario Emerging Trends Port Infra Developments Role for MDB s 1
: 2015 Source:")
3 International Seaborne Trade (million tonnes): 2015 Source: UNCTAD 2 10

4 DRY BULK FLEET PROFILE
5 DRY BULK FLEET PROFILE 05/2017 VLOC (FLEET: 208 ; ORDERBOOK: 60 VESSELS)

6 DRY BULK FLEET PROFILE (Capesize) (FLEET: 1,080 ; ORDERBOOK: 23 VESSELS) Length: 292 meters Draft: 18.2 meters Beam: 45 meters DWT: 130k - 200,000 tons Dry bulk cargoes Coal Grain Iron ore Bauxite / Alumina Phosphate Rock

7 DRY BULK FLEET PROFILE (Supramax) (FLEET: 1,987 ; ORDERBOOK: 29 VESSELS) Length:189 meters Draft: 13 meters Beam: 32.5 meters DWT: 50k - 60,000 tons Minor dry bulk cargoes Petroleum Coke Manganese Ore Salt, Sugar Tapioca, Agri products Steel, Cement

8 TANKER VESSELS: TYPES / CAPACITY

9 TANKER VESSELS: TYPES / CAPACITY

10 TANKER VESSELS: TYPES / CAPACITY
11

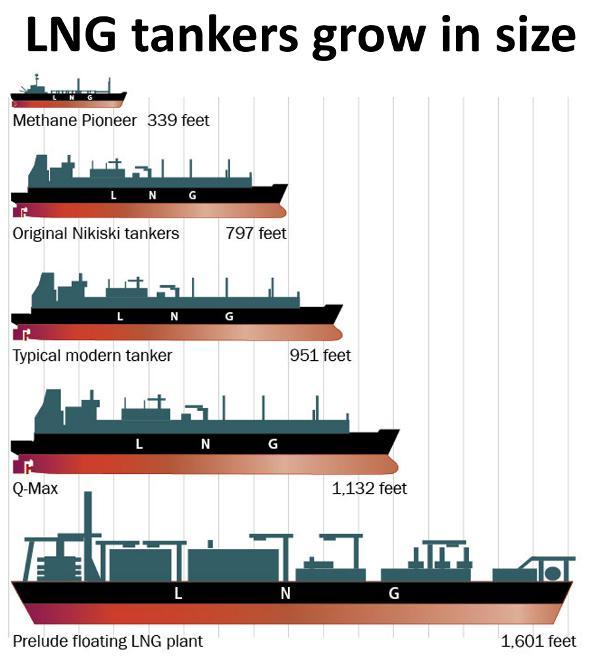
12 LNG VESSELS: TYPES / CAPACITY

13 12 Source: Drewry, IMF, World Bank analysis & estimates

14 CONTAINER SHIPS:
15 THE BIGGEST SHIPS: TYPES / CAPACITY TYPE OF SHIPS CAPACITY LENGTH (LOA) Meters WIDTH (BEAM) Meters DRAUGHT Meters OIL TANKERS - ULCC 320k - 500,000 DWT OIL TANKERS - VLCC 180k - 320,000 DWT DRY BULK - VALE MAX 400,000 DWT DRY BULK - VLOC 225k - 365,000 DWT CONTAINER - ULCV 200,000 DWT LNG - QMAX 130,200 DWT

16 PANAMA CANAL: 2017
 Source:")
17 Port Capacity (2015) vs Utilization (1H 2016) Source: Alphaliner 16 10


18 Limited port calls by mega ships, larger infra req at mega ports 17 Source: Maersk, CMA-CGM
19 Ports serving Ultra Large Container Vessels Major transshipment hub ports for Mega shipping alliance 2M (Maersk & MSC) Asia: China/Ningbo & Yantian; Malaysia/Tanjung Pelepas Europe: Netherland/Rotterdam, Germany/Bremerhaven, UK/Felixstowe & France/Le Havre 18 Source: Liner schedule analysis
20 Need for Port Infrastructure development in emerging economies Chronic port congestion Slow turnaround of vessels Over reliance on poorly maintained and congested roads / rail networks Poor connectivity to demand areas Shipments are to be trans-shipped through gateway ports in other countries 19 Ports & Waterborne Transport
21 Quality of Port Infrastructure Index & Global Competitiveness Rankings 2015 [2014] Country Port Infra Quality Index Overall Ranking Singapore [2] Malaysia [20] Korea, Rep [26] China [28] Thailand [31] Indonesia [34] Sri Lanka [73] Vietnam [68] India [71] Philippines [52] Lao PDR [93] Bangladesh [109] Pakistan [129] Myanmar [134] Total No Countries 140 [144] Source: World Economic Forum Statistics (Min 1.37 extremely underdeveloped, Max 6.77 extensive & efficient) 20 12


22 Significant Infrastructure Gap USD 8 trillion of investment in Asia (Source: ADB) Source: ADB USD 20 trillion up to 2030 (Global Infrastructure Initiative, G20) 21 10
23 Investments in Port Infrastructure Development: No: of Ports Total Investment (Billion USD) Total Port Projects 442 $ ppi.worldbank.org
24 Ongoing Container Port Infrastructure developments in Asia Mega ports Singapore (PPT 3 & 4) Malaysia Pelepas, Westports, Northport China - Port of Ningbo-Zhoushan Korea Busan Regional Gateway ports Indonesia ( Jakarta/Surabaya) Bangladesh (NCT 3&4) India (Nhava Sheva 4 th terminal) 23
25 Mega port connectivity: Key to harnessing scale economies Major transshipment port calls on 2M services between Asia-Europe Ningbo connects Japan/Osaka, Kobe, Nagoya, Tokyo Tanjung Pelepas connects South East Asia & Bay of Bengal ports Rotterdam gateway to the EU 24 Maersk/MSC schedule analysis
26 Port Infra for Connectivity at Mega ports Large investments in shore side infra STS/yard cranes, prime movers Reliable short sea feeder network to regional feeder ports - SIN/Malaysia connected with number of ports in SE Asia & South Asia Coastal Shipping network (feeding the hub) INDIA/Nhava Sheva Inland Water Transport network CHINA/Shanghai & Ningbo Multimodal connectivity to hinterland - waterways, rail and road network EU/Rotterdam-Duisberg ICT & port systems to deliver integrated services - processing flows from multiple corridors for larger transactions SIN 25 Presentation Title
27 Boosting Trade through development of Regional Gateway ports Gateway ports: primary role - maximize cargo generation thru connectivity to local, hinterland, far-inland, cross-border markets Larger port capacity to handle bigger vessels deployed due to cascade effect Inland ports extended gates Inland Water Transport network Multimodal - waterways, rail and road network Coastal Shipping network ICT: National platform logistics, freight transport, PCS 26 Presentation Title
28 Reading the signs Migration of volumes to new production centers & gateway ports E-commerce 27
29 The trends indicate Need to boost Regional & Inland Port Connectivity Infrastructure facilities at regional gateway ports Coastal Shipping network - feeder / inland ports Inland Water Transport River port development Multimodal connectivity: waterways & railways with road networks 28
30 The World Bank: Ports & Waterborne Transport sector Infrastructure Development National water ways India / Bangladesh Extended gates India (Kolkata) River Terminals China: Yichang (Hubei) Multimodal connectivity to hinterland Rail : Dedicated Freight corridor India/DFC, India/EDFC Waterways: China, Vietnam, India/NW1 & 2 Roads: Cambodia-Vietnam ICT & port systems to deliver integrated services - processing flows from multiple corridors for larger transactions 29
31 Private Participation in Infrastructure: No: of Ports Total Investment (Billion USD) Total Port Projects 442 $79.08 PPP projects 406 $74.57 MDB Supported 56 $12.84 Green Field 193 $ ppi.worldbank.org
32 Private participation in Port Infrastructure Development Project Investment (Million USD) Sponsors Capacity Type Type of PPI Contract period & method Debt Funding (Million USD) PSA Panama International Terminal - Phase 2 $ PSA Corp (100% /..) 2 Million TEUS Greenfield: BOT 20 years, Direct Negotiation $ Chabahar port development $ India Ports Global 250,000 TEUS Brownfield: Build Rehabilitate, Operate & Transfer 10 years $ Bharat Mumbai Container Terminals Private Limited $ PSA Corp (100% / Singapore) 4.8 Million TEUS Brownfield: Build 30 years, Competitive Rehabilitate, bidding Operate & Transfer $ Matarani Port $ Grupo Romero (100% / Mexico) 6 Million TEUS Brownfield: Build Rehabilitate, Operate & Transfer 30 years $ Karanja Terminal and Logistics Private 31 Limited $ Skil Ports & Logistics Limited (100% / India) Lighterage Greenfield: BOT 30 years, Direct Negotiation $78.70
33 Private participation in Port Infra Development with MDB loans Project Investment Sponsors Capacity Type Type of PPI Contract period & method MDB Loan (Debt Funding) Kingston Freeport Terminal Limited $437 M China Merchant Holdings (International) Co Ltd (49% /..), CMA-CGM (51% /..) 3.2 Million TEUS Brownfield: Build Rehabilitate, Operate & Transfer 30 years, Competitive bidding $175 M Manzanillo TEC II (Phase II) $345 M International Container Terminal Services Inc. (ICTSI) (100% /..) 1.4 Million TEUS Greenfield: BOT 34 years $260 M Tuxpan Container Terminal, Veracruz $370 M Stevedoring Services of America (SSA) Inc. (71% / United States) 0.9 Million TEUS Greenfield: BOT 20 years, Competitive bidding $75 M Puerto Quetzal Container Terminal $120 M Terminal de Contenidores de Barcelona (100% / Spain) 0.34 Million TEUS Greenfield: BLT 25 years, Competitive bidding $35 M Port Lafito $57 M Gilbert Bigio Group (100% / Haiti) 32 Presentation Title 70,000 TEUS Greenfield: BOO Channel dredging & Terminal $15 M


34 Overview of World Bank Group World Bank IBRD International Bank for Reconstruction and Development IDA International Development Association IFC International Finance Corporation MIGA Multilateral Investment and Guarantee Agency ICSID Int l Centre for Settlement of Investment Disputes Est Est Est Est Est Role To reduce poverty by boosting economic growth and reducing inequalities To reduce poverty by boosting economic growth and reducing inequalities To promote private sector development To reduce political investment risk for private sector investors To settle disputes by arbitration, conciliation or fact finding Clients Countries with per capita income between $1,045 and $12,736 Countries with per capita income of less than $1,045 Private companies and governments in member countries Foreign investors in member countries Governments and investors can use ICSID to settle disputes Products Technical Assistance Loans Policy Advice Technical assistance Loans/Grants Policy Advice Equity/Quasi-Equity Long-term Loans Advisory Services Political Risk Insurance Dispute Resolution Shared Mission: Reduce Poverty and Increase Prosperity 33 3
35 34 THANK YOU!