SIS Policy & Implementation
|
|
|
- Rose Horton
- 5 years ago
- Views:
Transcription


1 SIS Policy & Implementation Performance Planning & Programming (before it was cool) presented by Carl Mikyska, Florida MPO Advisory Council October 25, 2017
2 Strategic Intermodal System (SIS) Background SIS established in 2003 Enhance Florida s economic competitiveness Focus resources on facilities most critical for statewide and interregional travel Initial SIS designation criteria SIS facilities Two system components: SIS facilities, Emerging SIS facilities Types of facilities: hubs, corridors, connectors Comprise state s largest and most strategic air, space, water, rail, transit and highway facilities Primary means for moving people and freight
3 Brief History of the SIS 2000 Initial call for development of the SIS member Steering Committee defines policy framework 2003 Governor and Legislature establish the SIS and authorize designation of initial facilities as proposed 2004 Governor and Legislature enact framework for funding future SIS improvements; first projects funded 2005 Governor and Legislature provide recurring funding for SIS projects; first SIS Strategic Plan adopted 2010 SIS Strategic Plan updated 2016 SIS Policy Plan updated
4 Why Was the SIS Created? Help meet growing demand for moving people and freight Existing SIS Structure Link Florida s economic regions Enhance Florida s competitiveness as a global trade hub Make strategic choices for transportation investments within financial constraints SIS Emerging SIS Planned Add


5 Total SIS Designations SIS Airports: 20 SIS Spaceports: 2* SIS Seaports: 12* SIS Intermodal Logistic Center: 1* SIS Freight Terminals: 8* SIS Passenger Terminals: 20* SIS Urban Fixed Guideway Stations: 36* SIS Highway Miles: 4881* SIS Railroad Miles: 2325* SIS Waterway Miles: 1986* *Planned Add facilities included.
6 SIS Facilities Serve: 54 percent of all traffic and 70 percent of all truck traffic on the State Highway System although the highway portion of the SIS represents only 3 percent of the total road mileage in the state; More than 99 percent of all airport passengers enplanements in Florida, and 99 percent of originating and terminating air cargo tonnage; 99 percent of all waterborne freight tonnage and virtually all home-port cruise passengers; 89 percent of interregional rail and bus passengers; Nearly all freight moving via rail; and, All waterborne freight on coastal and intracoastal shipping routes and 66% of waterborne freight on inland interregional waterways.
7 How the SIS Stacks Up Florida Roadway Mileages (Rounded) Public Roads 122,400 Federal Aid 27,600 SHS 12,100 NHS 8,200 SIS 4,300 Freeways 2,200 Interstate 1,500
 Increasing Transportation Budgets $2 Billion Federal $12 Billion from all sources $82 Billion Annual State Budget")
8 Legislative Requirements of the SIS At least 50% of funding (policy set at 75%); 80% of Lane Miles Good or better (at 93%) 90% of Bridges Good or better (at 99%) Increasing Transportation Budgets $2 Billion Federal $12 Billion from all sources $82 Billion Annual State Budget
9 2016 Performance Summit Opening (May 10) Brian Blanchard Assistant Secretary FDOT Jim Wood State Transportation Planning Administrator Preservation (May 11) James Cromar Broward MPO Jim Warren Asphalt Contractors Association Chris Cochran Pinellas Suncoast Transit Authority Mobility (May 10) Beth Alden Hillsborough MPO Environment May 12) Chris Stahl Department of Environmental Protection Brad Thoburn Jacksonville Transportation Authority Sam Poole Urban Land Institute Michael Stewart Jacksonville Aviation Authority Julie Dudley FL Department of Health Economy (May 11) Mark Bontrager Space Florida Safety (May 12) James Hightower Department of Highway Safety and Motor Vehicles Tisha Keller Florida Trucking Association Steve Myers Lee Tran Natacha Yacinthe Port Everglades Don Scott Lee MPO 9
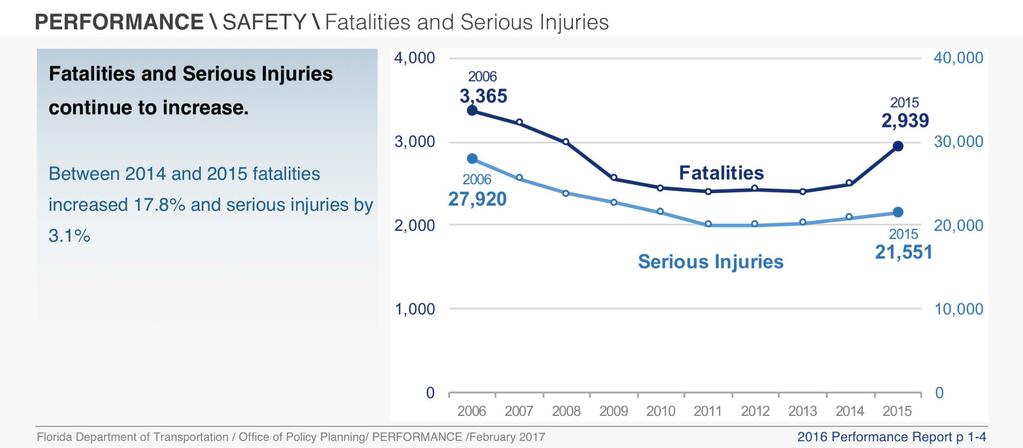
10 Safety
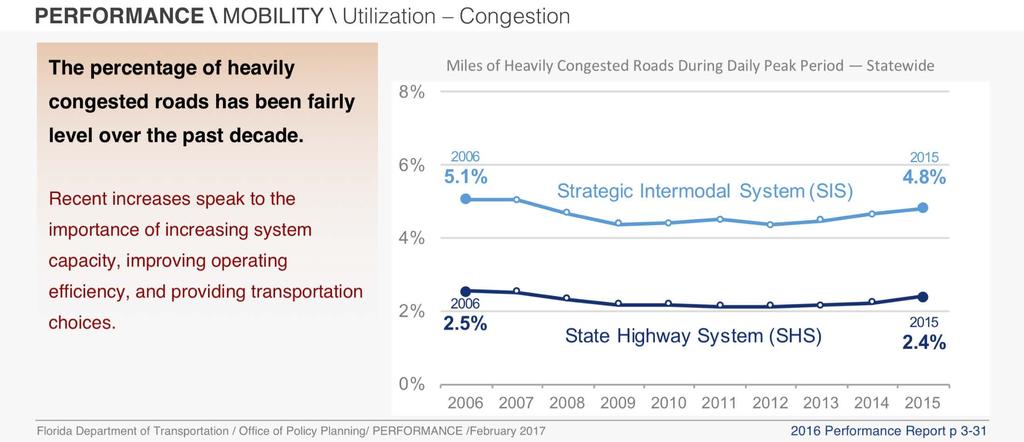
11 Mobility


12 Florida Performance Measures Workshops Collaboration Workshop Performance Measures 2016
13 Purpose of MPO Pilot Add data for 4 MPOs to FDOT statewide annual National Measures report for Florida Congressional Delegation: Part of FDOT s efforts to collaborate on PM with state s MPOs Review MPO-level performance results for FHWA measures Compare statewide trends to MPO level patterns Not intended to set targets; but consider implications for target setting Give MPOs the ability to tell the story of transportation

14 MPO Pilots Federal funds Total transportation budget Policy of maintenance first

15 FDOT s MAP-21 Measures Report 15
16 Daily VMT in Pilot MPOs (2015 State Highway System Vehicle Miles Traveled by MPO/TPO Boundary) Hillsborough Broward Gainesville Indian River 21 Million VMT 4% large trucks 27 Million VMT 4% large trucks 2.7 Million VMT 5% large trucks 1.6 Million VMT 4% large trucks
17 Pilot MPOs NHS Bridges Hillsborough Broward Gainesville Indian River (# of NHS bridges by MPO boundary) 9.7M 12.5M 0.5M 0.35M (Square footage of NHS bridge deck area by MPO boundary)
18 NHS Bridge Deck Area in Good Condition Gainesville Indian River Broward Statewide Hillsborough
19 Total Fatalities (Year-by-Year) (All Public Roads)


20 Peak Hour Travel Reliability (Freeways Inside MPO Boundary) Hillsborough Broward Gainesville Indian River Unreliable travel during peak hour For seven largest counties travel time reliability is defined as the percentage of freeway trips traveling at least 45 mph. For all others travel time reliability is defined as the percentage of freeway trips travelling at greater than or equal to 5 mph below the posted speed limit. 20

21 Peak Hour Truck Travel Reliability (Freeways Inside MPO Boundary) Hillsborough Broward Gainesville Indian River Unreliable travel during peak hour For seven largest counties travel time reliability is defined as the percentage of freeway trips traveling at least 45 mph. For all others travel time reliability is defined as the percentage of freeway trips travelling at greater than or equal to 5 mph below the posted speed limit. 21
22 Other FDOT Mobility Measures Daily Hours of Vehicle Delay ( 000s) (Freeways Inside MPO Boundary) Freight All Vehicles Hillsborough Broward Gainesville Indian River Delay is difference between threshold speed (LOS B) and travel time at average speed 22
 joint coordination with a common approach We (FDOT &")


23 Perceived Keys to Success in Florida FHWA Headquarters quote Our (FDOT/MPO) joint coordination with a common approach We (FDOT & MPOs) will comply with ultimate federal requirements FDOT/MPOs can use their own measures in performance-based planning Florida can use measures and calculation techniques most relevant to us Travel time reliability Congestion Multimodal Other Target establishment (conservative approach) FDOT/ MPOs submit consistently and together FDOT supply every MPO Federally required measures MPOAC agreed upon additional measures 23
24 Statewide Mobility Performance Measures Team Purpose To provide guidance and support to FDOT and the state s MPOs on multimodal mobility performance measures including reporting for internal and MAP-21 purposes Consensus in approach and measures 24

25 FDOT provides all MAP-21 measures FDOT s Intent For the state as a whole & each MPO Areawide groupings Urbanized boundaries Planning boundaries County boundaries Regional boundaries 25
 Keep the Feds out of our business ; set our internal targets to strive to do better Use our own existing performance based planning processes Highway and multimodal mobility performance measures")
26 Preliminary Recommendation (federal reporting requirements) for Map-21 Purposes Minimum Conservative Realistic Stretch Aspirational Allows FDOT and MPOs most flexibility to use our current/evolving ( ) Keep the Feds out of our business ; set our internal targets to strive to do better Use our own existing performance based planning processes Highway and multimodal mobility performance measures Allows more time to get our feet wet 26


27 Be careful of MAP21 System Performance and Freight Measures MAP-21 Multimodal Seattle 27
28 Mobility Performance Measures MPOs Would Like FDOT to Supply 28
 Urbanized Area MPO/TPO Boundaries County")
29 Networks Areas National Highway System Interstate SIS (Strategic Intermodal System) State Highway System Freeways Non-Freeways (SHS) Urbanized Area MPO/TPO Boundaries County Boundaries 29
 Average job accessibility (Transit) In 2018: Daily VMT Daily Truck miles traveled Travel Time Reliability Travel Time")
30 Primary and Secondary Measures Daily VMT Daily Truck miles traveled Travel Time Reliability Travel Time Variability Daily vehicle hours of delay Percent miles heavily congested Percent sidewalk coverage Percent bicycle lane coverage Average job accessibility (Auto) Average job accessibility (Transit) In 2018: Daily VMT Daily Truck miles traveled Travel Time Reliability Travel Time Variability Daily vehicle hours of delay Percent miles heavily congested Person miles traveled Truck Travel Time Reliability Average Travel Speed Percent of travel meeting LOS criteria 30

31 Sample Handout Infographics 31

32 Perceived Keys to Success in Florida FHWA Headquarters quote Our (FDOT/MPO) joint coordination with a common approach We (FDOT & MPOs) will comply with ultimate federal requirements FDOT/MPOs can use their own measures in performance-based planning Florida can use measures and calculation techniques most relevant to us Travel time reliability Congestion Multimodal Other Target establishment (conservative approach) FDOT supply every MPO Federally required measures MPOAC agreed upon additional measures 32