An Evidence-Based Approach for the Planning and Development of Transportation Investments
|
|
|
- Sabina Norman
- 5 years ago
- Views:
Transcription
1 An Evidence-Based Approach for the Planning and Development of Transportation Investments Michael J. Shiffer, Ph.D. Vice President, Planning & Policy TransLink November, 2011

2 TransLink and the Metro Vancouver Region We re Intermodal We Plan, Deliver & Operate We re Regional
 Property & Replacement Tax")
 Other $49m (4%) Parking")
3 TransLink and the Metro Vancouver Region 2010 BUDGETED REVENUE Fuel Tax $319m (28%) Property & Replacement Tax $289m (25%) Transit Fares $413m (36%) Total approx. $1,146 Million GEB Tolls $29m (3%) Other $49m (4%) Parking Sales Tax $47m (4%)
 $843m (69%)")
 Contingency $10m (1%) TransLink $45m (4%) Total Roads & Bridges")
4 Financial challenge TransLink and the Metro Vancouver Region 2010 BUDGETED EXPENDITURE Total Transit Operations (Bus, Rail) $843m (69%) Bus $625m (51%) Rail $218m (18%) Police $28m (2%) Debt Service $251m (20%) Contingency $10m (1%) TransLink $45m (4%) Total Roads & Bridges $48m (4%)


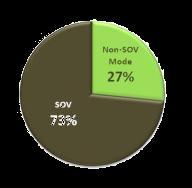
5 TransLink and the Metro Vancouver Region Journey-to-Work, 2006 Census
6 TransLink and the Metro Vancouver Region Metro Vancouver Annual Transit Ridership million transit trips Ridership increased 52% between 1998 and 2009 Population increased by 15% = 5 million transit trips million transit trips
7 Annual Transit Trips Per Capita Annual Transit Service Hours per Capita TransLink and the Metro Vancouver Region Annual Transit Trips per Capita & Transit Service Hours per Capita (2002 to 2010) Annual Transit Trips/Capita Transit Service Hours/Capita

8 TransLink and the Metro Vancouver Region

9 TransLink and the Metro Vancouver Region

10 TransLink and the Metro Vancouver Region Over 1 million more people by 2040

11 TransLink s Long Range Plan
12 Financial challenge Building the Asia-Pacific Gateway TransLink s Long Range Plan GOAL 1 - Greenhouse gas emissions aggressively reduced. GOAL 2 - Most trips are by transit, walking and cycling. GOAL 3 - Most jobs and housing located along frequent transit network. GOAL 4 - Traveling is safe, secure, and accessible for everyone. GOAL 5 - Economic growth and efficient goods movement are facilitated. GOAL 6 - Funding is stable, sufficient and influences choices.
13

14 2012 Supplemental Plan (Approved by Mayor s Council October 7, 2011)

15 Transport Benefits in the Moving Forward Investment Package


16 Benefit: 415,000 Hours of Service


17 Benefit: 9% Increase in Service Hours


18 Benefit: 10% Increase in Boardings


19 Benefit: Drop in Vehicle kms Travelled
20 Long Range Planning Agenda Achieve Sustainable Funding Maintain and Optimize the System Enhance Investment Integrate Land Use with Transport Encourage Sustainable Transportation Choices 20
21 Maintain and Optimize the System 21
22 Maintain and Optimize the System Buses serve as important data collection devices
23 Maintain and Optimize the System Automatic Passenger Counter (APC) equipped buses record passenger activity by stop, trip, time period, etc 23
24 Maintain and Optimize the System Area Transit Planning Program Key commitment from TransLink s founding Venue for municipal, stakeholder and public input into service provision by sub-region Identify a long term transit vision and ranked priorities for service and facility investments
25 Maintain and Optimize the System


26 Maintain and Optimize the System TRAVEL PATTERNS Vancouver UBC North Shore Burnaby New Westminster Northeast Sector Maple Ridge Pitt Meadows Richmond South of Fraser BOARDINGS DEMOGRAPHICS AND DEVELOPMENT

 Catchment FTN Local Stop")

27 Range of Services Frequent Transit Network Transit Service Type Examples FTN Limited Stop w/exclusive ROW Fixed Guideway Rapid Transit Lines Nodal Development 800M (half mile) Catchment FTN Limited Stop Limited Stop Bus Lines Nodal Development 600M (3 block) Catchment FTN Local Stop Trunk Line Frequent Bus Routes Linear Development 400M (2 block) Catchment Local Stop Local Bus Routes No Specific Development 400M (2 block) Catchment
28 Integrate Land use with Transport 28

29 Integrate Land use with Transport
30 Integrate Land use with Transport Frequent Transit Network (FTN) At least every 15 min throughout the day; 7 days/week Framework for a conversation around transit and land use coordination
31 Integrate Land use with Transport What are the Benefits? More cost-effective transit service Higher quality transit service Improved public realm & livability 31
32 Integrate Land use with Transport

33 Integrate Land use with Transport DRAFT
34 Integrate Land use with Transport Newton Exchange Transit Exchange Concept Transit Exchange incorporated into neighbourhood plan TransLink works in partnership with Cities and Municipalities to integrate transit and land use
35 Integrate Land use with Transport Plaza 88 Development, New Westminster
36 Integrate Land use with Transport 36
37 Encourage Sustainable Transportation Choices 37
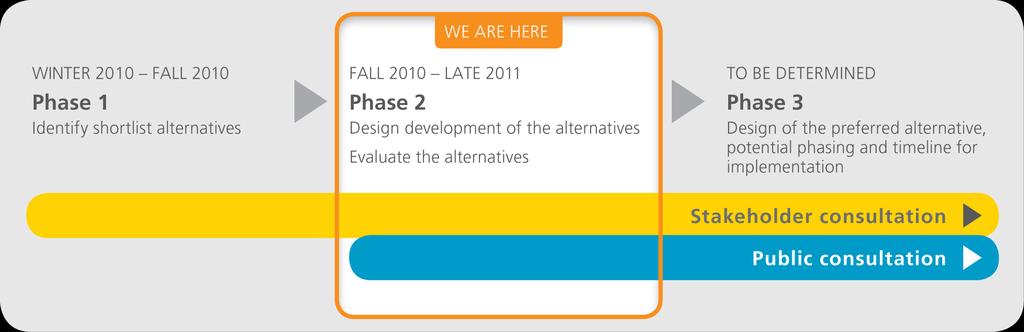
 Mode shifting Vision: A Goods Movement Strategy to guide future investments and initiatives.")
38 Encourage Sustainable Transportation Choices Guidance for the Region s Goods Movement Strategies and Initiatives Infrastructure Space allocation Technology solutions Network optimization Operational improvements (parking; hours-of-business; signal systems) Mode shifting Vision: A Goods Movement Strategy to guide future investments and initiatives. Strategy completion by Summer 2012


39 Encourage Sustainable Transportation Choices Coverage: Every MRN and highway corridor 24-7/365 Real time map display of speed ranges for customers Image courtesy of IBI Group Regional Traffic Data System Travel time information by clicking on road segment Significant benefits for truck traffic Vision: Real time average travel speed for every major route Data used to identify bottlenecks and target investments


40 Travelsmart.ca Encourage Sustainable Transportation Choices 40
41 Enhance Investment 41
42 Enhance Investment Maintaining Services State of Good Repair Upgrades Expansion Funding Stabilization Plan Supplemental Plans

43 Enhance Investment Multiple Account Evaluation for Rapid Transit Economic Development Environmental Financial Social and Community Transportation Urban Development Deliverability


44 Enhance Investment How will we Shape and Serve?
45 The Land Use & Transportation Connection

46


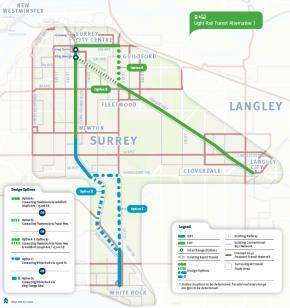
47 Surrey Study Design Concepts Bus Rapid Transit Light Rail Transit Rail Rapid Transit Best Bus


48 Bwy/UBC Study Design Concepts
49 Enhance Investment

50 Process
51 Rapid Transit Studies Program Strategic Network Review Expo Line Upgrade Strategy UBC Line Rapid Transit Study Surrey Rapid Transit Study Regional Rapid Transit Plan
52 Achieve Sustainable Funding 52
53 Achieve Sustainable Funding Preliminary Evaluation Framework Public Policy Encourage sustainable travel behaviour Encourage sustainable land use Encourage vehicle efficiency Address fairness concerns Financial Revenue potential Diversity of funding Stable, reliable revenue stream Implementation/Administration Public acceptance Administrative ease and efficiency Legislative or regulatory requirements
54 Long Range Planning Agenda Achieve Sustainable Funding Maintain and Optimize the System Enhance Investment Integrate Land Use with Transport Encourage Sustainable Transportation Choices 54
55 Concluding Thoughts
56 Continue the spirit of innovation and adaptability!
57 Thank you. Michael J. Shiffer, Ph.D. Vice President Planning & Policy TransLink

58 Commuting Patterns for Vancouver

59 Commuting Patterns for Surrey

60 Commuting Patterns for West Vancouver
61 Commuting Patterns for University Endowment Lands

62 Commuting Patterns for Burnaby

63 Commuting Patterns for Delta

64 Commuting Patterns for Maple Ridge
65 Commuting Patterns for Pitt Meadows

66 Commuting Patterns for White Rock

67 Commuting Patterns for Langley City

68 Commuting Patterns for Langley Township
69 Commuting Patterns for New Westminster

70 Commuting Patterns for Richmond

71 Commuting Patterns for District of North Vancouver

72 Commuting Patterns for City of North Vancouver
73 Commuting Patterns for Coquitlam

74 Commuting Patterns for Port Coquitlam

75 Commuting Patterns for Port Moody