final report WILMAPCO Regional Freight and Goods Movement Analysis WILMAPCO Cambridge Systematics, Inc. Global Insight, Inc.
|
|
|
- Brian Bruno McGee
- 5 years ago
- Views:
Transcription
1 WILMAPCO Regional Freight and Goods Movement Analysis final report prepared for WILMAPCO prepared by Cambridge Systematics, Inc. with Global Insight, Inc. September
2
3 Rd0.wmv Rd1.wmv Rd2.wmv Rd3.wmv final report WILMAPCO Regional Freight and Goods Movement Analysis prepared for WILMAPCO prepared by Cambridge Systematics, Inc Hampden Lane, Suite 800 Bethesda, Maryland with Global Insight, Inc. June 2007
4
5 Rd0.wmv Rd1.wmv Rd2.wmv Rd3.wmv Table of Contents 1.0 Introduction Motivation for Study The Importance of Freight Planning Developing an MPO Freight Planning Program Summary of Freight Studies WILMAPCO Area Studies Regional Studies National versus Regional Trends Profile of System Performance Land Use Consuming and Producing Industries Commodity Flow Patterns Traffic Volumes The Port of Wilmington Summary of Findings for Tasks 1, 2, and Identification of Potential Bottlenecks Future Recommendations Develop a Vision for Freight in the WIMAPCO Region Create a Methodology to Identify Issues and Disseminate Information Develop a Methodology for Prioritizing Freight Projects and Guiding Investments Establish a Realistic Funding Program to Implement the Freight Planning Program Maintain a Continuing Commitment to Freight Program Delivery Appendix Cambridge Systematics, Inc. i
6
7 Rd0.wmv Rd1.wmv Rd2.wmv Rd3.wmv Final Report WILMAPCO Regional Freight and Goods Movement Analysis 1.0 Introduction 1.1 Motivation for Study Due to its geography, the Wilmington Area Planning Council (WILMAPCO) region is a major thoroughfare for goods moving along the busy northeast corridor on Interstate 95 (I-95) and on the CSX Transportation (CSXT) and Norfolk Southern (NS) railroads. Much of this freight passes through on the interstates and rail lines to the major population centers in the Northeast, but a significant portion travels on local roads serving places like Harrisburg and the Delmarva Peninsula. The WILMAPCO region also is a significant producer and consumer of goods, with large traffic generators, such as the Port of Wilmington, located in New Castle County. This freight movement brings significant economic advantages to the region, but it also contributes to congestion, infrastructure deterioration, and air quality and safety issues. This study was initiated by WILMAPCO to examine freight as a system, focusing primarily on movements by truck and to a lesser degree by rail. 1 The purpose of this study is to report what is known about freight movement in the region for the current and future years 2005 and 2030, respectively; to identify potential deficiencies and bottlenecks in the freight system; and to recommend specific action items for WILMAPCO in response to the study findings. The project tasks include: Task 1 Purpose of Study, Importance of Freight Planning, and Building a Freight Planning Program; Task 2 Literature Review of Recent, Relevant Studies; Task 3 Current System Profile and Freight Forecasts; Task 4 Identification of Potential Gaps and Conflicts in Freight Network; and Task 5 Recommendations. 1 Air and waterborne movements will not be covered in this study. A rail summary is contained in Table 11 of the Appendix. Cambridge Systematics, Inc. 1
8 1.2 The Importance of Freight Planning Historically, planning for freight transportation was considered a private sector issue. There were some exceptions, such as Federal and state support for railroads, but this was largely done for job retention and not for transportation purposes. Freight planning has now attracted much public attention due to the continual rapid growth in demand for goods. Nationwide, freight has been growing at 2.5 percent to 3 percent per year, and is forecasted to continue this growth through at least This leads to a near doubling of freight volumes every 20 years. This is faster than the growth rates for passenger vehicles, leading to a higher percentage of heavy trucks on the roadways. As the share of heavy trucks increases, concerns regarding congestion, safety, and air pollution prompt the need for system improvements. Investments in transportation infrastructure to support goods movement have many local benefits. First, an efficient transportation network is critical in attracting and retaining businesses, which provide jobs and support economic development. Second, a strong and competitive freight network lowers logistics costs for inbound goods, ultimately benefiting area consumers. Consumers further benefit from more timely (e.g., just-intime) delivery of their goods. The public sector has also begun to pay more attention to freight planning thanks to the availability of Federal funding to support freight-related projects. Recognition of freight issues and programs supporting freight movement were greatly increased when the Federal government passed ISTEA in Programs were added and expanded under TEA-21, and more recently under SAFETEA-LU. Today there are several grant, loan, and tax credit programs available for funding freight transportation improvements. In addition to Federal and state interest, metropolitan planning organizations (MPO) also have become more involved in freight planning. The most frequent purposes and types of MPO involvement and studies include: Project Development/Design Especially identification of projects that benefit goods movement for inclusion in the Transportation Improvement Program (TIP); Long-Range Transportation Plans Developing a forecast and vision for goods movement for inclusion in the long-range plan; Modal Diversion Analysis Identification of the potential for diverting between transportation modes, most notably the diversion of heavy trucks to railroads; Pavement, Bridge, and Safety Management Identification of truck volumes to determine their impact on pavements and bridges, and to determine safety issues related to turning radii, sight distances, and other geometrical problems caused by trucks; Economic Development Targeting specific types of industrial development and identifying the type of transportation system needed to attract and retain that industry; 2 Cambridge Systematics, Inc.
9 Rd0.wmv Rd1.wmv Rd2.wmv Rd3.wmv Trade Corridor Studies Determining the most important trading partners and ensuring that efficient transportation corridors are in place to support the inbound and outbound flow of goods; Border Planning Providing an efficient and secure border crossing to support international trade 2 ; Rail Planning Developing public-private partnerships with the railroads to improve rail service and provide a competitive freight system; Bottleneck Analysis Determining the critical choke points in the freight transportation system 3 ; Business Location/Land Use Identifying the primary business locations to ensure that access routes can support the freight volumes; Truck Route Plans Identification of current and future truck routes in a region; Air Quality and Conformity Analysis For nonattainment areas, determining the current and future movement of trucks and trains to help identify air pollution from these sources 4 ; and Site Access Plans Determining traffic volumes into and out of freight facilities, to better support new development without placing additional burdens on the existing transportation system. 1.3 Developing an MPO Freight Planning Program There is no single reason why MPOs begin considering freight in their transportation planning process. Some reasons include addressing citizen concerns, supporting economic development, better understanding air quality issues, or mitigating roadway 2 Although the two WILMAPCO counties do not adjoin an international border, the Port of Wilmington in New Castle County serves as a major Mid-Atlantic import and export gateway for a variety of maritime cargoes and trade. 3 A key example of bottleneck analysis is contained in the identification of corridors for the WILMAPCO Congestion Management System (CMS) which used four performance measures to delineate congested corridors: volume/capacity, intersection level of service, percent under posted speed, and transit utilization. 4 The issue of air quality is pertinent since, as of January 2005, the geographic area which includes New Castle County has been termed the Philadelphia-Wilmington, PA-NJ-DE PM 2.5 Nonattainment Area for fine particulate matter, where the size of particles is less than 2.5 µm. Accordingly, WILMAPCO must determine that its 2025 Plan and its FY 2006 Transportation Improvement Program (TIP) conform to the transportation conformity rules for PM 2.5. Air quality was also one of six criteria used in the project prioritization process for the FY TIP. Cambridge Systematics, Inc. 3
10 congestion. Just as there is no single reason for becoming involved in freight planning, there is no best path for MPOs to follow when implementing a freight program. A recent study entitled Guidebook for Freight Policy, Planning, and Programming in Small- and Medium-Sized Metropolitan Areas identified one potential path for initiating a freight planning program within a MPO. 5 Step 1: Assign a Freight Lead or Point of Contact (POC) A freight technical lead should be designated within the MPO. This person will be the liaison between the MPO and the freight industry, between the MPO s various transportation initiatives, and between the MPO and other agencies and stakeholders. The time commitment of this position will be determined by the magnitude of the MPO s freight program. However, time commitments should be made in the MPO s Unified Planning Work Program (UPWP) on an annual basis. Step 2: Establish Goals and Objectives for Freight Program Freight goals and objectives should be developed as one of the first steps of a freight program. The goals and objectives will be refined as the freight program is developed. Step 3: Develop a Regional Freight Profile It is important to quantify the physical and operational characteristics of a region s freight system and supporting market forces. This should include the collection of qualitative and/or quantitative data from industry representatives through surveys and/or interviews. Step 4: Engage the Private Sector The private sector freight industry should be given the opportunity to contribute to the freight program development throughout the process. This should include informal outreach to stakeholders through interviews, surveys, workshops, and/or formalized inclusion through the formation of a freight steering or advisory committee. Step 5: Define Freight Issues/Needs/Deficiencies The region s freight issues, needs, and deficiencies should be identified based on a review of the physical and operational data provided in Step 3. In addition, data should be collected from the region s freight stakeholders (planners, carriers, shippers, manufacturers, and others) through partnership building activities conducted in Step 4. 5 Adapted from National Cooperative Highway Research Program Report #8-47, Guidebook for Freight Policy, Planning, and Programming in Small- and Medium-Sized Metropolitan Areas, Advanced Copy, December Cambridge Systematics, Inc.
11 Rd0.wmv Rd1.wmv Rd2.wmv Rd3.wmv Step 6: Key Decision Point Steps 1 through 5 provide a preliminary program direction, a description of the freight system, and an identification of the region s freight needs and deficiencies. At this point in the process, the MPO should review the results of the previous steps to determine appropriate next steps; specifically, what type of freight program is appropriate for the region. Some MPOs may find that all their freight issues are roadway-related and already are being addressed within their existing transportation program. Those MPOs should conduct Steps 1 through 6 on an annual basis as part of their general transportation planning activities. Other MPOs may have larger or more complicated issues that require a formal continuation of program development, which can be accomplished by undertaking Steps 7 through 14. Step 7: Refine Program Goals and Objectives The preliminary goals and objectives established in Step 2 should be reviewed to incorporate the specific type of the program identified in the Step 6 evaluation. Step 8: Develop Ongoing Freight Data Collection/Tool Development and Improvement Program The freight planning program must have an ongoing, reliable stream of data and information to drive the analyses that allow for project identification and evaluation. This is important even for those MPOs that may not be developing a full, comprehensive freight program using Steps 7 through 14. A data collection program can be as simple as collecting truck counts regularly, collecting information from freight stakeholders on key freight issues or bottlenecks, or updating port throughput numbers on an annual basis. Alternatively, it could be much more complicated, using truck trip diaries, commodity flow data purchases, or other techniques. Step 9: Establish Performance Measures Performance measures are necessary for the ongoing evaluation of how well the freight planning program is addressing its goals and objectives. Because data collection activities are a key component of performance measure development, this step should follow Step 8. In fact, based on the identified performance measures, staff should review the results of Step 8 to ensure the data collection program will provide all necessary data before advancing to Step 10. Step 10: Identify Freight Projects and Strategies of Regional Significance MPO staff should work with regional freight stakeholders to identify potential freight projects for inclusion in the MPO transportation program. These could be infrastructure projects or operational strategies, such as improved signage or truck network designations, identified to address the needs identified in Step 5 and the goals and objectives refined in Step 7. Cambridge Systematics, Inc. 5
12 Step 11: Develop Criteria with Which to Evaluate Freight Projects and Strategies The projects identified in Step 10 need to be ranked and prioritized before they can be integrated into the traditional transportation documents, including Long-Range Transportation Plans (LRTP), Transportation Improvement Programs (TIP), and Unified Planning Work Programs (UPWP). Freight-specific criteria should be developed to evaluate and rank these projects. These criteria should deal specifically with freight issues, however, ultimately they should be incorporated into existing MPO project evaluation and prioritization processes. Step 12: Integrate Freight Projects and Needs into Existing Planning Programs The ultimate goal of an integrated freight program is to successfully integrate freight needs and projects into the project development and implementation processes within an MPO. This is accomplished through the development of freight or intermodal elements of an LRTP, the programming of freight projects in a TIP, or a specific line item for a freight staff person in the UPWP. Step 13: Fund and Deploy Projects Project delivery helps to legitimize a freight planning program and energize the private sector. Deploying successful freight improvement projects also can maintain momentum for an MPO freight planning program. Step 14: Develop Process for Regular Update of the Freight Program Any freight planning program must be updated on a regular basis. Once integrated into the existing transportation program within an MPO, the freight planning program should be reevaluated to ensure that it is meeting the freight needs of the MPO. Steps 1 through 5 should be completed and coordinated with every LRTP update to ensure the project development, selection, and ranking activities take place in a timely manner to be incorporated into the LRTP. Regular completion of these initial steps will help freight planning programs evolve and continue to meet the needs of metropolitan areas. 6 Cambridge Systematics, Inc.
13 Rd0.wmv Rd1.wmv Rd2.wmv Rd3.wmv 2.0 Summary of Freight Studies 2.1 WILMAPCO Area Studies Maryland DOT, Maryland Multimodal Freight Profile, 2005 (Prepared by Cambridge Systematics) The Maryland Multimodal Freight Profile was developed to address the goals of the 2001 Maryland Freight Mobility Plan. The report presented the current (2003) and anticipated (2030) flows by mode, commodity, and direction. It also discussed the characteristics and locations of freight-generating businesses by county, including transportation-related competitiveness issues. The major findings for the study were as follows: About 661 million tons of freight was transported into, out of, within, and through Maryland in 2003, accounting for approximately $431.8 billion in combined truck and rail value. By 2030, the overall tonnage was estimated to increase by about 75 percent, comprising about 1.2 billion tons and $959.2 billion of value (an increase of 122 percent over 2003 value). By weight, Maryland is decidedly a through state. More than half (about 53 percent) of the 660 million tons of freight in Maryland in 2003 was comprised of through movements, which do not originate or terminate in any of its 24 counties. In base (2003) and future (2030) years, about one-fifth or 20 percent of tonnage was attributable to inbound movements, while a smaller share (about 15 percent and 16 percent in 2003 and 2030, respectively) was attributable to outbound movements. The smallest share 9 percent in 2003, and 10 percent in 2030 constituted intrastate moves within Maryland. The share of total value attributable to through movements was considerably less than its share by weight, comprising about 29 percent of total value in The shares of inbound, outbound, and intrastate value as a percent of total value were much higher than comparable shares by weight, accounting for 32 percent, 24 percent, and 15 percent, respectively. Inbound flows had the largest share of total value, and were slightly larger (by about 3 percent) than through flows, which ranked second. Cambridge Systematics, Inc. 7
14 The top truck commodities for inbound, outbound, and intrastate moves in 2003 and 2030 in terms of truckloads were nonmetallic minerals (23 percent of the total); clay, concrete, glass, or stone (16 percent of total); and secondary traffic (16 percent of the total). 6 In 2003, the top rail commodity by weight was coal (40 percent), followed by nonmetallic minerals (11 percent), primary metal products (slightly more than 6 percent), and waste or scrap materials (6 percent) Delaware DOT, Delaware Freight and Goods Movement Plan, 2003 (Prepared by Parsons Transportation) The Delaware Freight and Goods Movement Plan provided a specific plan of action for DelDOT s implementation of the Statewide Long-Range Transportation Plan, which is used to plan strategies and investments through the year The Delaware Freight and Goods Movement Plan defined actions and investments that DelDOT should make to improve the movement of freight in Delaware. The Plan was developed within a framework of three goals set forth in DelDOT s Statewide Long-Range Transportation Plan. These goals guiding freight planning and investment are: Provide a safe freight transportation system that sustains or improves existing levels of freight access and mobility; Support the State s economic well-being, while remaining sensitive to environmental needs and concerns; and Achieve efficiency in operations and investments in the freight transportation system. Specific strategies and investments set forth in the plan for truck and rail traffic include: Motor-Carrier Freight Improvements 1. Classify roads according to their ability to safely accommodate vehicles of various sizes and weights, sign and enforce restrictions on roads with severe safety and operating constraints, and map the system for broad distribution to the public and trucking industry; 2. Identify communities where bypasses may be warranted because of through truck movements and initiate project planning studies; 3. Develop a plan to improve truck access and operations in the vicinity of the Port of Wilmington; 6 Secondary traffic is the movement of goods from a warehouse (or distribution center) to its final destination, or from a warehouse to another warehouse. This is in contrast to the primary movement of goods from a manufacturing facility to a final or intermediate location. Due to the growth in warehousing, secondary traffic is the fastest growing segment of the freight market. 8 Cambridge Systematics, Inc.
15 Rd0.wmv Rd1.wmv Rd2.wmv Rd3.wmv 4. Review roadway and intersection design criteria and standards with representatives of the trucking industry to consider modifications to facilitate truck operations, especially in major truck corridors; 5. Expand the statewide deployment of joint weigh-in-motion (WIM) and traffic counting stations, and ensure the provision of safe roadside enforcement areas for each facility; 6. Expand Intelligent Traffic Management System (ITMS) traveler-information services to improve the availability of timely data on traffic conditions to truckers; 7. Develop truck rest areas to address problems of driver fatigue; and 8. Implement electronic registration and credentialing of commercial vehicles and sharing of credentialing information with other states and Delaware enforcement personnel. Proposed Rail and Intermodal Freight Improvements Develop a new track on the Northeast Corridor (NEC) between Newark, Delaware, and Perryville, Maryland, to be used primarily for freight; Restore the Christina River movable rail bridge and Shellpot Secondary operations, including direct, head-on access to the Port of Wilmington 7 ; Develop a freight-only track on the NEC between Edgemoor, Delaware, and Marcus Hook, Pennsylvania, connecting to the freight-only Chester Secondary and the Conrail Philadelphia/South Jersey Shared Asset Area; Expand the operational function and capacity of the Edgemoor Yard to accommodate general merchandise, through-train service on the NEC; Prepare a Delmarva rail service contingency plan; Improve the rail interchange in Wilmington to allow CSXT better access to the Port of Wilmington or encourage NS and CSXT to negotiate more efficient handling of interchange traffic; Develop an intermodal terminal in Delaware; Improve the rail interchange between the NS and the Maryland and Delaware (MD, DE) rail lines at Frankford, Delaware; and 7 Several of the reviewed studies recommend repairing and reopening the Shellpot Bridge. This has happened, but the studies are summarized as stated. Cambridge Systematics, Inc. 9
16 Work with the poultry industry to achieve efficiencies associated with 75-car unit grain trains at feed mills, including rail car siding length requirements Maryland DOT, Maryland Freight Mobility Plan, 2001 (Prepared by Cambridge Systematics) The 2001 Maryland Freight Mobility Plan reflected the initial effort on the part of the Maryland DOT to survey the range of freight planning needs of the State on a broad level. The Plan was comprised of an assessment of the freight system, including economic considerations affecting the demand for freight transportation services, the regulatory environment within which freight planning is done, and an inventory of freight facilities that focused on identifying bottlenecks and constraints within the freight transport network. The report also contained an Action Plan that included a set of short- and long-term freight initiatives to support implementation strategies that the State should consider when it wished to enhance its freight planning process. The identified strategies included: Managing truck freight movement; Pursuing the strategic growth of rail; Pursuing the strategic growth of waterborne commerce; Pursuing the strategic growth of air freight; Enhancing freight planning activities; and Preserving state-owned freight infrastructure. The supporting initiatives were classified into the following categories: Infrastructure; Operations; Regulatory/policy; or Financing initiatives Delaware DOT, Delaware Freight Rail Plan, 2000 (Prepared by Parsons Transportation Group) The 2000 Delaware Freight Rail Plan established goals and set a direction for rail transportation policy, planning, and investment in the State through the year The Plan stated that Delaware s rail infrastructure is an underused resource in reducing highway traffic congestion for both freight and passenger movement and in supporting the economy of the State of Delaware. Key rail network issues included: Rail access to industries and the entire Delmarva Peninsula has become difficult as passenger service increases on the Northeast Corridor (NEC). 10 Cambridge Systematics, Inc.
17 Rd0.wmv Rd1.wmv Rd2.wmv Rd3.wmv The hours that freight trains can operate on the NEC will become further compressed as more and faster intercity passenger trains and commuter trains use the track. The rail network in Delaware has lost a major element of its connectivity and operating flexibility with the loss of the Shellpot Secondary through Edgemoor Yard. All rail traffic to the Delmarva Peninsula must utilize the NEC, with only very small exceptions. The nearest intermodal terminals for trailers and container are in Philadelphia, Harrisburg, and Baltimore. Rail service to the Delmarva Peninsula consists of a series of slow local trains, with the exception of coal, and occasional grain, unit trains Wilmington-Harrisburg Freight Study, 2002 (Prepared by Wilbur Smith, Reebie, and Martin Associates) The Wilmington-Harrisburg Freight Study addressed the issue of increasing truck and intermodal freight traffic along the Corridor between the Port of Wilmington and Philadelphia and the Harrisburg/Carlisle area, with special attention to trucks passing through the region. The principal routes involved were Delaware and Pennsylvania 41, U.S. 30, and PA 283. The first phase of the study described the existing conditions and base-level freight traffic in the Corridor. Phase two identified planned enhancements along the Corridor and developed forecasts of freight volumes for 2010 and The final phase developed four scenarios, outlining strategies for more efficient and safe movement of freight along the Corridor. These scenarios were: Railroad Scenario Explored the extent to which investment in the railroad system could provide a more efficient transportation network in the Corridor. A specific recommendation was to explore a Norfolk Southern Triple Crown yard in Newark to divert some of the truck drayage moves into Delaware from the intermodal yards in Harrisburg. 8 Shipper Scenario Discussed the supply chain patterns of key shippers in an effort to identify potential strategies for improved freight flow. This included warehouse locations, off-peak deliveries, alternative routings, and alternative modes. Combination of Proposed Local Roadway Improvements Explored the combination of proposed roadway improvements along the Corridor to determine their impact on freight movements. The proposals ranged from bypasses to improve freight flow to traffic calming to impede freight flow. 8 Drayage is the short distance truck portion of an intermodal shipment that moves long distance by air or rail. The drayage movement takes place between the shipper or receiver and the intermodal terminal. Cambridge Systematics, Inc. 11
18 Pennsylvania Turnpike Scenario Explored strategies to entice through truck traffic to use the Pennsylvania Turnpike, rather than the Corridor. A value pricing study identified only a very small percentage of trucks that would divert to the longer, tolled route of the Pennsylvania Turnpike. One of the key early findings of the study was that two-thirds of the trucks using the study Corridor were serving originations and/or terminations along the Corridor. Another misperception was the amount of through traffic generated by the ports, which in actuality amounted to less than 10 percent of the total trucks. Forecasts of freight traffic growth along the Corridor ranged from a low growth scenario of 39 percent to a high growth scenario of 67 percent between 2000 and Wilmington Area Planning Council, Freight Movement and Visitor Travel Programs, 1997 (Prepared by Hickling Lewis Brod) Technical Memorandum 1 to this report provided an inventory and discussion of the Wilmington area s economic, transportation, and land use assets. Technical Memorandum 2 identified potential conflicts between the policies and projects within the region. The agencies and organizations included in the review were: WILMAPCO; City of Wilmington; City of Newark; City of Elkton; Cecil County; New Castle County; Delaware Economic Development Office (DEDO); State of Maryland; Delaware River and Bridge Authority (DRBA); and Port of Wilmington. The policy review revealed the following conclusions: Unlike WILMAPCO, most agencies lacked a document clearly articulating their policies. Economic development goals for the region and the related policies were largely in agreement (in support of economic growth). Some distinctions appeared in the proposed strategies. WILMAPCO, Cecil County, and New Castle County called for development within the existing industry base. It was acknowledged that there may be conflicts with DEDO s development goals and WILMAPCO land use policies. Transportation investment plans sought to actively preserve green space and focus investment on brownfields. Freight transportation investment plans took advantage of the region s strategic geographic proximity to the major East Coast transportation corridors. Land use policies tried to curb urban sprawl in the area. While plans called for separation of residential and commercial development, there was a trend towards accepting mixed-use development. 12 Cambridge Systematics, Inc.
19 Rd0.wmv Rd1.wmv Rd2.wmv Rd3.wmv The region s potential as a major attraction to business travelers and tourists was not adequately reflected in its policies and plans. From a freight transportation perspective: 9 Road maintenance and resurfacing investments were required on several important highway freight routes. Highway access to the New Castle County Airport was restrictive to freight movements. There were weight limits and train length limits on freight rail lines, especially south of Delaware. Rail access to the Port of Wilmington was very limited in capacity. The region did not possess adequate intermodal freight transfer facilities. In particular, there was a need for bulk and intermodal transfer facilities at the port. 2.2 Regional Studies South Central Pennsylvania Regional Goods Movement Study, 2006 (Prepared by Cambridge Systematics, Inc., Global Insight, PB Farradyne, and A. Strauss-Wieder, Inc.) The South Central Pennsylvania Regional Goods Movement Study (SCPA-RGMS) is an ongoing multijurisdictional effort involving four MPOs (HATS, Lancaster, Lebanon, and York), one RPO (Adams), Franklin County, and the Pennsylvania DOT. The study was motivated by several issues, including: An improved understanding of how growth in freight movement impacts the economically and environmentally connected South Central Pennsylvania Region; Exploration of the linkages between freight movement, land use, and economic growth; Development of goals, strategies, and recommendations that are consistent and equitable across the region; Dissemination of the benefits, costs, and issues of freight movement to politicians, stakeholders, and the general public; and Enhancement of the ability to continue future freight planning efforts. 9 This report was developed prior to the CSX and NS acquisition of Conrail. It was also developed prior to the investment in the Shellpot Bridge to improve NS access to the Port of Wilmington. Cambridge Systematics, Inc. 13
20 To address those issues, the study was organized around three primary goals: 1) the development of essential freight data for the region; 2) identification of the critical issues related to goods movement in the region and possible strategies; and 3) to disseminate results and garner feedback through outreach meetings and create an effective and enduring public-private partnership forum to continue the efforts of the study. While the study has still not been finalized, some key findings include: In 2003, goods valued at nearly $1.3 trillion flowed to, from, and through the eight counties comprising South Central Pennsylvania; About 69 percent of truck traffic passed through the region (not serving local businesses), while 14 percent of tonnage was consumed in the region and about 17 percent was produced in the region; Trucks handled 88 percent of the tonnage, rail handled 12 percent, and air cargo had a negligible, yet important, amount of total tonnage; South Central Pennsylvania is very attractive as a staging area for goods movement throughout the Northeast, and the rapid growth in warehouse and distribution space offers an opportunity to take economic advantage of the strategic location; Forecasts of goods movements through the year 2030 project an increase of 79.5 percent for truck tonnage (2.2 percent annual increase) and 53.8 percent for rail tonnage (1.6 percent annual increase); The percentage of truck trips passing through the region is forecasted to increase 2.1 percent (from 58.1 percent to 60.2 percent) between 2003 and 2030; and Additional warehousing space in the region could help convert a portion of the truck through trips to inbound-outbound trips and thereby capture the jobs and economic benefits from this transient freight traffic. In conclusion, the study called for an establishment of a Goods Movement Forum to bring together key public and private sector stakeholders to address goods movement issues in South Central Pennsylvania. The Forum was envisioned to facilitate dialogue among stakeholders; balance competing goals with expanded consideration of freight in transportation planning; educate key players regarding goods movement issues and benefits; identify issues, solutions, and funding sources for freight projects that have local, regional, and national significance; and to establish a funding structure that allows fasttracking of priority freight projects in the region Maryland Transportation Authority, Bay/Nice Bridge Feasibility Study, 2004 In August and October 2001, the Maryland Transportation Authority (MdTA) conducted initial origin-destination studies of the toll direction of two bridge facilities for use in the development of a sketch-level travel demand model. The facilities under study were the William Preston Lane Jr. Memorial (Bay) Bridge and the Governor Harry W. Nice 14 Cambridge Systematics, Inc.
21 Rd0.wmv Rd1.wmv Rd2.wmv Rd3.wmv Memorial (Nice) Bridge. After the culmination of these studies, concerns were raised regarding the validity of using data collected on a single day (a weekend day in August and a weekday in October), in one direction of a two-directional facility, as representative of both directions, and for use as representative of an average day. In April 2004, follow-up studies evaluated factors such as origin and destination location, origin and destination type, vehicle type, and number of occupants. The studies confirmed that the sample collected in October 2001 was representative of an average weekday, and that data collected in the toll direction of travel could be used to reasonably represent travel patterns in both directions of travel. Additional information from the April 2004 data collection effort is provided below. At the eastbound Bay Bridge: About 22 percent of respondents (reflecting 15 percent of total distributed surveys) marked Anne Arundel County to Queen Anne s County as the predominant origindestination pair; Approximately 88 percent of the trips across the Bay Bridge had both an origin and a destination within Maryland; The most common trip was between work and home, reflecting 34 percent of surveyed trips; and About 35 percent of drivers were driving alone. At the southbound Nice Bridge: About 20 percent of respondents (reflecting 14 percent of total distributed surveys) marked Charles County to King George/Dahlgren as the most predominant origindestination pair; and The most common trip was between work and home, reflecting 43 percent of surveyed trips. At the northbound Nice Bridge: About 28 percent of respondents (reflecting 16 percent of total distributed surveys) marked King George/Dahlgren to Charles County as the predominant origindestination pair; and The most common trip was between work and home, reflecting 53 percent of surveyed trips. Also, about 39 percent of drivers were driving alone. Cambridge Systematics, Inc. 15
22 2.2.4 I-95 Corridor Coalition, Mid Atlantic Rail Operations Study, 2002 (Prepared by Cambridge Systematics) The Mid-Atlantic Rail Operations Study (MAROps) was a joint initiative of the I-95 Corridor Coalition, five member states (New Jersey, Pennsylvania, Delaware, Maryland, and Virginia), and three railroads (Amtrak, CSX, and Norfolk Southern). In addition, the Federal Railroad Administration (FRA) and the Federal Highway Administration (FHWA) participated as advisors. Over the two-year period from 2002 to 2004, the MAROps participants crafted a 20-year, $6.2 billion program of rail improvements aimed at improving northsouth rail transportation for both passengers and freight in the Mid-Atlantic region and helping reduce truck traffic on the region s overburdened highway system. The MAROps Report and Appendices documented existing conditions (including demographics, economic conditions, transportation facilities, passenger and freight flows, etc.) and defined a three-phased program of improvements to eliminate key rail choke points across the five-state study region. The Report also presented order-of-magnitude cost estimates for the projects. The projects identified in Delaware are contained in Table 1. Table 1. Delaware Freight Rail Choke Points as Identified in MAROps Thousands in Year-of-Expenditure Dollars Railroad Project Location Project Description Total Cost Timeframe CSXT Silverside to Eder Provide clearance for high stack cars $5, years. NS Wilmington-Newark, Port of Wilmington Shellpot Bridge 10, years. NS Perryville to Ragan Interlocking Add a freight only track for daytime 135, years. operations CSXT Delaware 2 nd Main Track Project Construct a second main freight track 57, years. NS Newark Station Relocation Relocate passenger station to allow 10, years. additional freight line NS Wilmington Track Improvements Reconfigure track and interlockings, upgrade overhead track structures to allow additional freight trains on track operated by Amtrak and SEPTA 35, years. Total $252,600 * The MAROps Report projects these capital costs in 2002 constant dollars. The MAROps study also made an initial attempt at defining the public benefits accruing from the $6.2 billion investment. A total of $18 billion in public benefits were identified in reduced highway delays, reduced highway maintenance costs, improved safety, improved environmental costs, and lower logistics costs. The success of the MAROps project lead to the New England Rail Operations Study (NEROps) and the South Eastern Rail Operations Study (SEROps). MAROps II is planned to further identify the choke points and to establish public benefits by state. 16 Cambridge Systematics, Inc.
23 Rd0.wmv Rd1.wmv Rd2.wmv Rd3.wmv 2.3 National versus Regional Trends The TRANSEARCH database, which is the primary data source for the commodity flow summaries in this study, is distinctive from other data sources in supporting analysis on a substate (i.e., region, county, or even zip code) level, typically for all directions and modes, using the Standard Transportation Commodity Classification (STCC) system. For this reason, comparisons between the more disaggregated data contained in TRANSEARCH and other, more aggregate-level (such as state-level) datasets are often difficult to make in true apples-to-apples fashion, due to factors such as: differences in the geographical units of analysis (e.g., county-level versus state-level reporting), inconsistency in the year of reporting (e.g., the U.S. Census Bureau Commodity Flow Survey, or CFS, is only reported every five years or so), differences in direction of reported flows (e.g., through tonnage is rarely reported in other datasets), definitional variations of reported movements (e.g., origins or destinations often include internal moves whereas, in a TRANSEARCH analysis, these moves are typically reported separately), and the commodity classification system used to report tonnage (e.g., STCC versus SCTG codes). Consequently, the comparisons presented here between the WILMAPCO data and other datasets in order to gauge how the region stacks up against other states and the nation as a whole should be interpreted with a bit of caution since direct comparisons were not possible. Instead, the best available data was used to provide a context and present an order-of-magnitude picture of this two-county region. With this caveat in mind, Table 2 presents the 2002 Freight Analysis Framework (FAF2) total truck tonnage for the nation as a whole by 2002 domestic tonnage (irrespective of direction), as well as 2002 total truck tonnage for each of the two relevant states Maryland and Delaware by direction. Starting at the most aggregate level, the total domestic truck tonnage for both states combined (about 332 million) comprises slightly less than three percent of the nationwide total of 11.3 billion a very small amount. Tonnage for the WILMAPCO region can then be related to the combined state totals, although the years of reported data vary for the two states and for the WILMAPCO region. Specifically, the WILMAPCO data is for 2005, while Maryland, Delaware, and the nation use 2002 data. Nevertheless, roughly the WILMAPCO region s share of Maryland and Delaware total truck tonnage measures about 19 percent. Its share of Maryland and Delaware s total internal truck tonnage is nearly insignificant (less than 1 percent). Its share of outbound Maryland and Delaware truck tonnage is the largest by far, measuring 46 percent. Lastly, its share of inbound Maryland and Delaware truck tonnage is a considerably lesser 25 percent. Cambridge Systematics, Inc. 17
24 Table 2. WILMAPCO Region in the Context of National and State Trends Truck Tonnage Only Data Year Geography Domestic Truck Tons (Millions) Internal (State/Regional) Outbound Inbound Total Truck Tons (Millions) 2002 U.S. 11, , Maryland Delaware Total Maryland + Delaware New Castle County Cecil County WILMAPCO Region* Summary: New Castle County total truck tons = 76 percent of total Delaware truck tons Cecil County total truck tons = 4 percent of total MD truck tons Maryland + Delaware total truck tons = 2.9 percent of total U.S. truck tons WILMAPCO Region share of Maryland + Delaware total truck tons = 19 percent - As a share of intra Maryland + Delaware truck tons = <1 percent - As a share of outbound Maryland + Delaware truck tons = 46 percent - As a share of inbound Maryland + Delaware truck tons = 25 percent Source: Freight Analysis Framework FAF2 data (2002) and Global Insight TRANSEARCH (2005) data, Note: Totals for WILMAPCO Region may vary from the two individual counties due to rounding. Table 3 relates 2005 WILMAPCO truck tonnage to the 2002 U.S. Census Commodity Flow Survey, which only reports flows for the United States and individual states. In the case of individual states, the CFS reports flows from the state of origin, referring to both outbound and internal moves. As shown in the summary, the WILMAPCO share of originating truck tonnage of the comprising states Maryland and Delaware is about 21 percent which is overall much lower using this source than the Freight Analysis Framework (FAF2) above. These differences highlight the variations in survey methodologies of such sources. Moreover, they confirm that any comparisons with the TRANSEARCH data are merely rough comparisons to give relative magnitude, not precise calculations of variance. 18 Cambridge Systematics, Inc.
25 Rd0.wmv Rd1.wmv Rd2.wmv Rd3.wmv Table 3. Comparison of WILMAPCO Region, Comprising States, and U.S. Originating Truck Tonnage Tonnage WILMAPCO Region Comprising States (Maryland and Delaware) WILMAPCO Share of Comprising States All U.S. WILMAPCO Share of All U.S. Originating Truck Tons (i.e., Outbound and Internal) 37,291, ,406, % 7,842,836, % Source: TRANSEARCH 2005 (WILMAPCO data) and U.S. Census Bureau Commodity Flow Survey 2002 (State and National data). 3.0 Profile of System Performance 3.1 Land Use Current and Future Patterns for Cecil County Cecil County, Maryland is a predominantly rural county, with a land area of 348 square miles. It contains eight incorporated municipalities: Cecilton, Charlestown, Chesapeake City, Elkton, North East, Perryville, Port Deposit, and Rising Sun. Elkton, the county seat, is by far the largest of the municipalities with a population of 11, Most of the county s municipalities are situated on the Chesapeake Bay, with the exception of two towns, Cecilton and Rising Sun. Chesapeake City is located on the 40-foot channel Chesapeake & Delaware (C&D) Canal that bisects the county and links the Chesapeake Bay to the Delaware River. 11 A number of highways and rail lines connect the county s municipalities. The most prominent and heavily used of the highways is I-95. I-95 connects Elkton, in the east, with Perryville, to the west, skirting the city boundaries of each municipality. U.S. 40 is the 10 U.S.Census Bureau; State and County Quick Facts. states/24/24015.html. 11 WILMAPCO Map: Municipalities and Highways in the WILMAPCO Region; and_highways.pdf. Cambridge Systematics, Inc. 19
26 next most heavily used highway; it also connects Perryville to Elkton, by way of the city of North East. 12 Three rail lines cut across the county. One follows a bay tributary up the coast, running north/south, through Perryville and Port Deposit. The other two rail lines run east/west, following a similar alignment as U.S. 40 and I-95. The CSX railroad operates the line closest to I-95, while Amtrak operates the line closest to U.S As shown by the zoning designations in Figure 1, the linear belt of land between Elkton and Perryville, extending from I-95 to the Bay, contains most of the county s developed land. In particular, land uses that typically attract the movement of freight: commercial, industrial, and mineral extraction, are found almost exclusively in this developed area. 14 This linear belt of land between U.S. 40 and I-95 has become the focus of Cecil County and the State of Maryland s efforts to encourage more industrial and commercial businesses in the county. A State Enterprise Zone, with nine district areas, was established to provide incentives for businesses to locate around these major transportation routes. 15 Already, a large portion of Cecil County s population is employed in freight-related industries. About 13.9 percent of the population works in manufacturing and 19.1 percent works in trade, transportation, and utilities WILMAPCO map: Average Annual Daily Traffic in the WILMAPCO Region, Cecil_rail.shp 2002 GIS file from WILMAPCO. 14 Cecil_Zoning_2005.shp 2005 GIS file from WILMAPCO. 15 Cecil County Office of Economic Development: Enterprise Zones. business_enterprise.cfm. 16 Maryland Department of Business & Economic Development. Cecil County, MD Brief Economic Facts easternregion/cecilcounty.html. 20 Cambridge Systematics, Inc.


27 Rd0.wmv Rd1.wmv Rd2.wmv Rd3.wmv Figure 1. Cecil County Land Use Current and Future Patterns for New Castle County New Castle County, Delaware is located along the Delaware River, abutted to the north by Pennsylvania and to the east by Maryland. The county has a land area of 426 square miles and contains 13 incorporated municipalities: Arden, Ardencroft, Ardentown, Bellefonte, Delaware City, Elsmere, Middletown, New Castle, Newark, Newport, Odessa, Townsend, and Wilmington. Wilmington, the county seat, is by far the largest of the municipalities with a population of 72,664. Wilmington, New Castle, and Delaware City are situated on the Delaware River, while Newark, the county s second most populous Cambridge Systematics, Inc. 21
28 town, with 28,547 residents, is located further inland, less than four miles from Elkton, Maryland in Cecil County. 17 The northern half of the county sees heavy highway traffic. Similar to Cecil County, I-95 in New Castle County has heavy traffic volumes, along with I-295 and I-495. Connecting roads, including U.S. 202, SR 41, SR 896, U.S. 13, and Delaware Route 4, also carry large volumes of traffic. 18 Two Class I railroads service New Castle County, CSX, and Norfolk Southern. Amtrak operates the east/west line closest to I-95 south of Wilmington, CSX operates an east/west line further north, and Norfolk Southern operates the north/south line, running from Middletown to Wilmington. 19 As shown in Figure 2, the majority of developed land and industry in New Castle County is located in the northern half of the county. Most of the industrial uses are centered around towns on the Delaware River, including Wilmington, New Castle, and Delaware City. Although some industrial uses can also be found heading toward Elkton, particularly along the I-95 corridor. Delaware Route 4, U.S. 13, and U.S. 202 are three of the most frequently used highways, all of which connect to the interstate system. Looking at the amount of industrial land around U.S. 13 and Delaware Route 4, it is likely that these two highways are carrying significant amounts of freight. Although connected to Wilmington, U.S. 202 does not appear to be surrounded by much industrial land uses U.S. Census Bureau; State and County Quick Facts. New Castle County Delaware WILMAPCO map: Average Annual Daily Traffic in the WILMAPCO Region, NCC_rail.shp 2002 GIS file from WILMAPCO. 20 Municipal_zoning.shp 2004 GIS file from WILMAPCO. 22 Cambridge Systematics, Inc.


29 Rd0.wmv Rd1.wmv Rd2.wmv Rd3.wmv Figure 2. New Castle County Land Use Cambridge Systematics, Inc. 23
30 3.1.3 Regional Patterns Focusing on the region in its entirety, it is clear that I-95 is a major transportation route that sees heavy traffic flows, and likely carries the majority of the region s freight traffic. It connects four of the largest cities in the region, Wilmington and Newark in Delaware, and Elkton and Perryville in Maryland. It also connects both of the region s major bodies of water, the Chesapeake Bay and the Delaware River. Land use patterns and highway traffic volumes indicate that freight is moving primarily north/south. This is not surprising since the primary population centers are located north (Philadelphia, New York) and south (Baltimore, Washington) of the region. 3.2 Consuming and Producing Industries Methodology The key data source to better identify the consuming and producing industries in the WILMAPCO region was Global Insight s Freight Locator TM dataset, which is based upon basic business demographic information supplied by InfoUSA. The latter dataset maintains information on 14 million American and Canadian businesses which is verified annually and which provides information on: location, type of business, business size in revenue and number of employees, and contact information. Global Insight, in turn, adds commodity and tonnage data to the base dataset in order to make it more effective in select areas such as freight transportation planning and marketing. A series of inputoutput models is applied by Global Insight to the base data in order to correlate transportation, production, and supply volumes for individual establishments Summary of Findings Figure 3 is a graphical representation of the data contained in the Freight Locator TM dataset. Each color-coded dot on the map represents a major freight industries with 50 or more employees by sector, including: agriculture, manufacturing, military, minerals, postal, service/nonretail, transportation facilities, warehouse, service/retail, and the unknown category where there was no clear translation from the Standard Industrial Classification (SIC) code to a clearly defined industry. Additionally, Table 4 presents a freight-related tonnage summary by location and employment sector. Both graphics underscore the notion that freight-generating industries tend to cluster along major roadways and around major towns in this case Wilmington, in particular, in addition to Newark, Elkton, and Middletown. 24 Cambridge Systematics, Inc.
31 Rd0.wmv Rd1.wmv Rd2.wmv Rd3.wmv Figure 3. Map of Freight Establishments in the WILMAPCO Region Cambridge Systematics, Inc. 25
32 Table 4. Freight-Related Tonnage Summary by WILMAPCO Location and Employment Sector Total Tonnage Employment Sector City/ Place State Inbound/Outbound Manufacturing Wilmington Delaware 12,145,613 Manufacturing New Castle Delaware 5,535,406 Manufacturing Newark Delaware 2,147,962 Manufacturing Bear Delaware 1,545,698 Manufacturing Middletown Delaware 1,109,415 Manufacturing Claymont Delaware 1,064,296 Manufacturing Elkton Maryland 816,745 Service New Castle Delaware 498,068 Manufacturing Delaware City Delaware 305,629 Manufacturing Newport Delaware 219,352 Manufacturing Perryville Maryland 118,289 Manufacturing Hockessin Delaware 44,051 Minerals Yorklyn Delaware 33,209 Minerals Wilmington Delaware 23,136 Manufacturing North east Maryland 12,072 Manufacturing Chesapeake City Maryland 11,079 Manufacturing Yorklyn Delaware 8,471 Manufacturing Edgemoor Delaware 5,542 Source: 2005 Global Insight Freight Locator dataset. 3.3 Commodity Flow Patterns Methodology The primary data source for the profile of commodity flows for the WILMAPCO region is the TRANSEARCH commodity flow database, a commercial data product developed by Global Insight, Inc. The general TRANSEARCH database structure contains estimates of domestic county-to-county and state-to-state freight flows by all modes including truck, rail, air, and water. These estimates can be further aggregated into larger geographical areas, such as U.S. Census Bureau Regions, which are used to report external flows. TRANSEARCH also provides separate estimates for different commodity types. It utilizes proprietary data to estimate truck flows; the Surface Transportation Board Carload Waybill Sample for rail flows; and other public sources for air and water flows. 26 Cambridge Systematics, Inc.
33 Rd0.wmv Rd1.wmv Rd2.wmv Rd3.wmv Consistent with the earlier 2001 TRANSEARCH data for the WILMAPCO region, the 2005 dataset purchased in support of this study focuses only on the truck mode. This mode is of most interest in the analysis of regional freight movements, and also of greatest relevance to the motivations underlying this study. The 2005 dataset also retains the geographic regions of the previous data, as shown in Table 10 in the Appendix. In a departure from the previous dataset, however, the current dataset provides forecasts for both truck tonnage and truck units for three future periods: 2010, 2020, and While the aggregate changes in total truck tonnage and units will be shown for each future period in broad summary form, more detailed displays and discussions on commodities and trading partners will largely focus on only two years 2005 (otherwise referred to in this report as the base year ) and 2030 (otherwise referred to as the future year ) since the intermediate (i.e., 2010 and 2020) rankings by commodity or trading partner are unlikely to reveal a new direction or trend that already is not captured by the 2030 figures Summary of Flows As shown in Table 5, a total of about 135 million truck tons are reported for the WILMAPCO region in By 2030, that total is projected to increase by about 84 percent to approximately 249 million. 23 Between 2005 and 2030, the growth in truck tonnage by direction is most pronounced for internal tonnage, which is projected to grow by 96 percent. However, internal tonnage represents the smallest share less than 1 percent of total truck traffic by weight in the base and future year. Through truck tonnage, on the other hand, represents the largest share of total truck tonnage by direction, comprising about 53 percent. Between 2005 and 2030, through truck tonnage is projected to grow by 88 percent. Outbound truck tonnage reflects 27 percent of total truck tonnage; it is projected to grow by 73 percent between 2005 and Inbound truck tonnage reflects a 19 percent share of total truck tonnage; it is projected to grow by 91 percent from 2005 to The general methodology for deriving the forecasts involved taking the 2004 benchmark dataset and growing the values for future years, including 2005, based on Global Insight s forecasted economic growth rates. The result represents either shipments or purchases by the Standard Industrial Classification (SIC) code in a particular region of the country. The shipment growth rates were determined by the growth in output by region and SIC code, based on Global Insight s Business Demographic Monitor (DBM). The purchase growth rates were based on Global Insight s Business Transactions Matrix (BTM), which measures the purchases of a product made by one industry by industries in all other SIC codes, as well as the retail sector, by region. In the end, the TRANSEARCH data was linked to the economic forecasts by applying the developed two-digit commodity growth rates observed in a given origin/destination demographic set to all commodities observed in the base year in the corresponding counties within the same two-digit commodity class. 22 This figure includes flows in every direction, including: inbound, outbound, internal, and through. 23 In the intermediate years, the projected increases to the total truck tonnage are 12 percent (2005 to 2010); 25 percent (2010 to 2020); and 32 percent (2020 to 2030). Cambridge Systematics, Inc. 27
34 A summary by truck units is also provided in Table The total truck units are projected to increase at a slightly faster rate than tonnage, resulting in an 89 percent increase from 2005 to The inbound truck units are projected to increase the most, reflecting an increase of about 102 percent, while the outbound truck units are projected to increase the least of all flows (a 75 percent increase). Internal truck units are projected to increase by about 97 percent, and through truck units are projected to increase by 91 percent. Table 5. Summary of WILMAPCO Truck Tons by Direction Base and Forecast Years Flow Type 2005 Total Truck Tons 2010 Total Truck Tons 2020 Total Truck Tons 2030 Total Truck Tons Percent Change in Tons from 2005 to 2030 Inbound 25,795,813 29,071,583 36,691,149 49,243, % Outbound 37,010,088 41,748,986 51,467,989 63,957, % Internal 281, , , , % Through* 72,169,704 80,235, ,538, ,473, % Total 135,257, ,373, ,105, ,227, % Source: Note: 2005 TRANSEARCH data for the WILMAPCO Region. The through tonnage for Cecil County alone was 78.9 million in 2005; about 87.9 million in 2010; about million in 2020; and million in This represents an increase of 88.3 percent from 2005 to 2030, slightly more than the through tonnage increase for the region as a whole. The through tonnage for New Castle County alone was 88.4 million in 2005; about 97.7 million in 2010; about million in 2020; and million in This represents an increase of 82 percent from 2005 to 2030, less than the through tonnage increase for Cecil County and the region as a whole. 24 In TRANSEARCH, truck units are derived by dividing the truck tonnage by commodity-based payload factors. 25 Similar to the trends by truck tonnage, the increases in truck units in the intermediate years are most pronounced in the 2020 to 2030 period, reflecting a projected increase of 35 percent. Meanwhile, from 2005 to 2010, an 11 percent increase is projected; a 27 percent increase is projected from 2010 to Cambridge Systematics, Inc.
35 Rd0.wmv Rd1.wmv Rd2.wmv Rd3.wmv Table 6. Summary of WILMAPCO Truck Units by Direction Base and Forecast Years Flow Type 2005 Total Truck Units 2010 Total Truck Units 2020 Total Truck Units 2030 Total Truck Units Percent Change in Units from 2005 to 2030 Inbound 1,652,977 1,826,822 2,431,118 3,335, % Outbound 1,895,257 2,106,211 2,656,747 3,311, % Internal 17,084 19,247 24,730 33, % Through 4,505,174 4,986,278 6,247,944 8,604, % Total 8,070,493 8,938,557 11,360,539 15,285, % Source: 2005 TRANSEARCH data for the WILMAPCO region Analysis by Commodity Table 7 shows top 2005 truck commodities by weight by each direction of truck flows. While certain commodity groups reappear as the top groups irrespective of direction, their rankings and percent share of total tonnage for that flow type (i.e., inbound, outbound, or internal) tend to vary. For example, the top inbound truck commodities include: secondary traffic (STCC 50); clay, concrete, glass, or stone (STCC 32); and petroleum or coal products (STCC 20). These three groups account for 26 percent, 17 percent, and 14 percent share of all inbound truck commodities by weight, or a combined 57 percent of total inbound tons. Meanwhile, the top outbound commodities include: clay, concrete, glass, or stone (STCC 32); secondary traffic (STCC 50); and lumber or wood products (STCC 28). These three groups account for 22 percent, 17 percent, and 15 percent shares of all outbound truck commodities by weight, or a combined 54 percent of total outbound tons. The top commodities that dominate the internal truck movements include: clay, concrete, glass, or stone (STCC 32); lumber or wood products (STCC 28); and petroleum or coal products (STCC 20). The clay, concrete, glass, or stone group (STCC 32) captures an overwhelming 76 percent share of total internal truck movements, followed by the lumber or wood products group (STCC 28) at 6 percent, and the food and kindred products group (STCC 20) at 5 percent. Together, these groups comprise a total share of 87 percent. Table 8 provides a separate summary of the 2005 through truck tonnage by top commodities. The top three commodity groups for through truck traffic are: chemicals or allied products (STCC 28); nonmetallic minerals (STCC 14); and secondary traffic (STCC 50). These three groups account for 14 percent, 13 percent, and 12 percent of the total through Cambridge Systematics, Inc. 29
36 truck traffic by all commodity groups, respectively, or a combined total of 39 percent of total through tons. 26 Table 7. Summary of 2005 Truck Tons by Top Commodities and Direction Inbound, Outbound, and Internal STCC2 Commodity 2005 Truck Tons Inbound Outbound Internal Total Percent Share of Inbound Flows 2005 Truck Tons Percent Share of Outbound Flows 2005 Truck Tons Percent Share of Internal Flows Truck Tons 50 Secondary Traffic 6,631,296 26% 6,204,318 17% 7, % 12,842, Clay, Concrete, Glass, or Stone 4,356,278 17% 8,080,921 22% 213, % 12,650, Food or Kindred Products 3,668,906 14% 2,944,903 8% 14, % 6,627, Petroleum or Coal Products 2,895,529 11% 3,707,637 10% 2, % 6,605, Chemicals or Allied Products 1,796,259 7% 5,630,216 15% 17, % 7,443, Lumber or Wood Products 1,424,009 6% 920,330 2% 1, % 2,345, Primary Metal Products 1,138,033 4% 1,808,950 5% % 2,947, Transportation Equipment 710,349 3% 774,027 2% 10, % 1,494, Fabricated Metal Products 613,727 2% 64,628 0% % 678, Pulp, Paper, or Allied Products 600,053 2% 457,250 1% % 1,057,443 * Remaining Commodities 1,961,375 8% 6,416,908 17% 15, % 8,393,581 Total 25,795, % 37,010, % 281, % 63,087, The top three groups comprise a much smaller share of the through truck total, as opposed to inbound moves where the top three groups comprise 57 percent; outbound moves where the top three groups comprise 54 percent; and internal moves where the top three groups comprise a much larger share of 87 percent. 30 Cambridge Systematics, Inc.
37 Rd0.wmv Rd1.wmv Rd2.wmv Rd3.wmv Table 8. Summary of 2005 Through Truck Tons by Top Commodities STCC2 Commodity 2005 Truck Tons Through Percent Share of Through Flows 28 Chemicals or Allied Products 9,869, % 14 Nonmetallic Minerals 9,323, % 50 Secondary Traffic 8,717, % 20 Food or Kindred Products 7,838, % 29 Petroleum or Coal Products 6,648, % 26 Pulp, Paper or Allied Products 5,135, % 32 Clay, Concrete, Glass Or Stone 4,653, % 24 Lumber or Wood Products 4,076, % 33 Primary Metal Products 3,605, % 37 Transportation Equipment 2,139, % * Remaining Commodities 10,163, % Total 72,169, % Table 9 presents a summary of the top commodities that are projected in 2030 by direction. In the case of inbound flows, the top five commodity groups in 2005 retain their relative rankings in 2030; however, their (percentage) shares of the total inbound tonnage show decreases with the exception of secondary traffic (STCC 50). As the top commodity group, secondary traffic shows an increase of 174 percent by weight from 2005 to 2030; meanwhile, its share of total 2030 inbound truck tonnage increases by 11 percent (from 26 percent to 37 percent). The other four top groups clay, concrete, glass, or stone (STCC 32), food or kindred products (STCC 20), petroleum or coal products (STCC 29), and chemicals or allied products (STCC 28) show increases in absolute tonnage, but their shares of the total inbound tonnage decrease slightly by 1 percent to 3 percent by For outbound flows, the striking change between 2005 and 2030 was the assent of secondary traffic (STCC 50) into the top commodity spot, due to a projected 230 percent increase in tonnage for that group. The clay, concrete, glass, or stone group (STCC 32) is the second-ranked commodity in terms of absolute tonnage. From 2005 to 2030, the truck tonnage attributed to this group increased by 75 percent, although its share of total outbound truck tonnage remains unchanged 22 percent from The third-ranked commodity group, chemicals or allied products (STCC 28), shows an increase by tonnage of 27 percent from 2005 to 2030, although its share of total outbound truck tonnage has decreased by 4 percent (from 15 percent in 2005 to 11 percent in 2030). The fourth-ranked commodity, petroleum, or coal products (STCC 29), shows a 52 percent increase by Cambridge Systematics, Inc. 31
38 tonnage by 2030; its share of total outbound truck tonnage falls slightly from 10 percent in 2005 to 9 percent in For internal flows, the top commodity group in 2005 clay, concrete, glass, or stone (STCC 32) retains its rank in In fact, the absolute tonnage of STCC 32 is projected to increase by 108 percent in that timeframe, while its share of total internal tonnage is projected to increase by about 4 percent (from a 76 percent in 2005 to 80 percent in 2030). Meanwhile, with a large projected increase in tonnage of about 241 percent, secondary traffic (STCC 50) moves up from the fourth-ranked commodity group in 2005 to a secondranked commodity group in Its share of total internal tonnage increases by almost 2 percent from 2005 to Food and kindred products (STCC 20) retains its position as the third-ranked commodity group with an increase in tonnage of about 66 percent from 2005 to The share of STCC 20 of total internal flows decreases by 0.8 percent by Meanwhile, chemicals or allied products (STCC 28) drops as the second-ranked commodity in 2005 to the fourth spot in 2030, in spite of the 33 percent increase in tonnage projected in this time period. Its share of internal truck tonnage decreases by 2 percent from 2005 to Table 10 presents a summary of the top through commodities in As is the case with inbound and outbound truck tonnage, the top 2030 commodity group for through truck flows is secondary traffic (STCC 50) which shows a 208 percent projected increase in tonnage between 2005 and In 2005, this group was ranked third; therefore, its rise to the top spot in 2030 is noteworthy. Its share of total through tonnage shows a projected increase of 8 percent from 2005 to 2030 (from 12 percent to 20 percent). Nonmetallic minerals (STCC 14) is the second-ranked commodity group in 2030, up by 78 percent from Its share of total through tonnage shows a slight decrease of 0.6 percent by The third-ranked commodity group, chemicals or allied products (STCC 28), shows a projected increase in tonnage of 39 percent by 2030, although its share of total through tonnage is projected to decrease by roughly 4 percent during that timeframe. The fourthranked commodity group food or kindred products (STCC 20) shows a 68 percent projected increase in tonnage from 2005 to Its share of total 2030 through tonnage shows a slight decrease of 1 percent. 32 Cambridge Systematics, Inc.
39 Rd0.wmv Rd1.wmv Rd2.wmv Rd3.wmv Table 9. Summary of 2030 Truck Tons by Top Commodities and Direction Inbound, Outbound, and Internal STCC2 Commodity 2030 Truck Tons Inbound Outbound Internal Total Percent Share of Inbound Flows 2030 Truck Tons Percent Share of Outbound Flows 2030 Truck Tons Percent Share of Internal Flows Truck Tons 50 Secondary Traffic 18,165,870 37% 20,450,612 32% 24, % 38,641, Clay, Concrete, Glass or Stone 6,913,558 14% 14,152,685 22% 442, % 21,508, Food or Kindred Products 6,597,879 13% 4,726,004 7% 23, % 11,347, Petroleum or Coal Products 4,825,620 10% 5,623,142 9% 3, % 10,452, Chemicals or Allied Products 2,114,896 4% 7,172,280 11% 23, % 9,310, Machinery 2,041,398 4% 614,249 1% 0 0.0% 2,655, Lumber or Wood Products 1,434,728 3% 860,029 1% 1, % 2,296, Primary Metal Products 1,159,237 2% 2,569,098 4% % 3,728, Transportation Equipment 1,018,050 2% 642,028 1% 5, % 1,665, Electrical Equipment 947,709 2% 211,419 0% % 1,159,265 * Remaining Commodities 4,024,392 8% 6,935,809 11% 28, % 10,988,673 Total 49,243, % 63,957, % 553, % 113,754,510 Table 10. Summary of 2030 Through Truck Tons by Top Commodities Through STCC2 Commodity 2030 Truck Tons Percent Share of Through Flows 50 Secondary Traffic 26,834, % 14 Nonmetallic Minerals 16,622, % 28 Chemicals Or Allied Products 13,734, % 20 Food Or Kindred Products 13,137, % 35 Machinery 11,366, % 29 Petroleum Or Coal Products 9,907, % 32 Clay, Concrete, Glass Or Stone 9,544, % 26 Pulp, Paper Or Allied Products 6,381, % 24 Lumber Or Wood Products 4,566, % 36 Electrical Equipment 4,174, % * Remaining Commodities 19,203, % Total 135,473, % Cambridge Systematics, Inc. 33
40 3.3.4 Analysis by Trading Partner In addition to the commodity summary presented above, it is also important to identify WILMAPCO s key trading partners, which include top origin regions for flows into the WILMAPCO region (i.e., inbound flows), as well as top destination regions for flows outside the two-county area (i.e., outbound flows). In sum, the WILMAPCO region is a net exporter with about 37 million truck tons flowing out of the region, in comparison with about 26 million truck tons flowing into the region. The geography used to define trading partners is identified in Table 10 in the Appendix. For locations closer to the WILMAPCO region, smaller geographical regions were used (i.e., Philadelphia County). For locations further from the WILMAPCO region, multistate U.S. Census regions were used (e.g., South-South Atlantic), as shown in Figure 4. Figure 4. Geography of the TRANSEARCH Dataset Figure 5 shows the top origin regions for truck tonnage that terminates in the WILMAPCO region in each of the four time periods: 2005, 2010, 2020, and The top three regions South-South Atlantic, Pennsylvania, and Midwest-East North Central account for about 55 percent of total inbound flows into the WILMAPCO region. The three regions show roughly the same amount of truck tonnage in 2005, with South-South 34 Cambridge Systematics, Inc.
41 Rd0.wmv Rd1.wmv Rd2.wmv Rd3.wmv Atlantic leading at 4.9 million, followed by Pennsylvania at 4.7 million, and Midwest-East North Central at 4.6 million. However, by 2030 Pennsylvania is projected to have slightly more tonnage than South-South Atlantic and considerably more than Midwest-East North Central, reflecting their individual growth rates between the base and future year. Between 2005 and 2030, Pennsylvania traffic is projected to grow by 104 percent; South- South Atlantic traffic is projected to grow by 91 percent; and the Midwest-East North Central traffic is projected to grow by the smallest amount (68 percent). 27 Figure 6 shows a somewhat different ranking of top destination regions for truck tonnage that originates in the WILMAPCO region in each of the four time periods. The top two trading partners South-South Atlantic and Pennsylvania mirror the pattern for inbound flows, although it is clear that a greater amount of tonnage flows to these regions from WILMAPCO than in the reverse direction. In 2005, about nine million truck tons are shown for South-South Atlantic, and about 6 million truck tons for Pennsylvania. By 2030, those tonnage amounts are projected to increase by 73 percent and 84 percent, respectively. 28 The third-ranked trading partner is Northeast-New England, with almost four million truck tons in 2005 and almost six million in 2030, a projected increase of about 53 percent. The top three trading partners account for about 51 percent of total outbound flows from the WILMAPCO region. 27 When looking at all trading partners, it is actually Baltimore County, Maryland; NorthEast-Mid Atlantic; and Harford County, Maryland that have the largest grown rates in tonnage between 2005 and They are projected to grow by 173 percent, 117 percent, and 115 percent, respectively. However, this is not readily evident since their baseline (2005) truck tonnage is much lower relative to the top three. 28 Of all trading partners, it should be noted that the NorthEast-Mid Atlantic region shows the most growth in truck tonnage between 2005 and 2030, measuring 110 percent. Cambridge Systematics, Inc. 35
42 Figure 5. Top Origins for Truck Tonnage Terminating in the WILMAPCO Region 2005, 2010, 2020, and Truck Tons (Millions) Truck 2005 Truck 2010 Truck 2020 Truck South - South Atlantic PA Mid West - East North Central NJ South - West South Central North East - Mid Atlantic Harford County, MD Origin County/ Region Source: Cambridge Systematics, Inc. analysis of TRANSEARCH data South - East South Central Baltimore County, MD Lancaster County, PA Philadelphia County, PA Figure 6. Top Destinations for Truck Tonnage Originating in the WILMAPCO Region 2005, 2010, 2020, and Truck Tons (Millions) Truck 2005 Truck 2010 Truck 2020 Truck South - South Atlantic PA North East - New England Mid West - East North Central Sussex County, DE NJ North East - Mid Atlantic Destination County/ Region Source: Cambridge Systematics, Inc. analysis of TRANSEARCH data Kent County, DE Baltimore County, MD Philadelphia County, PA South - West South Central 36 Cambridge Systematics, Inc.
43 Rd0.wmv Rd1.wmv Rd2.wmv Rd3.wmv Figure 7 and Figure 8 show each trading partner s contribution as an importer or exporter of truck tonnage in relation to the WILMAPCO region. In 2005, all top trading partners with the exception of North East-New England imported more truck tonnage from the WILMAPCO region than they exported to the WILMAPCO region. For a few trading partners South-West South Central; Philadelphia County, Pennsylvania; and Sussex County, Delaware the margin of difference was quite small since the amount flowing in and out is roughly the same. In contrast, the South-South Atlantic and Pennsylvania had the greatest margins between inbound and outbound flows of 4 million and 1.5 million, respectively. Meanwhile, North East-New England exported almost 1 million more tons to the WILMAPCO region than it received from the region. By 2030, the margin between inbound and outbound flows for South-South Atlantic and Pennsylvania is projected to increase by a greater amount 6 million and almost 2 million, respectively. As in 2005, the margin of difference in inbound and outbound tonnage was small for several trading partners particularly South-West South Central; New Jersey; and Philadelphia County, Pennsylvania. Figure Truck Tonnage Originating and Terminating in the WILMAPCO Region by Trading Partner Truck Tonnage (Millions) South - South Atlantic PA North East - New England Mid West - East North Central Sussex County, DE NJ North East - Mid Atlantic Kent County, DE Baltimore County, MD Origin - WILMAPCO Region Destination - WILMAPCO Region Source: Cambridge Systematics, Inc. analysis of TRANSEARCH data Trading Partner Philadelphia County, PA South - West South Central Cambridge Systematics, Inc. 37
44 Figure Truck Tonnage Originating and Terminating in the WILMAPCO Region by Trading Partner Truck Tonnage (Millions) South - South Atlantic PA North East - New England Mid West - East North Central Sussex County, DE NJ North East - Mid Atlantic Kent County, DE Baltimore County, MD Origin - WILMAPCO Region Destination - WILMAPCO Region Source: Cambridge Systematics, Inc. analysis of TRANSEARCH data Trading Partner Philadelphia County, PA South - West South Central 3.4 Traffic Volumes Current Volumes As shown in Figure 9, I-95 is the major highway running through the WILMAPCO region. As such, it can be assumed, with its extremely high traffic volumes and proximity to industrial land uses, that it carries a large portion of the truck traffic in the region. 29 It is not alone, however, in carrying trucks through the region. A fair number of the highways feed into I-95, particularly in New Castle County, Delaware. These feeder highways also appear to carry a fair amount of truck traffic. In Cecil County, much of the truck traffic outside of I-95 is on U.S. 40 and MD-279, the highway linking Elkton, Maryland to Newark, Delaware. Approximately 1,000 to 5,000 trucks per day run on segments of both of these highways, compared to over 10,000 trucks traveling per day on I-95. Also, there are approximately 500 to 1,000 trucks running daily between Cecilton, Maryland and Chesapeake City, Maryland, on MD The northern half of New Castle County sees the most overall traffic in the WILMAPCO region. The 2005 weekday traffic counts reported by WILMAPCO reflect this fact. 29 Average Annual Daily Traffic in the WILMAPCO Region, 2004 ; WILMAPCO web site. 30 WILMAPCO data files. 38 Cambridge Systematics, Inc.
45 Rd0.wmv Rd1.wmv Rd2.wmv Rd3.wmv Generally speaking, traffic counts south of U.S. 40, in New Castle County, fall between a range 7,500 to 15,000, while traffic counts north of U.S. 40 typically fall between a range of 15,000 to 30,000. However, the percentage of heavy traffic on highways south of U.S. 40 is much higher than the percentage of heavy traffic north of U.S. 40. Approximately 10 to 20 percent of the traffic in southern New Castle County is considered heavy, while many of the highways north of U.S. 40 have heavy traffic percentages of less than 10 percent. 31 Given the high population in northern New Castle County, it seems natural that there is a lower percentage of overall heavy truck traffic. This lower percentage of heavy traffic does not necessarily mean there are fewer trucks using highways in the north. Rather, it means, as a proportion of all the traffic, trucks make up a smaller percentage. 31 Holly Rybinski, P.E., Edwards and Kelsey Control County Typical Weekday. WILMAPCO Traffic Data Collection, New Castle County, Delaware. Cambridge Systematics, Inc. 39


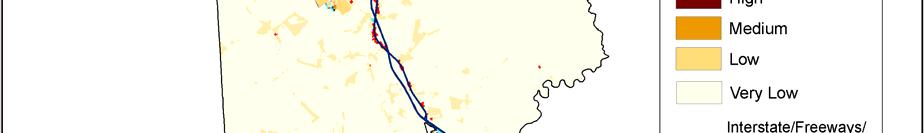
46 Figure 9. Average Annual Daily Truck Traffic in Cecil County Cambridge Systematics, Inc.


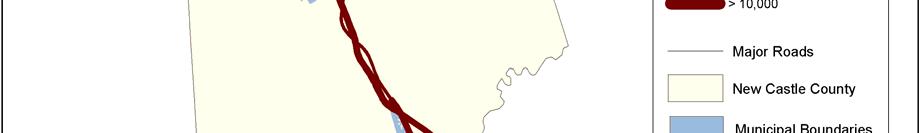
47 Rd0.wmv Rd1.wmv Rd2.wmv Rd3.wmv Figure 10. Average Annual Daily Truck Traffic in New Castle County-2005 Cambridge Systematics, Inc. 41
48 3.5 The Port of Wilmington The Port of Wilmington is a deepwater port and marine terminal handling over 400 vessels each year with an annual import/export cargo tonnage of nearly 5 million. It handles the largest volumes of imported fresh fruit, bananas, juice concentrate, and palletized frozen beef in North America. Located at the confluence of the Delaware and Christiana Rivers, 65 miles from the Atlantic Ocean, the Port of Wilmington is owned and operated by the Diamond State Port Corporation, a corporate entity of the State of Delaware. As can be seen in Table 9, port traffic and tonnage increased between 2004 and However, the port s annual tonnage has seen a steady decline since 2001, a trend that continued in Table 9. Port Statistics Calendar Year (CY) 2004 to 2006 Calendar Year Year Total Annual Vessel Calls Cargo Mix Short Tons (1,000s) Short Tons (1,000s) Short Tons (1,000s) Total General Cargo Total Containerized Cargo 1,499 1,601 1,612 Total Dry Bulk Cargo Total Liquid Bulk Cargo 1,500 1,505 1,006 Total Container Traffic 162,330 TEUs 179,010 TEUs 188,242 TEUs Commodities Short Tons (1,000s) Short Tons (1,000s) Short Tons (1,000s) Bananas and Tropical Fruit 1,284 1,331 1,338 Chilean Deciduous Fruit Other Fruit Cargo Apple and Orange Juice Concentrates Frozen Beef And Seafood Automobiles Steel Forest Products Dry Bulk Petroleum Liquid Bulk 1,500 1,505 1,006 Other General Cargo Grand Total 4,499 4,566 4,136 Source: Port of Wilmington, Delaware, Diamond State Port Corporation. 42 Cambridge Systematics, Inc.
49 Rd0.wmv Rd1.wmv Rd2.wmv Rd3.wmv Access to the Port of Wilmington is via Terminal Avenue, which directly connects to I-495 and then to I-95. According to analysis in the Wilmington-Harrisburg Freight Study, the vast majority (over 90 percent) of the Port of Wilmington cargo is moved inland to customers and distribution centers via truck. The numbers may have changed since the opening of the Shellpot Bridge, though the primary reason for using trucks is the time and temperature sensitive nature of the fresh fruit and juices. Furthermore, the primary markets for over two-thirds of the cargoes are within a one-day drive of the Port (Western Pennsylvania, Ohio, New York, Massachusetts, and Eastern Canada). On an average day, between 650 to 700 truckloads of international cargo arrive and depart the Port s facilities. When considering empty moves, this figure is closer to 1,300 to 1,400 total truck trips to and from the Port every day. 4.0 Summary of Findings for Tasks 1, 2, and 3 The WILMAPCO region is a major thoroughfare for goods moving along the northeast corridor on I-95 and CSX Transportation (CSXT) and Norfolk Southern Railroads (NS). Much of freight passes through on the interstates and rail lines to the major population centers in the Northeast. These through moves are expected to grow considerably in the future. The Port of Wilmington is a major traffic generator, estimated to accommodate 650 to 700 truckloads of international cargo on an average day, which can translate to 1,300 to 1,400 truck trips when empty moves are taken into account. Employment data and related estimates of freight generation also underscore the prominence of manufacturing centers, including Wilmington, New Castle, and Newark in New Castle County. Cecil County, due to its largely agricultural nature, does not reflect this pattern to a similar degree, although Elkton is an important center in that county. Traffic volumes in Cecil County highlight the importance of I-95 a major freight route; in New Castle County, connecting roads such as U.S. 202, U.S. 13, SR 41, SR 896, U.S. 301, and Delaware Route 4 are significant, as are the larger interstates, including I-95, I-295, and I-495. In terms of commodity flow patterns, from 2005 to 2030, total truck tonnage in the WILMAPCO region is projected to increase by about 84 percent, from 135 million to 249 million total truck tons. Cambridge Systematics, Inc. 43
50 Through truck tonnage represents the largest share of the total tonnage roughly 53 percent and is projected to grow by 88 percent. Outbound truck tonnage represents the second-largest share 27 percent and is projected to grow by 73 percent. Inbound truck tonnage represents a 19 percent share, and is projected to grow by 91 percent. Internal truck tonnage represents less than 1 percent of total tonnage, and is projected to grow by 96 percent. The top three commodity groups for inbound, outbound, and internal truck tonnage are: secondary traffic (STCC 50); clay, concrete, glass, or stone (STCC 32); and chemicals or allied products (STCC 28). For through tonnage, the top groups are chemicals and allied products (STCC 28); nonmetallic minerals (STCC 14); and secondary traffic (STCC 50). The WILMAPCO region is a net exporter with about 37 million truck tons flowing out of the region, in comparison with about 26 million truck tons flowing into the region. The top three regions South-South Atlantic, Pennsylvania, and Midwest-East North Central accounted for 55 percent of total inbound flows to the region in The top three regions for outbound flows include South-South Atlantic, Pennsylvania, and Northeast-New England, accounting for about 51 percent of the total in Identification of Potential Bottlenecks Within the larger context of total traffic, the identification of areas or segments that experience recurring and nonrecurring congestion related to trucks was performed with considerable assistance from WILMAPCO staff and existing datasets. To ensure that all eligible segments were identified and highlighted, WILMAPCO staff undertook a comprehensive effort to score the entire roadway network in the region using five and six scoring factors for Cecil and New Castle counties, respectively. 32 It should be noted that the roadway network includes all roadways with a functional class of arterial or above. To produce an ordered list of problem segments, each scoring factor was weighted equally to derive an average score for each segment. The average score was achieved by calculating the total points divided by the applicable number of scoring factors. The highest potential average score for a segment in either county was 3.0. In the case of New Castle County, a maximum of 18 total points were divided by (at most) 6 scoring factors, subject to applicable data. In Cecil County, a maximum of 15 points were divided 32 New Castle County had one additional scoring factor a truck crash score due to data availability of safety-related data for that county. 44 Cambridge Systematics, Inc.
51 Rd0.wmv Rd1.wmv Rd2.wmv Rd3.wmv by (at most) five scoring factors, also subject to data availability and relevance. 33 The complete scoring breakdown for New Castle County across the various criteria can be found in Table 12 of the Appendix, while the summary for Cecil County can be found in Table 13. It should be cautioned that, due to variability in the type and physical characteristics across these segments, the scores are not intended to provide a true hierarchical ranking system, but rather to illustrate how the segments compare across the five or six scoring dimensions. The six scoring criteria were meant to expand upon the more traditional measures of congestion that describe all traffic (passenger vehicles and nonpassenger vehicles) to also take account for those vehicles that transport goods. A brief summary and the related scoring thresholds for each factor are described below. Figures 14 through 19 in the Appendix also provide a graphical summary of each. Average Annual Daily Traffic (AADT) This is one of the simpler traditional measures for how busy a road is, and is displayed for the WILMAPCO Region in Figure 14. It reflects the total volume in both directions of a highway or road for a year divided by 365 days. A segment in the WILMAPCO road network that had an AADT level of more than 60,000 vehicles was assigned the greatest number of points a total of three. An intermediate AADT level of 40,000 to 60,000 was assigned two points. A segment that had between 20,000 and 40,000 vehicles was assigned one point. (Volume/Capacity (V/C) Similar to AADT, this is another traditional measure of congested conditions. As shown in Figure 15, this criterion reflects the ratio of demand flow rate to capacity for a traffic facility and answers the question of whether there is sufficient capacity to accommodate a given volume of traffic. The V/C ratio was accompanied by level-of-service (LOS) criteria represented by letters A through F with A being most favorable traffic conditions and F being least favorable. Urban areas typically identify system deficiencies as worse than LOS D. The potential conflict areas in the WILMAPCO region were assigned one point if they had a LOS D ; a total of two points for an LOS E ; and three points for an LOS F rating. LOS E represents a V/C ratio between 0.93 and 1.0, whereas LOS F represents a V/C ratio more than 1.0. Travel Time (Percent Below Posted Speed) As shown in Figure 16, LOS ratings were used to assign points to segments where traffic was moving more slowly than posted speeds allow. For arterials, a LOS E rating corresponds to 60 percent to 70 percent traveling under the speed limit, whereas LOS F corresponds to more than 70 percent. For freeway segments, an LOS E equates to 30 percent to 50 percent traveling under the speed limit, whereas an LOS F equates to more than 50. LOS D, E, and F segments are assigned one, two, and three points, respectively. Average Daily Truck Percentage This factor is displayed for the WILMAPCO region in Figure 17. It focuses specifically on freight-related contributors to congestion by 33 Where data was not available or applicable, the scoring factor was assigned 0 points and was excluded from the denominator used to calculate the average score across all scoring factors (i.e. total score/number of scoring factors). Cambridge Systematics, Inc. 45
52 identifying the share of trucks as part of the overall traffic mix. The greatest number of points a total of three are assigned to segments where more than 12 percent of all road traffic is trucks; two points are assigned to an average daily truck percentage between 8 percent and 12 percent; and one point is assigned to an average daily truck percentage between 4 percent and 8 percent. Daily Truck Generation by Traffic Analysis Zone (TAZ) Like average daily truck percentage, this factor also aims to focus specifically on freight-related traffic. An estimated number of truck trips generated by each zone was derived using the number (and type) of employment and total households. One point was assigned to areas with 500 to 1,000 trips; two points were assigned to 1,000 to 2,000 trips; and three points were assigned to more than 2,000 trips. A map of truck trip generations for the region is shown in Figure 18. Aggregate Crash Score This safety measure was applied only to New Castle County and is based on two criteria: 1) the total number of crashes involving trucks aggregated along a road segment, excluding crashes at intersections; and 2) for those segments that have more than 20 total crashes, a score based on the total percentage of crashes relative to the New Castle countywide average of 5.5 percent. The aggregate crash scores were based on a six-point maximum and were further stratified into three tiers: significant, moderate, and minor. A map showing the results of this methodology is found in Figure 19. Figure 11 shows the location of potential bottlenecks in the WILMAPCO region, while Figures 12 and 13 in the Appendix show them separately for each county. The regional and county maps aim to provide a cross-sectional view of areas that experience both recurring congestion percent as expressed through growing AADT; for example, percent and nonrecurring congestion (as reflected by the crash data), as well as areas where relatively high truck volumes intersect with or perhaps contribute to existing chokepoints. While the more detailed application of the segment analysis and six criteria methodology was used as the basis for developing these maps, they use a broader three-tiered scoring system to provide a more simplified view. The three-tiered scoring includes the following thresholds for identifying bottlenecks: Significant Percent Refers to segments with multiple failing criteria, and generally includes roadways which carry the highest traffic volumes and experience heaviest congestion. Moderate Refers to segments that are experiencing some failing, or nearly failing, criteria. There is more variation in scoring across the criteria, with some criteria demonstrating failure and others at more modest levels. Minor Refers to segments that experience one or more criteria that are near failing. While most have only a few criteria showing near failure, others are at acceptable levels. 46 Cambridge Systematics, Inc.


53 Rd0.wmv Rd1.wmv Rd2.wmv Rd3.wmv Figure 11. WILMAPCO Potential Bottleneck Locations Source: WILMAPCO. Cambridge Systematics, Inc. 47
54 6.0 Recommendations WILMAPCO has been active in freight planning, and has exhibited a strong commitment to furthering freight planning activities in the region. The following list recommends several broad-based policy-level recommendations. These recommendations, along with the data and findings previously described in this report, are intended to support and expand future freight planning efforts in the region. 6.1 Develop a Vision for Freight Movement in the WILMAPCO Region Recommendation 1 WILMAPCO should adopt a set of goals for freight that are consistent with the goals of the Delaware and Maryland departments of transportation, and with neighboring agencies such as DVRPC. Furthermore, this set of goals should be consistent with and support land use and economic development goals within the region. Recommendation 2 The WILMAPCO region should, as a matter of broad transportation policy, recognize its willingness to invest public funds in transportation improvements that support private industries, provided that such improvements achieve appropriate public benefits. Recommendation 3 Freight planning efforts should promote a balanced multimodal system, supporting highway, rail, and air transportation. With congestion reaching such high levels along the roadway system, it is evident WILMAPCO cannot continue to expand roadways to accommodate the expected increases in traffic over the coming decades. Efforts must be made to examine the potential of moving freight traffic by other modes, especially rail. Currently, much of the rail system in the WILMAPCO region is underutilized for various reasons. By working with the railroads, and by reviewing commodity flow data and supply chains of major companies, efforts can be made to target possible mode shifts away from roads to rail. Recommendation 4 WILMAPCO should define the region s priority freight network. National Highway System (NHS) connectors need to be included in this priority network. In conjunction with the already identified NHS routes, there are other key transportation corridors that are critical to the movement of goods. These should be selected based on some reasonable criteria such as: Direct connections to freight terminals; Roads with high functional classifications, and the highest traffic levels; Impacts on residential areas, including noise, pollution, and safety; and Creates a link between majors U.S./Interstate routes or modes. 48 Cambridge Systematics, Inc.
55 Rd0.wmv Rd1.wmv Rd2.wmv Rd3.wmv 6.2 Create a Methodology to Identify Issues and Disseminate Information Recommendation 5 WILMAPCO should engage the private sector shippers and carriers, state economic development groups, and other key stakeholders in freight planning. This includes participation at meetings, an annual dinner, invited speakers, facility tours, etc. Materials should be developed as part of an outreach effort to educate and involve shippers and operators in the freight planning process. Recommendation 6 WILMAPCO should continue and build upon participation in interregional and multistate planning efforts. These also are opportunities to join with other agencies to solicit additional Federal funding for projects. Freight planning often involves building capacity along key corridors and trade routes that encompass large regional areas. The impacts of one jurisdiction s freight planning efforts often have significant impacts on neighboring jurisdictions. Recommendation 7 WILMAPCO should disseminate vital information about goods movement to key decision-makers, stakeholders, and the general public to reinforce the concept of freight as a good neighbor. This should involve a multimedia approach using meetings, presentations, reports, press releases, radio interviews, and television broadcasts. Recommendation 8 WILMAPCO should improve freight data collection efforts to support better decision-making. Understanding current freight traffic in the WILMAPCO region is critical to planning for its future needs. Organizations with an interest in freight traffic in the WILMAPCO region should work cooperatively to gather relevant data such as, but not limited to: Truck volumes; Truck percentages; Rail weight limits; Bridge capacities; Height clearances; and Origin/destination points. Data should be collected from all sources (i.e., subregional studies, DOT/MPO data collection activities), and should be distributed to all interested parties. 6.3 Develop a Methodology for Prioritizing Freight Projects and Guiding Investments Recommendation 9 Expand on the identified potential bottlenecks. Using the identified road segments identified in Chapter 5.0, a detailed analysis should be performed which examines each of the problem areas individually (or as a corridor) to determine which possible solutions which would best apply in each situation. Cambridge Systematics, Inc. 49
56 Recommendation 10 WILMAPCO should incorporate relevant truck/rail traffic data into their travel demand model. Coordination with state DOTs on improving the collection and quality of freight data used for travel demand models will help facilitate better investment decisions. Periodic reviews should be performed to ensure all base year model inputs are based on the most recent data collection activities. Recommendation 11 WILMAPCO should establish performance measures to evaluate trends in regional goods movement. This can draw from DOT Highway Performance Monitoring System truck counts, safety records, or data gathered from other initiatives. Measures might include truck vehicle miles traveled, truck percentage by roadway, accidents involving trucks, hours of truck delay, lifts and cars processed at rail yards, air cargo volumes, and square footage of warehouse and distribution center space. This should be tracked as a time series. 6.4 Establish a Realistic Funding Program to Implement the Freight Planning Program Recommendation 12 WILMAPCO should work with the state DOTs in identifying large scale projects of regional or national significance within its region and work to secure Federal, State, local, and private funding for these projects. Recommendation 13 WILMAPCO should incorporate freight into their existing project prioritization process. Using the improved freight system performance data, freight should be better represented in WILMAPCO s project prioritization process. In the era of diminishing transportation funding, a concerted effort should be made to properly address the most critical sections of the network. Using the results of the Gaps and Conflicts analysis, these locations can be used to apply additional weight to potential projects, which could address truck issues along these critical segments. Important freight considerations include: Transportation Measures: Volume/capacity; Truck percentage and volume; CMP corridor; LOS; and Travel speeds. Economic Measures: Number WILMAPCO industries impacted; Importance to supply chain; and Public benefits/costs. Safety, Environmental, Quality of Life Measures: 50 Cambridge Systematics, Inc.
57 Rd0.wmv Rd1.wmv Rd2.wmv Rd3.wmv Truck crashes; and Reduction of trucks in residential areas. Recommendation 14 WILMAPCO should establish a Freight and Goods Movement Subcommittee. This subcommittee should be chaired by someone outside of the WILMAPCO organization. It should include DOTs, economic development groups, private sector representatives, county officials, ports, and members of the public. Members of the private sector are important to help the general public s understanding of freight s link to regional economic competitiveness. In addition, surrounding MPOs and counties also should be included, so they can comment on interregional impacts generated by freight activities. The group will be charged with overseeing and helping implement future actions and policy recommendations that result from this study. Also, the group will aid the MPO in the best methods for addressing SAFETEA-LU provisions. Recommendation 15 WILMAPCO should incorporate the impacts of freight in the development of the Congestion Management Process. WILMAPCO s 2004 CMP report recognized the need to better understand how freight movement contributes to congestion. The report recommended that freight performance measures be applied to the identification of congested corridors. Efforts should be made to include these into the CMP corridor selection process. 6.5 Maintain a Continuing Commitment to Freight Program Delivery Recommendation 16 WILMAPCO staff working in freight should have a portion of their time dedicated to freight movement issues. This should be explicitly specified in the Unified Planning Work Program or other appropriate budget mechanism. Recommendation 17 WILMAPCO should ensure that freight projects are considered in their transportation improvement program and also in their long-range plan. Recommendation 18 WILMAPCO should address safety issues identified from the gaps and conflicts analysis in this study. Using the results of the truck safety portion of the Gaps and Conflicts analysis, develop a more detailed crash analysis of problem areas. This analysis will look at crashes by type, time of day, road conditions and other factors, and develop possible solutions for recurring problems. WILMAPCO also should examine safety issues related to grade separation crossings, which are not covered in this report. Recommendation 19 WILMAPCO should examine the need for truck rest stop facilities in the region. Truck parking studies in states neighboring Delaware show a dearth of available parking. With the new truck-hour restrictions and increasing freight traffic, parking along the East Coast has become a concern. In conjunction with regional partners, a needs assessment should be performed to understand the current capacity of truck parking facilities. Recommendation 20 WILMAPCO should monitor the movement of hazardous material in and through the region and provide this information as a service to the area emergency Cambridge Systematics, Inc. 51
58 response teams. This information can be obtained from commodity flow databases, hazmat permits, railroad data, and other sources. Recommendation 21 WILMAPCO should support improved communication with the trucking industry to reduce the frequency of lost truck drivers. Initially this can involve development of a regional truck map that highlights primary truck routes and key truck destinations. Future efforts might involve web-based or real-time communication with the drivers. 52 Cambridge Systematics, Inc.
59 Rd0.wmv Rd1.wmv Rd2.wmv Rd3.wmv Appendix Table 10. Geography of the 2005 WILMAPCO TRANSEARCH Dataset Census Division/ FIPS Code Census Division/ County Name Census Region 1 (Maine, New Hampshire, Vermont, Massachusetts, Connecticut, Rhode Island) Census Region 2 (New York only) Census Region 3 (Wisconsin, Michigan, Illinois, Indiana, Ohio) Census Region 4 (North Dakota, South Dakota, Nebraska, Kansas, Iowa, Montana, Minnesota) Census Region 5 (Florida, Georgia, South Carolina, North Carolina, West Virginia, Washington, D.C., Virginia, All Maryland counties except: Cecil, Harford, Kent, and Queen Anne s) Census Region 6 (Kentucky, Tennessee, MS, Alabama) Census Region 7 (Oklahoma, Arizona, Louisiana, Texas) Census Region 8 (MT, Wyoming, Idaho, Nevada, Utah, Colorado, Arizona, New Mexico) Census Region 9 (California, Oregon, Washington) Northeast New England Northeast Mid Atlantic Midwest East North Central Midwest West North Central South South Atlantic South East South Central South West South Central West Mountain West Pacific Kent County, Delaware New Castle County, Delaware Sussex County, Delaware Baltimore County, Maryland Cecil County, MD Harford County, Maryland Kent County, Maryland Queen Anne s County, Maryland Camden County, New Jersey Gloucester County, New Jersey Salem County, New Jersey 34 New Jersey (* All counties except: Camden, Salem, and Gloucester) Chester County, Pennsylvania Delaware County, Pennsylvania Lancaster County, Pennsylvania Philadelphia County, Pennsylvania 42 Pennsylvania (* all Counties with the exception of Chester, Delaware, Lancaster, and Philadelphia) Cambridge Systematics, Inc. 53
60 Table 11. Summary of WILMAPCO Rail Tons by Direction Flow Type New Castle County Rail Tons a Cecil County Rail Tons b Total Rail Tons Inbound 2,015, ,000 2,213,214 Outbound 988,768 37,300 1,026,068 Internal 11, ,160 Through 15,222,447 28,610,504 43,832,951 Total 18,237,589 28,845,804 47,083,393 Note: Source a : Source b : There are no internal movements reported for rail Waybill data for Delaware TRANSEARCH database for Maryland. 54 Cambridge Systematics, Inc.


61 Rd0.wmv Rd1.wmv Rd2.wmv Rd3.wmv Figure 12. Potential WILMAPCO Bottleneck Locations New Castle County Source: WILMAPCO. Cambridge Systematics, Inc. 55


62 Table 12. Scoring Breakdown for Potential Bottleneck Locations New Castle County Source: WILMAPCO. 56 Cambridge Systematics, Inc.


63 Rd0.wmv Rd1.wmv Rd2.wmv Rd3.wmv Table 12. Scoring Breakdown for Potential Bottleneck Locations New Castle County (continued) Source: WILMAPCO. * Includes all locations with an average score above 1.0. Cambridge Systematics, Inc. 57

 Source:")

64 Table 12. Scoring Breakdown for Potential Bottleneck Locations New Castle County (continued) Source: WILMAPCO. * Includes all locations with an average score above Cambridge Systematics, Inc.
 Source: WILMAPCO.")
65 Rd0.wmv Rd1.wmv Rd2.wmv Rd3.wmv Table 12. Scoring Breakdown for Potential Bottleneck Locations New Castle County (continued) Source: WILMAPCO. * Includes all locations with an average score above 1.0. Cambridge Systematics, Inc. 59

66 Figure 13. Potential WILMAPCO Bottleneck Locations Cecil County Source: WILMAPCO. 60 Cambridge Systematics, Inc.


67 Rd0.wmv Rd1.wmv Rd2.wmv Rd3.wmv Table 13. Scoring Breakdown for Potential Bottleneck Locations - Cecil County Source: WILMAPCO. * Includes all locations with an average score above ** I-95 locations are based on a four-criteria scoring methodology (does not include freight generators). Cambridge Systematics, Inc. 61

68 Figure Annual Daily Traffic Volumes Source: WILMAPCO. 62 Cambridge Systematics, Inc.

69 Rd0.wmv Rd1.wmv Rd2.wmv Rd3.wmv Figure Volume/Capacity Ratio Source: WILMAPCO. Cambridge Systematics, Inc. 63

70 Figure Travel Speeds Percent Below Posted Speed Source: WILMAPCO. 64 Cambridge Systematics, Inc.

71 Rd0.wmv Rd1.wmv Rd2.wmv Rd3.wmv Figure Average Truck Percentages Source: WILMAPCO. Cambridge Systematics, Inc. 65


72 Figure Truck Traffic Generators Source: WILMAPCO. 66 Cambridge Systematics, Inc.


73 Rd0.wmv Rd1.wmv Rd2.wmv Rd3.wmv Figure 19. Aggregate Crash Score Source: WILMAPCO. Cambridge Systematics, Inc. 67