TOM MAZE TRANSPORTATION SEMINAR
|
|
|
- Edwin Jack Chandler
- 5 years ago
- Views:
Transcription
1 TOM MAZE TRANSPORTATION SEMINAR IOWA STATE UNIVERSITY APRIL 11, 2014 TONY FURST ASSOCIATE ADMINISTRATOR, SAFETY FEDERAL HIGHWAY ADMINISTRATION
2 RESEARCH SHRP2 Data Driven Analysis Problem Identification Evaluation Performance Metrics TZD Plans Strategic SHSP Tactical TIP/STIP; HSP; CVSP Investments (4E) Systemic / Spot CMF Funding HSIP, 402, 405, MCSAP, CVISN, State, Local 2


3 DATA-DRIVEN SAFETY APPROACH Roadway Data Crash Data Analysis & Stakeholder Input Traffic Data Safety Decisions Implementation of Investments / Improvements Evaluation of Benefits / Effectiveness
 Systemic Approach to Safety Tool- describes approach that considers risk as well as crash history to determine improvements (safety.fhwa.dot.")
4 SAFETY ANALYSIS TOOLS Highway Safety Manual (HSM) uses a science-based approach that allows safety to be quantitatively evaluated alongside traffic operations, environmental impacts and construction costs ( Systemic Approach to Safety Tool- describes approach that considers risk as well as crash history to determine improvements (safety.fhwa.dot.gov/systemic) IHSDM software suite supporting the predictive methods and techniques represented in Part C of the HSM ( SafetyAnalyst AASHTOware supporting the roadway safety management process represented in Part B of the HSM ( CMF Clearinghouse searchable database of over 4,000 CMFs that can support an agency's roadway safety management or project development process (cmfclearinghouse.org) 4
5 MIRE FUNDAMENTAL DATA ELEMENTS Consistent with State Safety Data Systems Guidance published December 26, 2012 MIRE (Model Inventory of Roadway Elements) FDE (Fundamental Data Elements) Needed to conduct enhanced safety analysis Potential to support other safety and infrastructure programs All public roads Required to comply with section 1112 of MAP-21 Establish a subset of the model inventory of roadway elements that are useful for the inventory of roadway safety; and Ensure that States adopt and use the subset to improve data collection


6 FHWA s RSDP Improved Data Collection & Analysis More Informed Decision Making Better Targeted Safety Investment TZD 6
7 RESEARCH SHRP2 Data Driven Analysis Problem Identification Evaluation Performance Metrics TZD Plans Strategic SHSP Tactical TIP/STIP; HSP; CVSP Investments (4E) Systemic / Spot CMF Funding HSIP, 402, 405, MCSAP, CVISN, State, Local 7
8 Site Analysis Approach SHSP RELATIONSHIP TO HSIP SHSP HSIP Planning Review and Incorporate SHSP Data/Analysis, Goals, & Emphasis Areas Demonstrate Consistency with SHSP Strategies Align Projects with SHSP Priorities & Action Plans Problem Identification Countermeasure Identification Project Prioritization Systemic Approach Data/ Design Standards Feedback HSIP Project List STIP Monitor and Track SHSP Implementation Implementation Schedule and Implement projects Use Results for SHSP Evaluation and Update Evaluation Determine Effects of Highway Safety Improvements 8

9 COORDINATED TRANSPORTATION SAFETY PLANNING 9

10 ANALYZE DATA ID PROBLEMS DEFINE EMPHASIS AREAS SET GOALS NHTSA approves Highway Safety Plan 14 Measures Commercial Vehicle Safety Plan Highway Safety Improvement Program 4 Measures FHWA evaluates Implement SAVE LIVES
11 RESEARCH SHRP2 Data Driven Analysis Problem Identification Evaluation Performance Metrics TZD Plans Strategic SHSP Tactical TIP/STIP; HSP; CVSP Investments (4E) Systemic / Spot CMF Funding HSIP, 402, 405, MCSAP, CVISN, State, Local 11

12 CRASH MODIFICATION FACTOR (CMF) CLEARINGHOUSE ( 12
13 CRASH MODIFICATION FACTORS CMF Clearinghouse 2013 Statistics 698 CMFs added from 59 studies Total: 3,207 star-rated CMFs; 1140 CMFs with no star rating CMF CH Webinar (12/16) Research Meets Practice: Identifying and Applying CMFs ~200 participants Recording, PPTs and Q&As available on CMF CH website CMF in practice series available 13


14 PROVEN SAFETY COUNTERMEASURES Roundabouts Road Diet Corridor Access Management Backplates with Retroreflective Borders Safety Edge Medians & Pedestrian Crossing Islands Enhanced Delineation & Friction for Horizontal Curves Pedestrian Hybrid Beacon Longitudinal Rumble Strips / Stripes on 2 Lane Roads
15 Systemic Approach to Safety Systemic Safety Improvement An improvement that is widely implemented based on high-risk roadway features that are correlated with particular crash types, rather than crash frequency. Systemic Problem Identification System-wide crash analysis Crash characteristics at the system level Select focus crash type(s) Select focus facilities Identify common characteristics 15


16 EVERY DAY COUNTS (EDC2) SAFETY INITIATIVES Launched in 2010, EDC is designed to encourage the rapid deployment of existing, proven technologies to shorten project delivery, enhance highway safety, protect the environment, and reduce congestion. The two safety initiatives in EDC 2 are: High Friction Surface Treatments Geometrics Intersection and Interchange
 are")


17 HIGH FRICTION SURFACE TREATMENT High Friction Surface Treatments (HFST) are resin-based pavement surfacing overlay systems: - exceptional skid-resistant properties - retains the higher friction property for a much longer time. Commercially available. Generally applied in short sections to improve spot locations where friction demand is critical. It is not used for pavement maintenance or continuous resurfacing, it is for spot treatment at specific (high crashes) locations, including urban, rural, and non-motorized locations.
 U-Turn")


18 Source: FHWA INTERSECTION AND INTERCHANGE GEOMETRICS Displaced Left Turn (DLT) U-Turn Intersections These proven innovative designs enhance safety and traffic by relocating or eliminating certain turning conflict points. Roundabouts Diverging Diamond Interchange
19 RESEARCH SHRP2 Data Driven Analysis Problem Identification Evaluation Performance Metrics TZD Plans Strategic SHSP Tactical TIP/STIP; HSP; CVSP Investments (4E) Systemic / Spot CMF Funding HSIP, 402, 405, MCSAP, CVISN, State, Local 19
 Process audits Vertical Alignment Corporate /")
20 PERFORMANCE BASED METRICS SMOKESTACK Acid Rain BILGE PIPING Hard-piped / crushed MARITIME SECURITY Perimeter Security SAFETY MANAGEMENT SYSTEMS (SMS) Process audits Vertical Alignment Corporate / On-the-ground
21 PERFORMANCE MEASUREMENT What performance are you measuring? system / process / personnel output / outcome How will you use the measure in decision making or problem solving? Are the metrics an immediate need for operational decision making or longer term - planning What is the measure you really need v. what you can currently measure? Proxy?
22 PERFORMANCE MEASUREMENT What data to collect, how much to collect, and what type of analysis to perform? Relationship of outcome to your ability to influence? Or do you control enough of the variables to affect the outcome? Dynamic / fluid environment Outcome = f(x) + f(y) +. Correlational / Causal How do you set targets? What methodology?
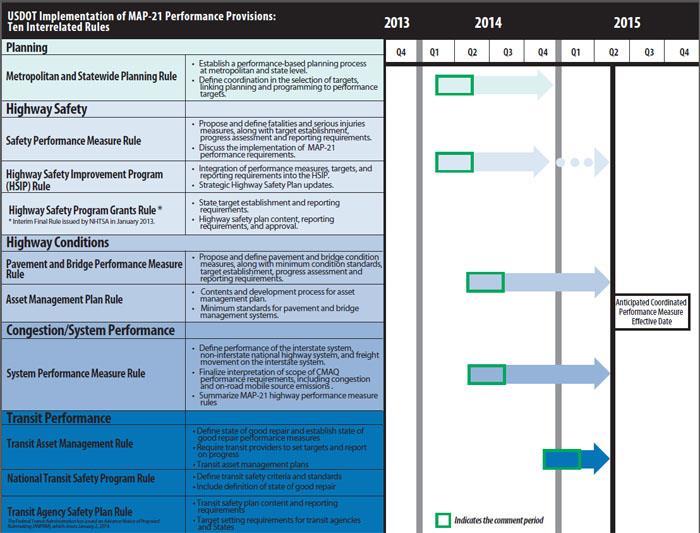
23 TWO NPRMs, DIFFERENT BUT RELATED Highway Safety Improvement Program NPRM Revises existing regulation (23 CFR 924) Safety Performance Measures NPRM Establishes new regulation (23 CFR 490) to implement MAP-21 Performance Management Requirements Defines safety performance measure requirements
24 MAP-21 CHANGES FOR HSIP Items Removed (no longer exist under MAP-21) Transparency Report High Risk Rural Roads set-aside and reporting requirements 10% flexibility provision for States to use safety funding per 23 U.S.C. 148(e) Items Added State Strategic Highway Safety Plan update requirements Subset of model roadway elements HSIP reporting content and schedule
25 PERFORMANCE MEASURES Focus the Federal aid program on the following national goals: 1) SAFETY; (1) 2) INFRASTRUCTURE CONDITION; (2) 3) CONGESTION REDUCTION; (3) 4) SYSTEM RELIABILITY; (3) 5) FREIGHT MOVEMENT AND ECONOMIC VITALITY; (3) 6) ENVIRONMENTAL SUSTAINABILITY; (3) 7) REDUCED PROJECT DELIVERY DELAYS (3)
26 SAFETY TPM Proposes measures for safety Fatalities / Serious Injuries Numbers and Rates Proposes method for States and MPOs to report targets and progress Proposes FHWA method to evaluate State target achievement Proposes requirements if targets are not achieved
27 27


 Safety")
28 RELATIONSHIP BETWEEN PROGRAM AND PERFORMANCE Highway Safety Improvement Program (23 U.S.C. 148) National Goals and Performance Management Measures (23 U.S.C. 150) HSIP Program Requirements (23 CFR 924) National Performance Management Measures (23 CFR 490) Safety Performance Measures Other Performance Measures (e.g. CMAQ, Pavement & Bridge Condition)
29 MAP-21 SAFETY RULEMAKINGS HSIP (23 U.S.C. 148; MAP-21 Section 1112) Published NPRM on: March 28, Comment period closes on: May 27, 2014 Docket Number: FHWA Safety PM (23 U.S.C. 150; MAP-21 Section 1203) Published NPRM on March 11, Comment period closes on: June 9, 2014 Docket Number: FHWA www. regulations.gov
 Systemic / Spot CMF Funding HSIP, 402,")
30 RESEARCH SHRP2 Problem Identification Behavioral Countermeasures Vehicle Countermeasures Infrastructure Countermeasures Potential changes to: AASHTO Green Book Roadside Design Guide Highway Safety Manual MUTCD Data Driven Analysis Problem Identification Evaluation Performance Metrics TZD Plans Strategic SHSP Tactical TIP/STIP; HSP; CVSP Investments (4E) Systemic / Spot CMF Funding HSIP, 402, 405, MCSAP, CVISN, State, Local 30

31 SHRP2 SAFETY PROGRAM VISION The Vision: to make a revolutionary improvement in highway saving thousands of lives This is the high-risk, high-payoff part of the overall SHRP 2 portfolio 31
32 SHRP2 STUDY DESIGN Two linked databases providing unprecedented detail on driver behavior and driver interaction with roadway features Naturalistic Driving Study (NDS) data VTTI, Virginia Tech record of every trip by volunteer drivers over months 2,800 drivers, male and female, all ages 1,900 vehicles on the road at any time Roadway (RID) data CTRE, Iowa State from mobile van data collection in study areas from state data and other sources 32

33 NDS STUDY DESIGN Largest Naturalistic Driving Study Ever Undertaken 2,900 primary drivers, all age/gender groups. 3,900 data years; 5 M trip files; 32 M vehicle miles 2 years of data collection Most participants 1 to 2 years Vehicle Types: All light vehicles including Passenger Cars 450 vehicles Minivans SUVs Pickup Trucks Six data collection sites Integration w/ detailed roadway information Data useful for next generation of researchers 150 vehicles 300 vehicles 33
 focus on data needed for lane departure and intersections curvature location, length,")


34 ROADWAY DATA OVERVIEW New data: collected at highway speed, about 12,500 centerline miles (both directions) focus on data needed for lane departure and intersections curvature location, length, radius; grade; cross-slope; lane number, width, type; shoulder type (width if paved); speed limit signs; medians; rumble strips; lighting; intersection location, number of approaches, and control type; videolog Existing data from state inventory: any available roadway information varies by site Supplemental data: traffic, weather; work zones; crashes; roadway improvements; laws; safety campaigns 34

35 BUFFALO, NEW YORK Blue: Collected in 2011 Red: Collected in miles in ,300 miles in % Urban 70% Rural 35
 Turn signals Vehicle network data Brake pedal activation ABS Gear position Steering wheel angle")
36 Multiple Videos Machine Vision Eyes Forward Monitor Lane Tracker Speed Accelerator Accelerometer Data (3 axis) Rate Sensors (3 axis) GPS Time Forward Radar Cellular Phone Records Illuminance sensor Infrared illumination Passive alcohol sensor Incident push button Audio (only on incident push button) Turn signals Vehicle network data Brake pedal activation ABS Gear position Steering wheel angle Seat Belt Information Airbag deployment Crash Data AADT Work Zone Winter Road Conditions Local Climatological Data NOAA Cooperative Weather Observer/Other Sources Nonrecurring Congestion Recurring Congestion Travel Time Data Reliability Aerial Imagery Speed Limit Data Speed Limit Laws Cell phone and text messaging laws Automated enforcement laws Alcohol-Impaired / Drugged Drivers laws Graduated driver licensing (GDL) laws State motor cycle helmet use laws Seat Belt Use laws Automated Enforcement Traffic Data - Continuous Counts (ATR) Traffic Data -Short Duration Counts Changes to existing infrastructure condition Roadway Capacity Improvements Innovative Treatments 511 Information Curvature Length Curvature Radius Grade (+ or -) Cross Slope/Super Elevation Lane Width/Type Paved Shoulder Width/Type Speed Limit Signs (location) Intersection Information Presence of Lighting Presence of Medians Presence of Rumble Strips Laws Data Traffic Data Behavioral Data Crash Data Roadway Data Weather Data
37 Lighting: N/A Rumble Strips: N/A Unpaved Shoulder: N/A Grade, Cross Slope Paved Shoulder 3 Mix/Combo N/A 3 Mix/Combo 4 Mix/Combo Median Flush N/A Flush (Painted) N/A Flush (Painted) N/A Flush Paint. Paint. Lanes Thru Lane: 1 (12 ) Thru Lane: 1 (11 ) Right Turn: 1 Thru Lane: 1 (12 ) Flush Paint. Lanes Median Thru Thru Lane: 1 (12 ) Lane: Thru Lane: 2 (11 ) Thru Lane: 1 (12 ) Thru Lane: 1 Left Turn Lane: 1 1 (14 ) Deccel. Lane: 1 Accel. Lane: 1 (21 ) Deccel. Lane: 1 N/A Flush (Painted) N/A Flush (Painted) N/A Flush Paint. Paved Shoulder 2 Mix/Combo 0 Mix/Combo 3 Mix/Combo 2 Mix/Combo Grade, Cross Slope Unpaved Shoulder: N/A Rumble Strips: N/A
38 THE BIG PICTURE Size: the file is huge 4 petabytes = kilo, mega, giga, tera, peta 4,000,000,000,000,000 5 M trips; 32 M miles of driving Complexity: different data types Categorical data constant over a trip: driver age, vehicle type Sampled data: collected at different rates (once a trip up to 640 Hz during a crash): speed, acceleration, GPS position, radar, Video data from 4 cameras; must be interpreted and reduced Automated reduction: lane tracker, head tracker Manual reduction: all other items for specific analyses Roadway data linked to trip data via GPS Privacy considerations: personally-identifying data 38
39 NEAR TERM ACTIVITY Intent is to: Create an accelerated path to implementation that helps drives down crash numbers Ingrain the NDS research into AASHTO committee activities, considerations Patterned after current NDS pilot projects Demonstrate full spectrum of implementation process - concept to countermeasure Utilize $ 5.8M of implementation funds This activity will not delay the overall completion of the NDS database Vetted and recommended by the AASHTO Implementation Task Force 39
40 FHWA (STAC) SAFETY TRAINING AND ANALYSIS CENTER To enable and accelerate the use of SHRP2 Safety Data in the research community, especially as it relates to the design and operations of roadways. It will serve as an incubator for new ideas and a training ground for practitioners and researchers to help increase the demand for services from the broader research community. The STAC will focus primarily on: providing a learning and training opportunity for State DOTs to help them develop greater understanding of the data and its potential uses. providing the opportunity for researchers, graduate students and fellows to experiment and work with SHRP2 safety data so that they can take that experience back to their work environment. Will be hiring 2 positions to staff the STAC job announcements will be posted to USA jobs shortly. 40
41 RESEARCH SHRP2 Data Driven Analysis Problem Identification Evaluation Performance Metrics TZD Plans Strategic SHSP Tactical TIP/STIP; HSP; CVSP Investments (4E) Systemic / Spot CMF Funding HSIP, 402, 405, MCSAP, CVISN, State, Local 41