Measuring Supportability to Enhance Decision-Making
|
|
|
- Caitlin Bridges
- 5 years ago
- Views:
Transcription

1 Rob Willis Rob Vijay Chachra Measuring Supportability to Enhance Decision-Making A Method for Quantifying the Relative Benefits of Support System Improvement Alternatives ASI Proprietary Statement: This document and any attached materials are not to be disseminated, distributed, or otherwise conveyed throughout your organization to employees without a need for this information or to any third parties without the express written permission of Andromeda Systems Incorporated
2 Objective Introduce and Discuss a Method for Defining, Quantifying, Improving and Optimizing Supportability Throughout the Life Cycle of Physical Assets Present Results of an Actual Case Study for the Department of Defense
3 DoD Definition of Supportability Supportability : The inherent quality of a system - including design, technical support data, and maintenance procedures - to facilitate detection, isolation, and timely repair/replacement of system anomalies. This includes factors such as diagnostics, prognostics, realtime maintenance data collection, 'design for support' and 'support the design' aspects, corrosion protection and mitigation, reduced logistics footprint, and other factors that contribute to optimum environment for developing and sustaining a stable, operational system." Designing and Assessing Supportability in DOD Weapon Systems: A Guide to Increased Reliability and Reduced Logistics Footprint - page 12.

4 Simplified Definition of Supportability Supportability is the ability and effectiveness of an asset, along with its support system, to achieve its desired performance over the life of the asset. Supportability is: Influenced by both the design and of the asset and the design of the support system Impacted by operating environment A function of Reliability, Availability, Cost, and Safety

5 Problem Statement Currently, there is no quantitative measure of Supportability. Consequently, there is no method to evaluate the total impact to supportability for support system alternatives. Program Managers and Fleet Owners often make decisions that are sub-optimal, and fail to increase overall performance of the support system.


6 Today s Process Identifying top degraders and performing a root-cause analysis on selected components. For a given system in a finite time period, analysts: Dive into the Operational & Maintenance Data Understand which components were either the leading causes of system failure, or Leading drivers of overall sustainment cost Analyze the Support System of these Components Identify the root causes that can be addressed Obtain improvement in component metrics Analyze a Set of Viable Interventions Against the Root Causes Select the one that offers the best benefit to component performance Perform Business Case Analyses Drawback. This is a constrained optimization problem and addresses a degrader which often involves shifting resources away from other components in the logistic system; thereby compounding the problem. 6
7 Current method to address the problem Currently Supportability is measured indirectly by using multiple discrete metrics Reliability - Probability of no failures in a defined time period (R, MTBF etc..) Availability Percentage of time system available for use (Ao) Maintainability Time required to return an asset to service after failure (MTTR, EMT) Cost Life Cycle Costs, O&S Costs Because these metrics are not independent, using them to individually evaluate supportability will often not provide a complete picture In this presentation, we will present a method to measure supportability using an index - S

8 The S Concept What changes to the logistics support structure can be cost-effectively implemented to move a weapons system from current performance to the targeted performance objective providing the highest possible supportability? Where is my Supportability dollar best spent? 8
+ b(m)+ c(s)+ d(s)+ a(t)+ a(t)+ a(com) Calculate the contribution of S to KPPs and KPIs S = f } Ava, ME, Log Ft Print, FMC, NMC,")
9 Calculating Supportability S = f (A o, R m, & O&S Costs) Expressed terms of PSE S > f } Maint Plan, Manpower, Supply, Supt Equip, Tech Pubs, Comp Resources, Facilities, etc (mmssttcomfapad) Calculate the contribution of PSE elements to S S = f } a(m)+ b(m)+ c(s)+ d(s)+ a(t)+ a(t)+ a(com) Calculate the contribution of S to KPPs and KPIs S = f } Ava, ME, Log Ft Print, FMC, NMC, PMC 9
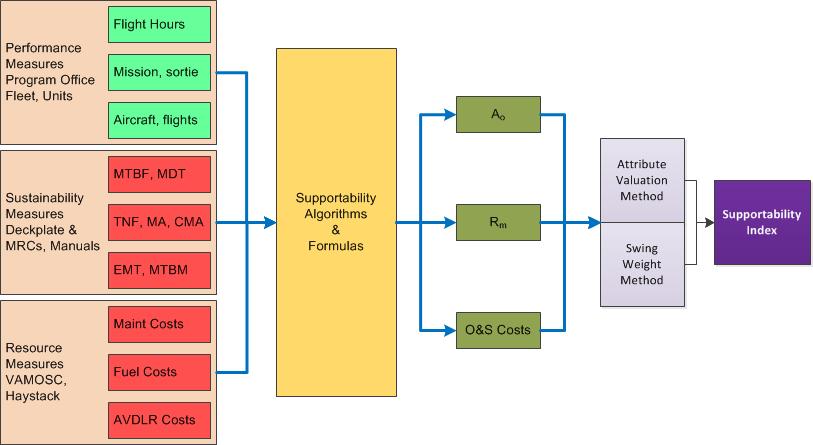

10 Supportability Computation Process 10
11 Improving Supportability ( S ) Supportability Growth Curve to: Understand How Changes To Any Variable In the Logistic Solution Affect the Performance Of the Entire Weapon System Use This Capability To Find The Logistic System Variables That Have The Greatest Impact On Overall Weapon System Performance; Findings Include: Component-level Variables such as Failure Rates, Spares Allocation, & Maintenance Turn-around Times Other Variables, i.e. Labor Availability & Cost, Support Equipment Availability & Cost, Transportation Times & Cost at any of the Support Sites Analysis Results In A Modified List Of Top Degraders That Point The Analyst In the Direction of Those Metrics Whose Change Would Yield the Greatest Overall System Impact Supportability Index Computations & SGC Plot; see Figure MS-A MS-B MS-C IOC FOC Interventions Must Be Evaluated Against This List Of Top Degraders By Taking Into Account the Trade-offs That Are Inherent & Understand How They Impact Other System Variables 1.0 S Index 0.0 S=0;T=0 are Starting Pts For SGC Threat, Mission, & Technology At Each MS Design Determine Ambitious Design Objectives Are Adjusted to Objectives Meet KPP Realities Design Objectives Supportability Growth Curve Like & Similar Thresholds SGC is Envisioned to Improve Over Past Thresholds But Not Reach Design Objectives LCC Time S is a Function of KPPs Data From Like & Similar Systems at MS Are Essential 11

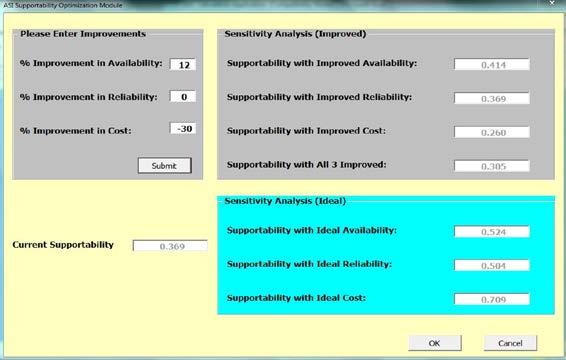
12 Optimizing Supportability ( S ) Supportability Optimization is the process of maximizing the effectiveness of the support system in terms of asset performance and cost within given constraints. In other words, it is getting what you want out of your physical assets for the least cost over the long-haul, based on robust analytics, not just guesses. Supportability Optimization will answer the question: Where will my next dollar provide the most impact on asset performance?
13 Case Study DoD s first prototype of utilizing the S-Index occurred when a DoD Program Office wanted to compare alternate maintenance concepts for the Armament Equipment Organizational Level to Original Equipment Manufacturer concept promised increased reliability, increased availability The prototype identified a Like and Similar (L&S) launcher that was being repaired at an Intermediate Level Identified S-Index for both maintenance concepts, performing sensitivity analysis across multiple variables. Provided recommendations based on quantifiable, defendable analysis that allowed Program Managers to clearly make decisions on the preferred maintenance concept.

14 Performing Like and Similar Analysis Our process for performing Like and Similar Analysis: 1. Photo comparisons 2. Drawing Comparisons 3. Feature Comparisons 4. Capabilities/Technology Comparisons 5. Parts Comparisons 14

15 Like & Similar Comparison Photo Comparison BCS Launcher New Launcher 15

16 Like & Similar Comparison Drawing Comparison BCS Launcher New Launcher 16

17 Like & Similar Comparison # BCS # New 1 Electrical power system 1 Electrical power system with BIT 2 Non pyrotechnic 2 Non pyrotechnic 3 One rack per wing pylon 3 One rack per wing pylon 5 Rail structure, Actuator, Dampener, Detent Assemblies Feature Comparison 5 Rail Structure, Actuator, Dampener, Detent Assemblies 17
18 Like & Similar Comparison Parts Comparison # BCS # New 1 Linear Electro-Mechanical Actuator 1 Linear Electro-Mechanical Actuator 2 Forward & Aft Detent Assembly 2 Forward & Aft Detent Assembly 3 Dampener Assembly 3 Dampener Assembly 4 Shoulder Shaft 4 Shoulder Shaft 5 Remote Control Lever 5 Remote Control Lever 6 Helical Compression Spring 6 Helical Compression Spring 7 Retainer Assembly 7 Retainer Parts & Pieces 8 Bell Crank Assembly 8 Bell Crank Assembly 9 Missile umbilical interface 9 Missile umbilical interface 10 D.C. Solenoid 10 D.C. Solenoid 11 Forward & Aft Fairing Assemblies 11 Forward & Aft Fairing parts & pieces 18
19 Comparison Results Comparison Check % Look & feel from photo comparison 90% Design & technology from drawing comparison 85% Capabilities from feature comparison 90% Similarity from sub-assembly comparison 90% Parts comparison 80% Summary (average of comparisons) 87% 19
20 Supportability Metrics BCS New Metric Value Metric Value Fiscal Year FY-2010 Fiscal Year One year Aircraft Aircraft # of Aircraft 339 # of Aircraft 339 Flight Hours (0.75) 92,359 Flight Hours (0.75) 76,275 Flights (0.75) 57,831 Flights (0.75) 38,137 Replacement Cost $ 79,400 Replacement Cost $ 85,400 # of Removals 363 # of Removals 76,275/74=1,030 O-level CMA 5,054 O-level N/A I-level CMA 80 I-level CMA N/A Net repair cost $ 31,760 Net repair cost $ 34,160 AVDLR Costs $ 4,986,320 AVDLR Costs $ 35,210,189 # of BCMs 157 # of BCMs /R&R 1,030 20

21 Supportability Analysis BCS S index = ʄ(A o, R m, O&S Costs) # Variable Calculation 1 A o R m FHs 3 O&S Costs $ 6,420,640 21

22 Supportability Analysis New S index = ʄ(A o, R m, O&S Costs) # Variable Calculation 1 A o R m FHs 3 O&S Costs $ 35,481,008 22
23 Summary Comparison BCS New Variable Calculation Variable Calculation Availability Availability Reliability (MTBF) FHs Reliability (MTBF) FHs O&S Costs $6,420,640 O&S Costs $35,481,008 Cost/Flight Hour $69.52 Cost/Flight Hour $ Cost/Aircraft $18,940 Cost/Aircraft $104,664 Supportability Supportability New System projected 10% improvement in Availability, at an increase of $29 Million (yearly estimate) in Sustainment Costs 23

24 Level of Repair Analysis Inputs 24
25 Summarized Life Cycle Cost Estimates Note 1: New Launcher Based on 8000 hour MTBF and planned flight operations Analysis based on Mil Std 1390D & NAVSUP RIMAIR / ARROWS sparing process 25

26 Level of Repair Analysis Recomendations 26
27 Recommendations & Options Complete a maintenance task analysis (MTA) on all AME MTA should be driven and traced to FMECA/RCM Analysis Consider O-plus as an option to mitigate costs and improve Supportability Adopt BCS maintenance concept Conduct Sensitivity Analysis to evaluate various scenarios and impact to Readiness and Supportability 27
28 Questions