Presentation to Agencies
|
|
|
- Jordan Blake
- 5 years ago
- Views:
Transcription

1 GTA WEST CORRIDOR PLANNING AND EA STUDY-STAGE STAGE 1 Presentation to Agencies May 2010
2 Outline of Presentation 1. Study Background and Process 2. Transportation Development Strategy Group #1 Optimize Existing Networks Group #2 New or Expanded Non-Road Infrastructure 3. Assessment Findings and Trade-Offs Group #3 Widen / Improve Roads Group #4 New Transportation Corridors 4. Next Steps 2
3 Study Purpose To proactively plan for future infrastructure needs by: Examining long-term transportation problems and opportunities to the year 2031 Considering options to provide better linkages between Urban Growth Centres in the Corridor Preliminary Study Area as identified in the Growth Plan, including: Downtown Guelph Downtown Milton Brampton City Centre Vaughan Corporate Centre 3
4 EA Study Process EA Terms of Reference Individual Environmental Assessment Transportation EA Stage 1 Development EA Stage 2 Strategy Class EA for Design Construction System Planning (e.g. roads, transit, rail, marine, air) Alternative Methods (e.g. route location for new provincial highways/transitways) MOE Review/ Approval Alternatives to be pursued by other jurisdictions Future MTO studies / initiatives MOE Review/ Approval 4
5 Study Approach - Building Block STAGE 2: Combination Alternatives Key Steps: Develop Reasonable Combination Alternatives To Address Problems & Opportunities Assess Combinations to Identify Advantages & Disadvantages Widen / Improve Roads 3 Group 2 plus Widen / Improve Roads & Highways Decision Trade-offs Environment New Transportation Corridors Elements of Group 3 plus New Transportation Group Community Corridors Group 4 Economy Transit Rail Roads & Highways Air New/Expanded Non-Road Infrastructure Group 1 plus Transit Rail Optimize Existing Networks Marine TDM TSM Inter-modal Air Marine Group Group 2 1 5
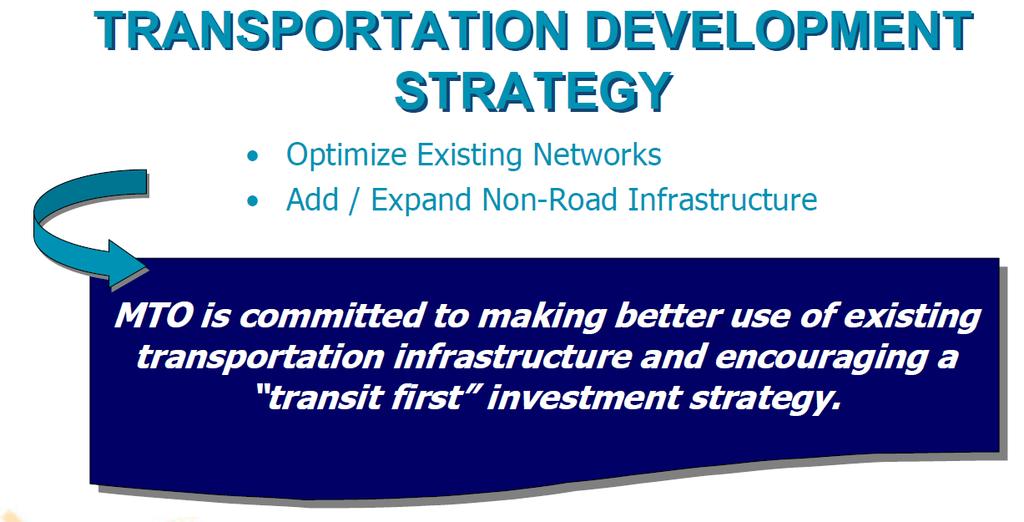
6 Group 1 Optimize Existing Network Group 2 Add / Expand Non-Road Infrastructure 6
7 Optimize Existing Networks Builds upon strategies in the Regional Transportation Plan (RTP), GO 2020 strategic plan and municipal transportation master plans: Improving access to transit stations - mobility hubs Making active transportation viable Improving schedule/fare integration Providing real time trip information Optimizing commuter rail system (longer GO trains 12 cars) More aggressive use of TDM / TSM Goal: Active Traffic Management strategy aimed at improving performance of existing transportation system by reducing demand and improving system efficiency Additional initiatives identified by the study team include: Expanded use of bus bypass shoulders Enhance incident/congestion management Expanded use of ramp metering HOV / Transit bypass lanes Speed harmonization Support Metrolinx and Smart Commute in expanding their TDM Programs 7


8 Optimize Existing Networks Expand Use of Bus Bypass Shoulders Wide Wide Shoulders Shoulders are are provided provided to to enable enable buses buses to to bypass bypass queues queues during during congestion congestion 8


9 Optimize Existing Networks Enhance Incident / Congestion Management MTO s MTO s COMPASS COMPASS system system utilizes utilizes sensors sensors to to transmit transmit data data to to Traffic Traffic Operations Operations Centre Centre Incident Incident Management Management Congestion Congestion Management Management 9


10 Optimize Existing Networks Expanded Use of Ramp Metering Regulated Regulated vehicle vehicle access access to to freeway freeway through through computer-controlled signals signals on on ramps. ramps. End End of of queue queue detectors detectors prevent prevent backups backups 10

11 Optimize Existing Networks HOV / Transit Bypass Lanes Transit Transit and and High High Occupancy Occupancy Vehicles Vehicles use use bypass bypass lanes lanes on on ramps ramps 11

12 Optimize Existing Networks Speed Harmonization A traffic traffic management management system system similar similar to to MTO S MTO S COMPASS COMPASS system system is is used used to to monitor monitor travel travel data. data. Cameras Cameras and and sensors sensors below below the the roadway roadway structure structure measure measure traffic traffic flow flow Speed Speed limits limits are are automatically automatically adjusted adjusted when when congestion congestion thresholds thresholds are are exceeded exceeded Maintains Maintains a constant constant flow flow vs. vs. stop stop & go go 12


13 Optimize Existing Network Support Metrolinx & Smart Commute in Expanding their Programs Current Operation Partnership between Metrolinx and area communities Coordinates TDM services throughout GTHA Engages employers to encourage employees to participate in trip reduction programs How can it be Improved? Support: Enhancements to current programs Expansion of these programs beyond the GTHA Expansion of MTO s Carpool Lot Program Explore opportunities to provide funding assistance Potential to remove policy barriers 13
14 Optimize Existing Network 14

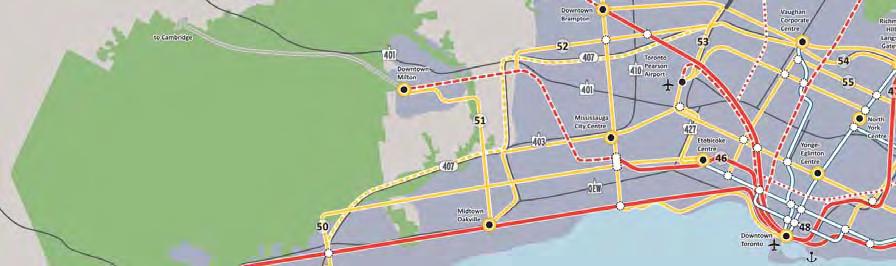
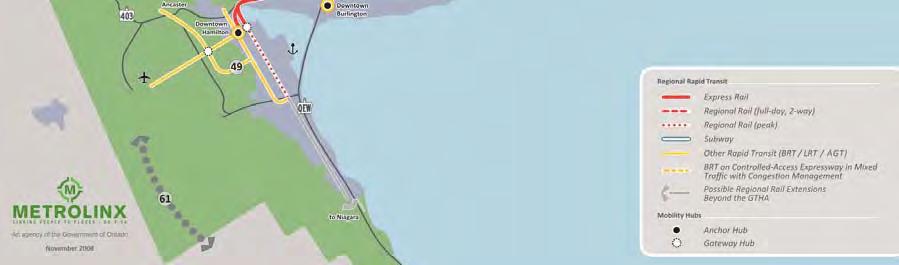
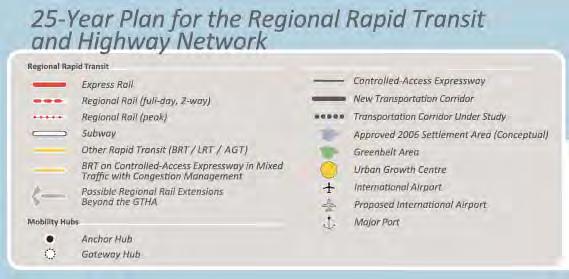

15 Add / Expand Non-Road Infrastructure Significant transit transit service service expansion envisioned by by the the RTP RTP and and GO GO
16 Add / Expand Non-Road Infrastructure Goal: focus on improving existing and/or providing new nonroad infrastructure and transit, building on the recommendations of the Metrolinx RTP and GO 2020 Additional initiatives recommended by the study team: New / expanded transit connections west of Pearson airport Enhanced transit system servicing areas west of Pearson airport and providing connection to the airport New inter-regional transit links between western Urban Growth Centres Potential exists for a Western Web transit system utilizing existing rail lines Explore revisions to municipal DC policies to support local transit Support freight rail and marine goods movement initiatives 16

17 Add / Expand Non-Road Infrastructure 1 st Principle Inter-regional Links to Toronto: Enhance spine network by connecting UGCs to Toronto Current initiatives: Proposed GO Georgetown Line expansion: Georgetown Acton Guelph Breslau Kitchener Potential GO Milton Line expansion: Milton Campbellville Puslinch Cambridge Future initiatives: GO 2020 future potential service extension to Brantford 17
 Potential improvements to the Cambridge to Brantford corridor could present opportunity for rapid transit Future initiatives: potential")
18 Add / Expand Non-Road Infrastructure 2 nd Principle Linking UGCs Develop web network by connecting western UGCs to one another Current initiatives: Proposed Waterloo LRT: Rapid transit linking Waterloo, Kitchener, and Cambridge (initially BRT in Cambridge) Potential improvements to the Cambridge to Brantford corridor could present opportunity for rapid transit Future initiatives: potential inter-regional transit connecting UGCs (Inter-Regional Transit Feasibility Study) 18
 GO rail expansions would service Acton, Breslau, Campbellville, Puslinch GRT bus route to St.")
19 Add / Expand Non-Road Infrastructure 3 rd Principle UGCs as Gateways Identify rural areas that warrant transit connections and link to spine network through UGCs for access to Toronto Current initiatives: GO bus stop in Aberfoyle (in Puslinch) GO rail expansions would service Acton, Breslau, Campbellville, Puslinch GRT bus route to St. Jacobs and Elmira Future initiatives: MTO initiating further area studies with focus on transit 19

20 Add / Expand Non-Road Infrastructure Rail Network: Several existing and abandoned rail corridors exist beyond study area Potential to implement commuter rail transit on existing tracks or on reconstituted abandoned tracks 20

21 Add / Expand Non-Road Infrastructure Support Freight Rail Current Condition Numerous conflicts: passenger rail and freight rail services at-grade road/rail crossings How can it be improved? Removal of constraints to improve freight and passenger rail operations and increase utilization Coordinate with CN Rail, CP Rail and Metrolinx to identify conflict points Support potential future initiatives to remove freight rail/passenger rail conflicts Provide grade separations at road/rail crossings Support Ontario-Quebec Continental Gateway strategy 21
22 22
23 ~ GROUP #3 & GROUP #4 ANALYSIS STREAMS~ Transportation Analysis Triple Bottom Line (Environment, Economy, Community) Cost / Constructability 23
24 Widen / Improve Roads & New Transportation Corridors Analysis has been divided into the following work streams : Environment Community Economy Transportation Triple Bottom Line 24
25 Transportation Analysis - Approach Key steps in undertaking the transportation analysis included: Update land use assumptions based on recent municipal updates Used most recent update of the GGH model to provide an improved representation of future travel characteristics Analyze future travel demands & deficiencies for Base Case Base Case includes: MTO planned improvements (5 Year Program) Municipal improvements identified in Transportation Master Plans RTP/GO 2020 Incorporate auto and truck trip reductions from Group #1 and Group #2 initiatives Develop Group #3 and Group #4 alternatives based on addressing Base Case lane deficiencies Model combinations of NGTA & Group 3/4 alternatives 25
26 Economic Analysis Approach TREDIS Transportation Economic Development Impact System Models the incremental impact of increased transportation capacity on different sectors of the economy, as well as transportation benefits to consumers/companies Transportation benefit: Time savings, incident reductions, reliability Economic Impact: Jobs, Output TREDIS is driven by the transportation modelling quantifies the economic impact based on the performance of each alternative in the transportation modelling Qualitative assessment: Support for employment and economic growth patterns How well do options serve economic growth areas How well do they fit with local economic development strategies 26
27 Environment and Community Approach Factors and criteria based on approved EA ToR Assessment considered potential impacts to: Natural Environment Socio-Economic Cultural Environment Fish and Fish Habitat Land Use Planning Policies Built Heritage Terrestrial Ecosystems Land Use / Community Archaeology Groundwater Noise Cultural Heritage Landscapes Surface Water Designated Areas Air Land Use / Resources Municipal Services (Utilities) Contaminated Property 27


28 Environment and Community Approach Highway widening impacts have been assessed at a broad level: Translating lane requirements from the transportation analysis to typical widening cross sections, interchange reconfigurations, etc. Developing combined GIS footprint based on typical cross-sections and interchange footprints Typical Widening Footprint Typical Interchange Footprint 28
29 Environment and Community Approach Additional constructability/costing completed for the following special areas : Highway 407ETR/400 interchange Highway 407ETR/427 interchange Highway 407ETR/410 interchange Highway 407ETR/401/Proposed BATS Corridor interchange Proposed Highway 407 Transitway For the new corridor alternatives (Group #4): Impacts associated with widening were assessed based on similar methodology Impacts for new corridors were assessed based on potential to impact significant environmental and community features Exact location of new corridor is not known Specific impacts would be identified during next phase - if new corridor is recommended 29
30 Cost Analysis Approach High level cost estimates for Group #3 and Group #4 alternatives were developed based on: Applying unit costs derived from secondary sources for: typical highway widening cross-sections new interchanges interchange reconfigurations new structures structure widenings structure replacements Developing specific cost estimates for each special area 30
31 Group 3 and Group 4 Road Alternatives 31

32 Group #3 32
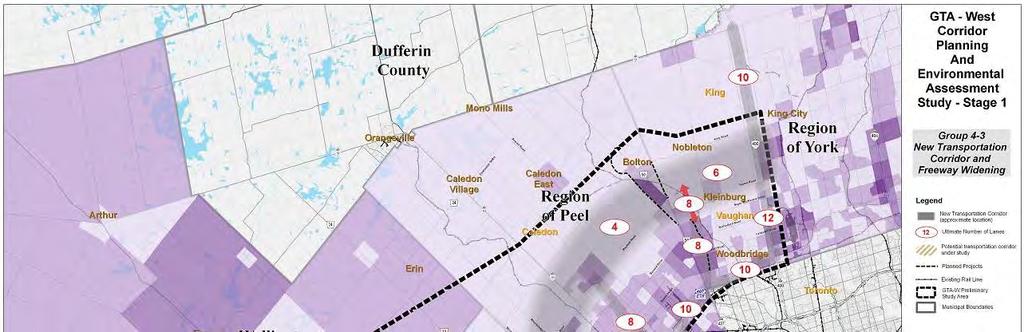
33 Group #4 Alternative
34 Group #4 Alternative
35 Group #4 Alternative
36 Group #4 Alternative
37 Group #4 Alternative
38 Road Alternatives and Related Assessment Findings 38
39 Key findings: Transportation Analysis Findings Addition of highway capacity in Group #3 and Group #4 will only attract the equivalent of one arterial lane of new auto trips away from transit through Peel Region Minimal change at Wellington and Waterloo boundaries Overall PM Peak trip containment and transit mode split are not significantly affected inter-regional commuter trips are a small component of total trips in each municipality Region of Peel 16% Transit Mode Share reduces to 15% with Group 4 alternatives Region of Halton 11% Transit Mode Share reduces to 10% with Group 3 and 4 Alternatives 39
40 Sensitivity Test New Corridor as a Truck Only Facility Tested NGTA Alt 4-3 (connection to 401 West of Milton) in combination with GTAW Alt 4-3 (Connection to 401 West of Milton) For Study Area Increased truck demand on new corridor by 400% Truck volumes range from 1,600 veh/hr/dir to west of Brampton to over 2,200 veh/hr per direction between Highway 427 and 400 Equivalent of 3,200 to 4,000 passenger cars per hour (equivalent to 2 Freeway lanes per direction) Most trucks are to/from Hwy 400 (via north), industrial areas via Hwy 400 south, Hwy 427, and Airport Road More analysis required to assess the impact to compare to other alternative Segment PM PK Hr Truck Vol (car equivalent) EB WB Hwy 401 (W. of Milton) to HP BATS 1660 (3320) 1580 (3160) HP BATS to Hwy (3530) 1984 (3968) Hwy 410 to Hwy (3400) 1875 (3750) Hwy 427 to Hwy (4428) 1690 (3380) 40
41 Transportation Analysis Findings Key findings: Overall transportation evaluation also considers other benefits such as Support for inter-regional transit and degree of modal integration Support for goods movement Connectivity between population and employment centres Support for tourism Corridor Alternatives 4-3, 4-4, 4-5 address future capacity needs and provide highest overall transportation benefits Corridor Alternative 4-1 addresses future capacity needs but is too limited in scope to provide significant benefits Widening Alternative (3-1) addresses future capacity needs but does not provide improved network connectivity, significant delay savings, support for transit / tourism, or modal integration benefits Corridor Alternative 4-2 addresses future capacity needs and provides moderate overall transportation benefits 41
42 Transportation Analysis Key Outcomes Assessment carried out to date suggests that: Group 4 alternatives (other than 4-1) outperform Group 3 in terms of traffic operations, commuter travel and people movement. Alt 4-1 too limited in scope to perform well in any category Group 4 alternatives perform better for most people movement criteria Provide network redundancy and route/network flexibility Result in lowest amount of inter-regional traffic on local roads Provide better modal integration, balance and choice for movement of people and goods movement (i.e. between communities, transit hubs, terminals and employments centres) Group 4 alternatives (except 4-1) provide good linkages to population and employment centres Alternative 3-1 and Alternatives 4-2 to 4-5 provide similar improvements in auto and transit travel times between Urban Growth Centres Alternative 3-1, however, would not provide a higher order linkage between Urban Growth Centres Alternative 4-3, 4-4 and 4-5 performed well in all factor/criteria areas 42
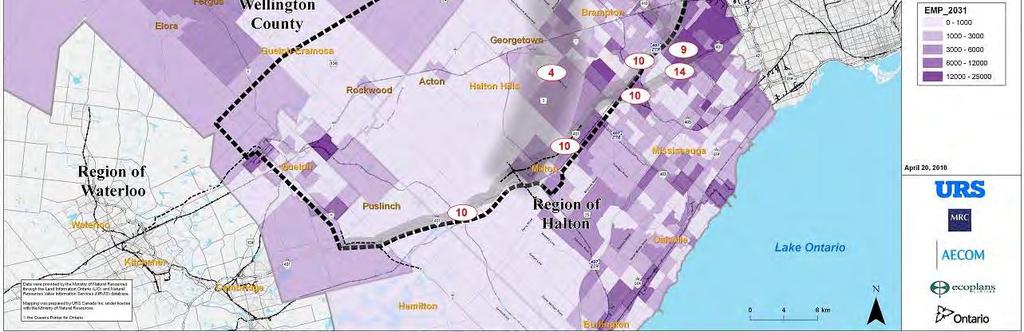
43 Economic Analysis - Alternative 4-3 Vaughan +120,000 jobs Guelph +32,000 jobs Brampton/Caledon +188,000 jobs Milton/Halton Hills +109,000 jobs Waterloo +130,000 jobs 43
44 Alternative
45 Alternative
 The results demonstrated that all alternatives resulted in similar savings and similar benefits Alternative 3-1")
.")
46 Economic Analysis Impact Assessment An economic benefits analysis was completed to explore: Travel cost savings Long-term economic benefits (jobs and GDP) The results demonstrated that all alternatives resulted in similar savings and similar benefits Alternative 3-1 produced slightly greater benefits Sources: Travel demand characteristics of alternatives. Preliminary calculations by EDR Group through Transportation Economic Impact System (TREDIS). Benefit above includes savings of personal time and is not limited to economic impacts. 46
47 Economic Analysis Impact Assessment Total Economic Impacts in Greater Golden Horseshoe Alternative Jobs in GGH GDP ($mil) in GGH GTAW ,500 $1,068 GTAW ,700 $996 GTAW ,600 $990 GTAW ,800 $1,001 Jobs rounded to the nearest 100, GDP in millions $CDN Sources: Travel demand characteristics, employment by place of work. Preliminary calculations by EDR Group through Transportation Economic Impact System (TREDIS). 47
48 Economic Analysis Findings Group 4 connections among major employment nodes allows for circumferential travel of workers and goods supports supply chains Transit opportunity for circumferential travel increases labour market mobility to major employment centres, but widenings produce this as well/better Widenings serve most growth areas well (if 427 and 410 are extended and Brampton North-South corridor implemented very well) Argument for connection to Guelph does not seem strong from an economic development perspective - stronger from a commuter perspective Considerable benefit to Kitchener/Waterloo Region from all alternatives Connection to Milton/Halton Hills is important; nature of employment growth is highly dependent on freeway access and capacity, much greater amount of growth Economic impact modelling shows strongest output and jobs benefits: To manufacturing sectors, no significant difference among options To distribution/logistics sectors, 3-1 is strongest, followed by 4-3 To business/professional services, public sector 3-1 is strongest, others equal New corridors create redundancy, but difficult to quantify value 48
49 Economic Analysis Summary Economic Impact: No significant advantage between Group 3 and Group 4 in transportation economic benefits Group 3-1 provides strongest economic impact benefits, but not by much Economic Development and Growth Patterns GTAW is the distribution hub of Canada heavy dependence on timely movement of goods Group 3-1 serves most employment areas well; falls short of some growth areas and does not support circumferential supply chain and distribution relationships Group 4-3 best conforms to growth patterns and provides service to economic growth areas that are most dependent on road network Overall Group 4-3 strongest in terms of supporting economic growth patterns; however 3-1 provides stronger economic benefits to some industries 49
50 Environment and Community Approach Factors and criteria based on approved EA Terms of Reference Assessment considered potential impacts to: Natural Environment Socio-Economic Cultural Environment Fish and Fish Habitat Land Use Planning Policies Built Heritage Terrestrial Ecosystems Land Use / Community Archaeology Groundwater Noise Cultural Heritage Landscapes Surface Water Designated Areas Air Land Use / Resources Municipal Services (Utilities) Contaminated Property 50
51 Natural Environmental New Escarpment crossings and Greenbelt impacts Group 4 - New Corridor Sections # of New Escarpment Crossings Highway Length through Greenbelt (km) Approximate Length of New Corridor (km) Sensitive and Significant Features Group 4 - New Corridor Sections Watercourses Evaluated Wetland Complexes Designated Features (ESAs, ANSIs, etc.) Wildlife Species at Risk (SAR) Significant Woodlands (linear distance km)


52 Natural Environment Group 3-1 has the least amount of impact to natural environment All Group 4 alternatives cross Humber River and associated valley, trails, wildlife corridors - impacts of the new crossing can be mitigated through route selection and design Humber River near Kleinburg Group 4-1, 4-2 and 4-3 alternatives have moderate impacts - some can be mitigated through route selection and design Credit River in Norval 52


53 Natural Environment Groups 4-4 and 4-5 have long sections through the Greenbelt, across the Niagara Escarpment and in rural areas where some sensitive features cannot be avoided because of their size. These alternatives have a high potential to impact the natural environment. Wolf Lake at Terra Cotta Conservation Area Rockwood Conservation Area 53

54 Land Use/Social Environment Group 3-1 does not provide sufficient support for municipal land use plans and future growth Group 3-1 impacts: 43 agricultural properties 23 residential properties 22 industrial properties 20 commercial properties Group 3-1 also has significant impacts to municipal infrastructure at Highway 407, east of Highway 427 Groups 4-1, 4-2 and 4-3 alternatives address growth and land use pressures in York, Peel and Halton Regions and are more compatible with municipal planning goals. Group 4 impacts to residential properties and community features are fewer and can be minimized through the route selection process. 54
 17 27 32 35 26 Groups 4-4 and 4-5 impact agricultural land uses through the Greenbelt in north Halton and Wellington County and have a higher potential")
55 Agriculture Impacts to agriculture can be measured through: loss of Class 1 soils potential to fragment large farming operations Loss of Class 1 Soils (Linear distance in km) Group 4 New Corridor Sections Class 1 Soils (km) Groups 4-4 and 4-5 impact agricultural land uses through the Greenbelt in north Halton and Wellington County and have a higher potential to fragment farming operations, particularly
56 Air Quality and GHG s Overall, the alternatives are relatively similar Alternative 3-1 has slightly lower overall network emissions of both air pollutants and GHG's than the Group 4 alternatives Alternative 3-1 has higher traffic volumes on Highways 401, 407 and 400 with potential for increased local air quality impacts New corridor sections west of Highway 410 will have no noticeable effect on local air quality in surrounding areas. Minor impacts could occur east of Highway 410, depending on where the route is located. The Group 4 alternatives have slightly reduced traffic volumes (compared to Alternative 3-1) on Highways 407 and 400 (potential for slightly reduced local air quality impact), with slightly more volume on Highway 401 (potential for slightly increased local air quality impact) 56

 - have highest potential to impact cultural environment CN Crossing of Credit River Highway 10 South of")
57 Cultural Environment Includes built heritage features, cultural landscape and archaeological resources Group limited potential to impact cultural environment because most areas are previously disturbed either through highway construction or urbanization Group 4 alternatives - increased potential to impact cultural environment Longest new corridors (Groups 4-4 and 4-5) - have highest potential to impact cultural environment CN Crossing of Credit River Highway 10 South of Claude 57


58 Constructability Analysis Special Areas 407 ETR Connections with Existing Highways 400, 427, 410 and 401 HWY 400 HWY ETR 407 ETR There may be difficulty in widening the 407ETR through these interchanges due to the complex layout of ramps and structures (including bridge piers). The yellow lines illustrate the difficulty in adding additional collector lanes in each direction. The circles show the approximate locations of the existing piers. Horizontal and vertical alignment of collector lanes will be constrained by existing bridge piers. The freeway-to-freeway interchanges may need to be rebuilt to accommodate a core/collector system. Key challenges: Difficulty in construction staging / constructability (detour) Impacts during construction Impacts to adjacent roadway 58

59 Constructability Analysis Special Areas HIGHWAY 407 TRANSITWAY: Widening of 407 ETR beyond 10 lanes (to a core/collector system) has the potential to diminish the viability of implementing the 407 Transitway Mississauga Road Station Pine Valley Drive Station 59

60 Constructability Analysis Special Areas HIGHWAY 407 TRANSITWAY: Key Issues: Group 3-1 Alternative may eliminate some transit stations due to tight property limit and access (e.g. at Mississauga Road, Airport Road, Hwy 50, Pine Valley Drive, Weston Road, Highway 27, etc) Constructability of the 407 Transitway bridge crossings 407 ETR (4 locations) questionable Supporting Transitway infrastructure including Storm Sewer Management may no longer fit Other potential impact to Transitway - vertical profile, ramps and structures, grade separations, adjacent arterial roads, access to the stations and parking areas Mississauga Road Station Pine Valley Drive Station 60
61 Constructability and Cost Findings All alternatives have complex constructability issues: Alternative 3-1: 407 ETR Replacement of bridges, and realignment of arterial crossings for new bridge to maintain traffic Existing 8 and 10 lane sections will be severely affected by conversion to core/collector system. Reconstruction of freeway to freeway interchanges Constrained in many locations by urban development for widening beyond 10 lanes Rail bridge crossing may require major detour of rail lines, if feasible Group 4 alternatives: Highway 401 Widening through the Niagara Escarpment / Greenbelt area west of Milton Based on a high level analysis of construction costs, Alternative 3-1 cost is between 2-9% higher than Group 4 alternatives 61
62 Overall Assessment The following summarizes the study team s analysis of the Group #3 and Group #4 alternatives: Alternatives 4-3, 4-4 and 4-5 would all provide adequate capacity to address future transportation needs Alternatives 4-4 and 4-5 offer improved connections to support economic growth in Kitchener/Waterloo and Guelph, however, the additional economic benefits over the other alternatives are marginal Alternatives 4-2 and 4-3 provide very good connections among major employment nodes benefiting goods movement and creating opportunities for new inter-regional transit services New corridor alternatives have more significant environmental and community impacts than widening existing highways, particularly 4-4 and 4-5 New corridor alternatives avoid some of the significant constructability issues associated with Alternative 3-1 All of the new corridor alternatives together with required widenings have similar construction costs Alternative 3-1 is more costly to construct and would have severe constructability issues, severe negative impact on the 407 Transitway, as well as more impact to community and economy during construction 62
63 Overall Assessment Preliminary Planning Evaluation of Alternatives OVERALL ASSESSMENT Natural Group 3-1 Group 4-1 Group 4-2 Group 4-3 Group 4-4 Group 4-5 Land Use/Social (includes Air Quality) Cultural Economic Transportation Performance Cost and Constructability Most Preferred Least / Not Preferred 63


64 Draft TDS Elements Build on current initiatives of Metrolinx RTP and GO 2020 Integrate additional inter-regional transit linking western urban centres Optimize use of existing transportation infrastructure through TDM and TSM measures Encourage means of shipping goods other than by truck Widening of area highways to provide additional capacity including HOV and multimodal uses New transportation corridor from Highway 400 westerly 64


65 What s s Next Develop the draft Transportation Development Strategy Various stakeholder meetings in May and June 2010 PIC #4 in June 2010 June 14 th, 4:00 to 8:00pm Caledon, Brampton Fairgrounds June 15 th, 4:00 to 8:00pm Woodbridge, Le Jardin Conference and Events Centre June 16 th, 4:00 to 8:00pm Georgetown, Mold Master Sportsplex June 22 nd, 4:00 to 8:00pm Brampton, Snelgrove Community Centre June 24 th, 4:00 to 8:00pm Guelph, River Run Centre Transportation Development Strategy 65