Sustainable Intermodal Freight Transportation
|
|
|
- Marlene Terry
- 5 years ago
- Views:
Transcription
1 Sustainable Intermodal Freight Transportation Options in the Great Lakes: Development and Application of a Great Lakes Geographic Intermodal Freight Transport Model JAMES J. WINEBRAKE, PHD ROCHESTER INSTITUTE OF TECHNOLOGY GLMRI UNIVERSITY AFFILIATES MEETING 26 SEPTEMBER 2008


2 Overview of Presentation Background Project Goals GL-GIFT Model Modeling a Route Example Cases Future Work Conclusion


3 Background Current Great Lakes freight is dominated by bulk cargo: iron ore, coal and grain. No regular container service and few Rollon-Roll-off (RoRo) ships. Emergence of containers as a possible new opportunity
4 Background: Great Lakes Freight Approximately 40% of all U.S. freight has an origin and/or destination in the Great Lakes states (IL, IN, MI, MN, NY, OH, PA, WI). GL Avg. Non-GL Tonnage GL Value Value Tonnage Non-GL Avg. Value (kton) ($B) ($/ton) (kton) Vl Value ($B) ($/ton) Road 5,146,870 $3,390 $ 659 6,110,261 $5,055 $827 Rail 620,635 $ 135 $ 218 1,119,195 $ 152 $136 Water 219,069 $ 15 $ ,168 $ 61 $189 Air+Road 1,102 $ 55 $50,742 1,812 $ 106 $58,757 Rail+Road 18,888 $ 46 $ 2,465 16,953 $ 12 $760 Pipeline & Unk. 1,289,487 $ 373 $ 290 2,389,858 $ 753 $315 Other Intermodal 92,549 $ 425 $ 4,592 66,769 $ 498 $7,464 TOTAL/AVG. 7,388,600 $ 4,442 $ ,028,016 $6,640 $662 Data Source: 2002 Dept. of Transportation Freight Analysis Framework


5 It is a Sea of Opportunity in fact, three C s Commerce Congestion Climate
6 Opportunities: Commerce Continued growth in domestic, cross-border, and import/export trade means that traffic volumes could soon be sufficient to achieve the economies of scale needed to support a viable and competitive cargo vessel service within the GLSLS system. In fact, all container traffic through the region is expected to grow by a factor of up to 2.5 times current volumes by 2050 and about one-third of this could be moved using the waterway. (p. 100, GLSLS Study, 2007)


7 Opportunities: Congestion One way to ease traffic congestion is shortsea shipping The objective is to reduce travel time, avoid congested routes and reduce cost. For example, goods that normally travel by truck through congested metropolitan areas might be rerouted across a lake, if fast and cost-effective water transport were available. (p.99, GLSLS Study, 2007)
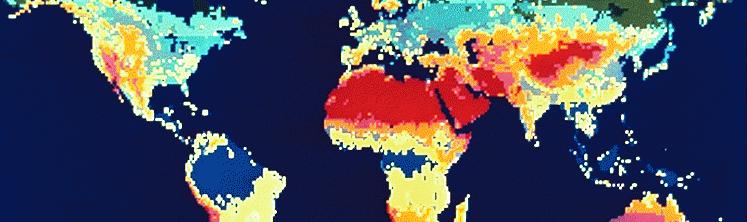
8 Opportunities: Climate 10,000 Mode gco 2 /tkm Truck 153 Rail 13 Ship (Dom.) 19 Gt tkm/yr and TgCO2/ /yr 1, Air Truck Rail Ship (Domestic) Air Gtkm/yr TgCO2/yr Values in the above table are based on top-down analysis; emissions factors can change considerably based on specific cargo and mode characteristics. Data from the BTS, Special Release, Table 1-46b:
9 GL-GIFT Project Goals The goals of GL-GIFT are: Examine the potential for increased use of intermodal (ship, truck, and rail,) freight routes within the GLSLS region Determine potential for using the Great Lakes as a corridor for intermodal freight transport Illustrate how intermodal routes may affect economic and environmental costs Provide a tool for policy analysis, including tradeoff analysis across competing policy objectives Developed in ArcGIS 9.2 (migrating to 9.3) with expectations for web-access in the future

")


10 The Geospatial Intermodal Freight Transport (GIFT) Model Railroad Network Highway Network Intermodal Connections User-Defined Segment and Transfer Costs Waterway Network


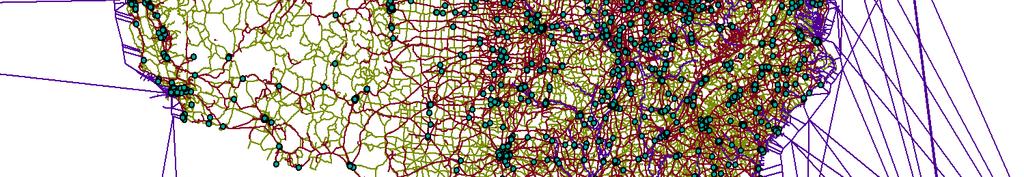

11 GIFT North American Network
12 The Great Lakes GIFT Network (GL-GIFT)
13 Obstacles: Data Inconsistencies


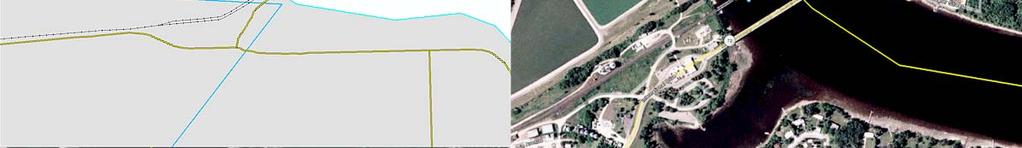
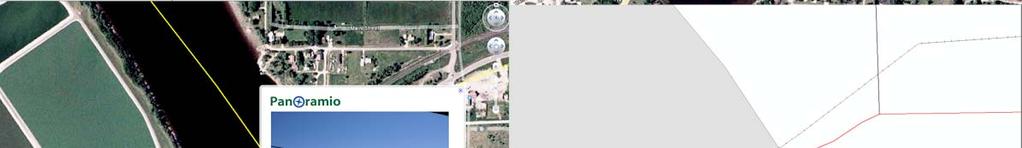
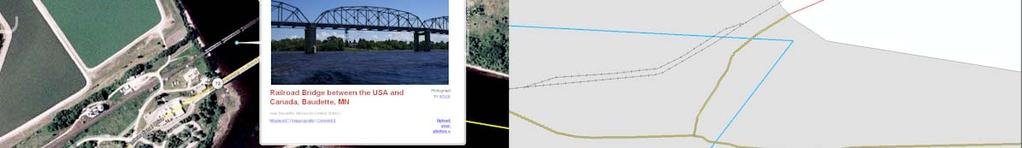
14 Obstacles: Confirming Facility Locations Port facility locations were investigated by comparing data with satellite imagery. When inconsistent, actual port location coordinates were extracted from imagery and used to construct the intermodal network.


15 GIFT Operation: Modeling a Route NTAD, ACE, Canadian Data, etc. Input Origin/Destination Cost/Emission/Time Factor Database Select Evaluators and Optimization Parameters Network Analyst Optimization i i Algorithm Optimize Route for Desired Parameter 3
16 Example Cases


17 Container Movement: Cleveland to Toronto Container vessel based on cargo vessel: DUTCH RUNNER MAIN ENGINE: Wärtsilä 6R32D POWER: 2250 kw SPEED: 13.5 mph
18 Example Inputs Emission Rates (g/teu mi) $/TEU mph Transport Mode CO2 PM10 Cost Speed Truck $ Rail $ Ship $ Emissions factors for modes from GREET, TEAMS, EIA, BTS, and other sources; emissions factors for spokes (transfer facilities) based on bottom-up analysis using EPA off-road emissions models. Costs from various sources (e.g., Global Insight study) user needs to define. Values very much dependent on cargo, technology, and mode type. Example does not include such things as delays at border crossings, congestion delays, or bottom-up calculations for operating costs (e.g., tariff structure). These can be input by the user based on the case being evaluated.

19 Useful for evaluating tradeoffs and running experiments i for f diff different input values (e.g., costs, speed, emissions). Can be helpful for determining green supply l chain h i pathways. Case Study I Primary Mode Cost ($) Time (hrs) CO2 (kg) Ship Truck Rail
20 Useful for exploring infrastructure and technology h l iinvestment decisions. For example, we could look at varying time delays to mimic port expansion i options. ti Case Study I

 CO2 (kg)")


21 Case Study II Primary Mode Cost ($) Time (hrs) CO2 (kg) PM (g) Ship Truck Rail Note that we do not (yet) account for congestion in this case study, which will affect emissions and time..
22 Future Work Continue to Refine the GL-GIFT Model Validate the capabilities of intermodal transfer facilities Expand interface to allow bulk and container traffic, and bottom-up calculations of emissions and costs Allow for variable speed limits for each network (road, rail, and ship) to improve time-of-delivery accuracy Improve usability of the model and make web-accessible Generate case studies that will be useful in comparing policies (both public and private) Host a workshop to demonstrate the model and obtain feedback from potential users
23 Conclusions Multiple opportunities exist to increase intermodal freight transport in Great Lakes region. GIFT allows policy makers to assess the attributes of potential freight projects. GIFT can evaluate and optimize individual routes or sum multiple routes to characterize emissions on a larger scale. GIFT allows modification of parameters (cost, speed, emissions, loading time, etc.) to prospectively evaluate policy changes. GIFT allows for trade-off analysis and identification of optimal modal choice depending on policy objectives GIFT can be used to explore impacts of congestion, infrastructure improvement, changing g economic conditions, new technology, etc.

24 The GL-GIFT Team Research Team Dr. J. Scott Hawker, Software Engineering, i RIT Dr. Karl Korfmacher, Environmental Science, RIT Dr. James J. Winebrake, STS/Public Policy, RIT Dr. James J. Corbett, Marine Studies, UDEL Bryan Comer, RIT Graduate Student Chris Prokop, RIT Graduate Student Acknowledgements Aaron Falzarano, RIT Graduate Sai Ketha, RIT Graduate Colin Murphy, RIT Graduate Ben Weisberg, RIT Graduate Sid Pendelberry, RIT ITS Special thanks to:
25 For more information about the Laboratory for Environmental Computing and Decision Making (LECDM) or GIFT please visit
26 SS. Badger Expansion Operates between Ludington, MI and Manitowoc, WI. Capable of carrying 120 Heavy-Duty Trucks with trailers. Can accommodate oversized loads. Currently operates two round trips daily. Cost: $ per truck. Alternative is mile driving trip. What if there were additional service? What if this service were subsidized to reduce cost to freight trucks?
27 Links to information used to put together the Canadian piece of the network. Border Crossings between the US and Canada iki/list of _States_border_crossings Canadian Ports Canadian Rail Lines cilities/intermodal/default.htm