LATC: Executive Series Old Country Ranch Club. January 9, 2018 BUSINESS UPDATE. Dr. Noel Hacegaba. Managing Director and. Chief Commercial Officer
|
|
|
- Alvin Collins
- 5 years ago
- Views:
Transcription
1 LATC: Executive Series Old Country Ranch Club January 9, 2018 BUSINESS UPDATE Managing Director and Dr. Noel Hacegaba Chief Commercial Officer
2 Agenda Business performance by line of business Industry updates Supply chain trends New business opportunities Customer outreach and engagement
3 Container Volumes (CY2017) ($225 million in operating revenues) 2017 vs 2016 JAN FEB MAR APR MAY JUN JUL AUG SEP OCT NOV Terminal A 91.34% % 33.08% % % % -9.84% -0.71% -8.91% 1.51% -7.61% Terminal B % % % 14.21% 11.35% % -6.35% -3.11% 1.02% -8.68% 3.60% Terminal C 66.98% 77.79% % % 43.74% 27.64% 91.83% -2.73% 31.77% 16.92% 9.55% Terminal D 20.51% 40.92% 46.51% 35.48% % -0.93% % % % % -0.10% Terminal E % % % 14.05% 9.75% 4.13% -7.40% 58.66% 25.85% 13.63% -7.36% Terminal F -8.24% % % -5.04% 10.68% 23.37% 40.24% 13.88% % 77.91% 78.11% Monthly YOY % Cumulative CYTD % 8.67% % 8.72% 16.53% 1.21% 9.18% 13.06% 8.01% 28.31% 15.02% 14.66% 8.67% -1.51% 1.53% 5.05% 4.13% 5.06% 6.36% 6.59% 8.92% 9.54% 9.98% YTD 6,847,589 TEUs
4 Annual Container Volumes 2017 (proj) million TEUs ,775, ,192, ,820, ,730, ,045, ,061, ,263, ,067, ,487,816
5 Pier A (SSA) 782,000 TEUs Pier C (Matson) 346,000 TEUs Pier T (TTI) 2,073,000 TEUs Pier E/F (LBCT) 1,408,000 TEUs Pier G (ITS) 1,113,000 TEUs Container Volumes Projected (CY2017) Pier J (PCT) 1,823,000 TEUs
6 Container Volume Drivers New Ocean Carrier Alliances New Ad-Hoc Services COSCO/PIL/Wan Hai Med-Pac Service Deployment Fine-Tuning New Ownership at TTI (Pier T)
7 Non-Container Volumes (Q1-Q3 2017) ($150 million in operating revenues) CY2017 YTD CY2016 YTD % Change FY2017 YTD FY2016 YTD % Change Liquid Bulk 25,178,092 23,473, % 32,627,744 31,174, % Dry Bulk 5,577,728 4,769, % 7,142,427 6,008, % Break Bulk (Including 512, , % 678, , % SAR) Break Bulk (Less SAR) 489, , % 650, , % Automobiles 219, , % 302, , % Lumber 194, , % 262, , %
8 Market Share ( Total Volume) 60.00% 50.00% 40.00% 30.00% 20.00% 10.00% 0.00% SPBP vs All U.S. Ports USWC vs All U.S. Ports USEC vs All U.S. Ports USGC vs All U.S. Ports
9 Market Share ( ) 70.00% 60.00% 50.00% 40.00% 30.00% 20.00% 10.00% 0.00% SPBP vs All U.S. Ports USWC vs All U.S. Ports USEC vs All U.S. Ports USGC vs All U.S. Ports
10 Ocean Carriers on the Move Ocean Network Express to deploy newlyintegrated services (Q2 2018) COSCO to acquire OOCL (Q2 2018) SM Line, HMM poised to grow business Big ships getting bigger
11 Average Size Vessel AVG Vessel Size (TEU) YTD POLA 6,170 6,894 7,082 7,157 7,474 POLB 5,874 6,372 6,983 7,655 7,788


12 Vessels on Order

13 Future Vessel Deliveries
14 Ocean Freight Rates (SCFI) , , SCFI (USD/FEU) Comprehensive Index /1/2016 1/22/2016 2/12/2016 3/4/2016 3/25/2016 4/15/2016 5/6/2016 5/27/2016 6/17/2016 7/8/2016 7/29/2016 8/19/2016 9/9/2016 9/30/ /21/ /11/ /2/ /23/2016 1/13/2017 2/3/2017 2/24/2017 3/17/2017 4/7/2017 4/28/2017 5/19/2017 6/9/2017 6/30/2017 7/21/2017 8/11/2017 9/1/2017 9/22/ /13/ /3/ /24/ /15/2017 Hanjin Bankruptcy Shanghai/USWC Shanghai/USEC Comprehensive Index
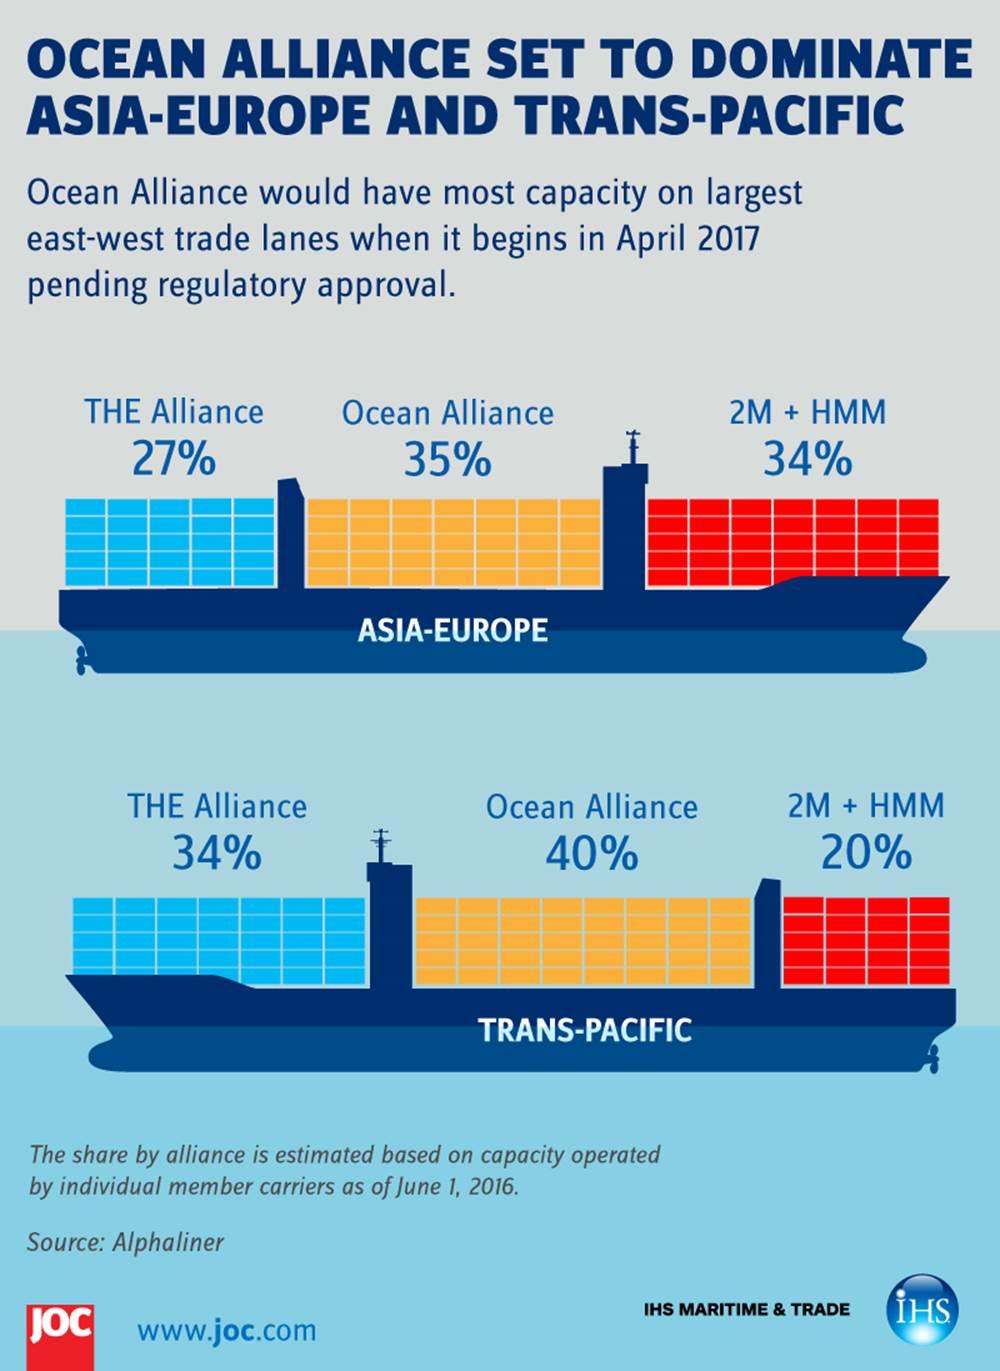
15 Industry Consolidation Over 50% of global TEU capacity is moved by the top three ocean carriers 2M+H, Ocean Alliance and THE Alliance collectively move 82% of the world s containers...and 94% in the Trans-Pacific trade lane
16
17 Ocean Carrier Alliances Ocean Carrier Alliances Q (20 Carriers) 2M CKYHE G6 Ocean 3 N/A Maersk MSC COSCO Evergreen Hanjin K Line Yang Ming APL Hapag-Lloyd HMM MOL NYK OOCL China Shipping CMA CGM UASC Ocean Carrier Alliances Q (13 Consolidated Carriers) 2M+H OCEAN THE N/A HMM Maersk/H. Sud MSC CMA CGM COSCO/OOCL Evergreen K Line/MOL/NYK Hapag-Lloyd/UASC Yang Ming PIL SM Line Wan Hai ZIM Hamburg Sud PIL Wan Hai ZIM
18 New Ocean Carrier Alliances OCEAN Alliance 2M+H Alliance Independent Carriers THE Alliance

19 This image cannot currently be displayed.

20 Pier A/SSA 3 Berths 10 Cranes 50 Design Depth Pier C/SSA 1 Berth 3 Cranes 42 Design Depth Pier T/TTI 3 Berths 14 Cranes* 55 Design Depth *Crane heightening to accommodate 20,000-TEU ships by 2020 Pier E/LBCT 3 Berth 14 Cranes* 55 Design Depth Project will accommodate 22,000-TEU ships by 2019 Pier G/ITS 3 Berth* 17 Cranes 52 Design Depth Berth extension to accommodate 14,000-TEU ships in the near future Pier J/PCT 5 Berth* 14 Cranes 55 Design Depth Wharf strengthening to accommodate 18,000-TEU ships in the near future
21 Port s Role in Optimizing Operations -Facilitating communication and collaboration -Enabling innovation and information-sharing -Enhancing velocity and reliability -Creating value for the end-user


22 Free Flow (Peel Off) 22

23 Reservation System (Appointments) 23

24 Chassis Availability and Fluidity 24
25 Predictive Analytics

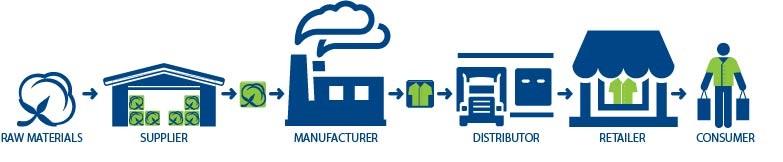
26 Supply Chain Trends
27

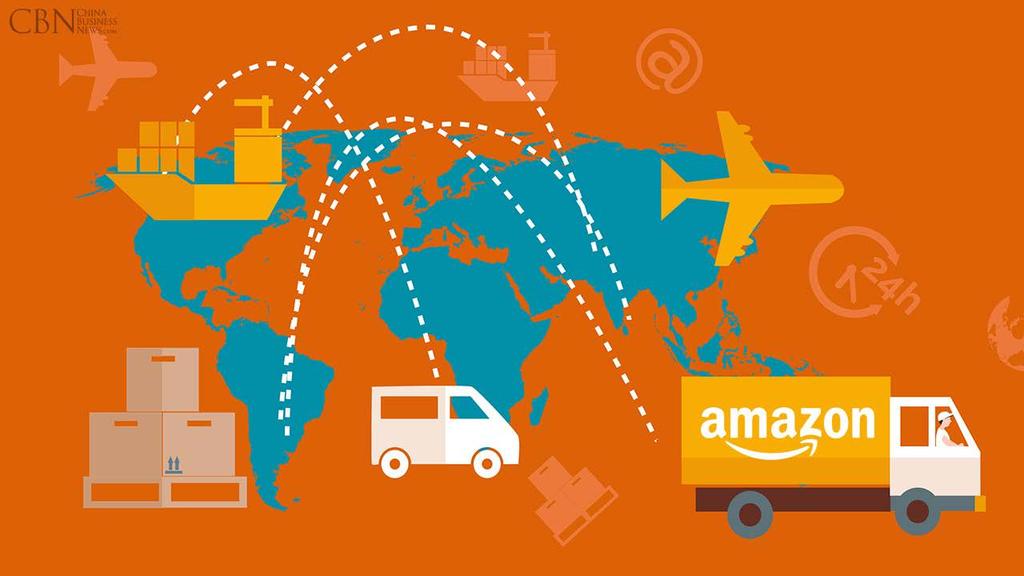
28 Turbulent Atmosphere - Amazonization The 360 Consumer - Anywhere, Anyway, Anytime 28

29 Network Transformation 1-DC Network 2-DC Network 29
30
31 Container Import Targets Big Box Retailers Footwear Industry Garment, Textile and Fashion Industry
32 Container Export Targets Plastic Resin Frozen Proteins (beef, poultry, pork) Agricultural export match-backs
33 LATC: Executive Series Old Country Ranch Club January 9, 2018 BUSINESS UPDATE Managing Director and Dr. Noel Hacegaba Chief Commercial Officer