SafetyAnalyst: The Georgia Experience
|
|
|
- Imogen Dixon
- 5 years ago
- Views:
Transcription
1 SafetyAnalyst: The Georgia Experience Priyanka Alluri Graduate Research Assistant Jennifer Ogle, Ph.D. Assistant Professor Department of Civil Engineering Clemson University, Clemson, SC July 26, th International Forum on Traffic Records & Highway Information Systems New Orleans, Louisiana

2 Overview of this presentation 2 Background Georgia s project and data sets Data issues and solutions Recommendations to states SafetyAnalyst

3 Background 3 SAFETEA-LU Strategic Highway Safety Plan Mandated for federal $$ Requires Data Driven Approach for identifying improvement locations and to evaluate outcomes of improvements 5% Reports Rqmt: at least 5 % of states locations currently exhibiting the most severe highway safety needs
4 Background contd 4 Site Safety Improvement Process [Hauer, E. et al., 2002; Hauer, E. et al., 2004] Site Identification Detailed Engineering Survey Treatment Selection Treatment Prioritization System-wide improvements vs site specific improvements
5 List of methods for site selection 5 Accident counts Crash frequency Equivalent property damage only (EPDO) Crash rate Rate quality control Level Of Service of Safety (LOSS) Proportions of accident counts High proportion of crashes Potential for safety improvement Empirical Bayes Method using SPFs SafetyAnalyst Highway Safety Manual NEW
6 Total number of crashes Issues with rates 6 B A Crash rate for (A) Safety Performance Curve Similar crash performance with increase in traffic gives better rate Crash rate for (B) Average Annual Daily Traffic (AADT) Rate Misleading Effect (Qin, X. et al., 2005) Crashes still as bad or worse


7 What is SafetyAnalyst? 7 Network Screening state-of-the-art analytical tool for making system wide safety decisions. Diagnosis and Countermeasure Selection Economic Appraisal and Priority Ranking Countermeasure Evaluation
8 SafetyAnalyst 8 Data Management tool: Files are Imported, Post processed and Calibrated Analytical tool: All modules in SafetyAnalyst Sites could be queried based on site subtype, area type, crash type, etc. Administration tool: Data items could be added or removed* Data recoding could be done based on the available data Default SPFs could be replaced with the state specific SPFs


9 SafetyAnalyst 9 Import files required for: segments: Roadway segment info Segment traffic Crash history Intersections: Intersection info Major road traffic Minor road traffic Leg specific information Leg traffic Leg turning movements Crash history
10 Georgia Datasets 10 Roadway segments Total # of segments used: 209,636 Crash Data for three years ( ) Only segment related crashes were considered (i.e. Crashes at intersections and ramps are excluded) Total # of segment related crashes used: 442,233 Segment traffic Traffic data for all segments for the years
11 General Problems with the datasets 11 Missing data Traffic information is not available for some of the segments Miscoded data Ex: Coding errors with area type, traffic volume etc Rural Urban Rural
12 General Problems with the datasets contd 12 Coding Mismatch
13 General Problems with the datasets contd 13 Fit of SPFs used in SA to the Georgia data
14 Minimum required variables for SA 14 Agency ID Location system Route type Route name County Area type Access control # of thru lanes in each direction Median type Median width Operation way Interchange influence Roadway class

15 Possible errors and warnings in import process 15 Accidents are not located on any roadway segment There is no traffic data associated with the segments The traffic data and/or the growth factor is unrealistic Segments do not fall under any of the predefined site subtypes
16 16 Possible errors and warnings in import process- Specific Examples The traffic data and/or the growth factor is unrealistic RCLINK Beg measure End measure AADT ,000 31,000 32, ,000 31,000 32, ,000 31,000 32, , ,000 32, ,000 31,000 32,000
17 17 Possible errors and warnings in import process- Specific Examples Segments do not fall under any of the predefined site subtypes SA has divided sites into sub types based on the area type, facility type, # of lanes, presence of median etc.. Some of the roadway segments might not fall into any of the categories and are left out from analysis. Ex: Reversible/ Contra-flow lanes HOV lanes
18
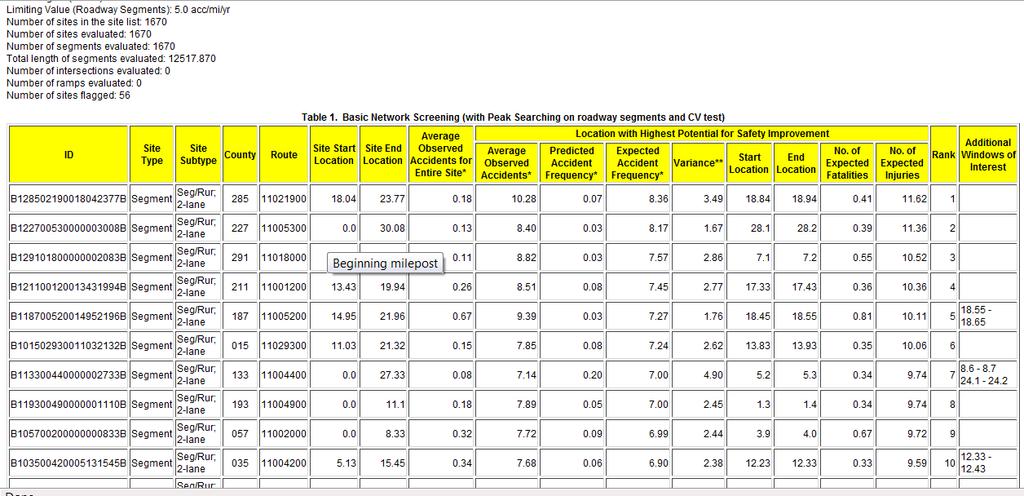
19 Various columns in the SA output 19 ID Site type Site subtype County Route Site Start Location Site End location Avg. Observed crashes for entire site Location with highest Potential for Safety Improvement (PSI) Avg. Observed Crashes Predicted Crash Frequency PSI Expected Crash Frequency Variance Start Location End Location No. of expected Fatalities No. of expected Injuries Rank Additional windows
20 Unrealistic results with SafetyAnalyst 20 Site Start Loc. Site End Loc. Seg Length (mi) Location with Highest Potential for Safety Improvement Average Observed Accidents acc/mile/yr (SPF) Predicted Accident Frequency acc/mile/yr (PSI) Expected Accident Frequency acc/mile/ yr Variance acc/sq.mile/yr SA Rank , , ,
21 21 Ranking of two-lane rural roadways in Georgia based on different selection criteria Ranking Method Agency Id SA rank Crash Freq Crash Rate Critical Crash Rate HS Length (mi) B B , B B 2 1 5,744 1, B B ,392 1, B B B B B B ,025 2, B B ,229 2, B B ,889 Not ranked 3.37 B B 9 5 5,822 1, B B
22 22 Ranking of two-lane rural roadways in Georgia based on different selection criteria Agency Id Crash Freq Ranking Method Crash Rate Critical Crash Rate Length (mi) SA B B 1 5,744 1, B B 2 9,951 Not ranked B B 3 9,858 Not ranked B B 4 4,433 1, B B 5 5,822 1, B B 6 10,396 Not ranked B B 7 9,354 3, B B 8 6,421 1, B B 9 10,314 Not ranked B B 10 6,762 2,022 Not ranked 21.99
23 Future Data Needs 23 Collecting and Estimating AADT info Tracking changes in roadway characteristics Tracking implemented countermeasures
24 After Segments it s on to Intersections 24 Challenges with Intersection data Minimum available data on - Direction of legs - Leg information in each direction -# of turn lanes, AADT, presence & length of auxiliary lanes - Type of the traffic control
25 Summary (pros) 25 SA uses EB method and addresses to the issues of traditional methods SA divides roadway network into site subtypes and generates homogeneous segments SA performs all the steps in site safety improvement process and is mostly automated SA doesn t require statistical expertise SA performs basic data quality checks and logs a list of errors, warnings and potential issues with the data
26 Summary (cons) 26 SafetyAnalyst costs $$$ Initial generation of import files is tedious Data requirements are stringent SA could be a blackbox Site specific predictions are not as detailed as HSM predictions Prescriptive error handling
27 Conclusions 27 SafetyAnalyst better identifies problematic sites in comparison to other basic site selection methods SafetyAnalyst does a lot more than just identifying problematic sites SafetyAnalyst does have a learning curve, but can be accomplished without extensive statistical background All of the SafetyAnalyst data elements are included in MMUCC except one
28 Conclusions contd How to start 28 Start with 1 county and/or 1 roadway type and with segment data Determine which is a better way: tweaking the state s data or the data attributes in SA Determine if the default SPFs used in SA represent the state s data well. Run SA and understand the report Fix any issues and then run the state s data

29 29 Thank you